



Square
Following
Hot
News
Profile
Share your thoughts
placeholder
Article
$SIREN What’s so impressive about a 44% one-day pump? Let’s see it avoid a sharp wick down. The 24h low was 0.0203 and the high was 0.0332, a 63% swing. This isn’t a pump—it’s a meat grinder. The 95.9M trading volume shows that the tokens have already changed hands like crazy. There’s only one bullish argument: this kind of volume isn’t something retail traders can generate. If the pullback to 0.028-0.030 holds, that’s a second entry point; set the stop-loss at 0.026—if it breaks, even the whales have lost their nerve. The bearish case is even stronger: a 44% gain combined with massive 95.9M v
SIREN+6.77%
$NEAR NEAR Breaks Out of a 4-Year Descending Channel: TP1: $11
NEARUSDT
Weekly Time Frame:
NEAR (1W, log scale) is breaking out of the descending channel that has defined price action since the 2022 top, and the weekly candle is now pushing above the upper boundary.
What the chart shows:
After the 2022 high (~20.6), price spent years in a descending channel, bottoming around the 0.9 area in early 2026.
Since that low, price has risen sharply and is now trading at ~5.4, above the channel’s upper trendline.
The breakout is happening at the 2024 volume profile POC (~5.2), so the trendline and a h
post-image
NEAR+9.19%
Zero Hunters Crypto Lounge 🎯 | Historical Bangla Adda
live-cover
LIVE792
Range-bound SKHYNIX is about to break out and most traders are positioned the wrong way.

$SKHYNIX /USDT - SHORT

Trade Plan:
Entry: 971.37 – 978.79
SL: 1010.69
TP1: 948.37
TP2: 930.56
TP3: 903.85

Why this setup?
Why now? The daily trend is range, but the 1h ATR of 14.839521 signals a squeeze is building inside that range. The 15m RSI at 58.85 shows momentum is not yet exhausted, so a short entry near 975.08 is valid as long as we stay below 978.79. TP1 at 948.37 and TP2 at 930.56 define the first two targets on the path down, while the invalidation level of 1156.63 is the hard line that w
SKHYNIX-3.64%
$CORE Everyone, do you think it will reach 2u?
post-image
CORE-0.30%
BREAKING: Google reduces quantum computing errors by 40x using magic state cultivation on its Willow processor, published in Science.
post-image
GOOGL+0.37%
In this $ZRO move, which step is easiest to be fooled by?
When I looked at $ZRO again, I first covered up the 24-hour +9.37%. It’s not that this number is unimportant, but it is too good at grabbing attention. What really needs explaining right now is that after $ZRO’s sharp 24-hour rise, momentum and continuation are not the same thing. I won’t extrapolate the large move that has already happened into the next leg; I’ll first see whether the price can hold in the new range.
The most convenient—and easiest to get wrong—reading is that the gainers and losers list records the past, while the mo
post-image
ZRO+9.49%
I can't be the only one 😭
post-image
$AKE I've been positioning for a long time, and it has finally taken off. I'll sell everything once it doubles.
post-image
AKE+18.43%
10.16 $BNB Strategy chart 1 is the BNB 4-hour candlestick chart, and chart 2 is the BNB hourly candlestick chart.
From the larger timeframe in chart 1, we can see that BNB has touched the lower major ascending trendline today, namely the positions at 10 a.m. and 10 p.m. on October 15, corresponding to 708 and 712, respectively. Given the very obvious signs of price control in BNB recently, when BTC falls and ETH falls, BNB can always recover its price after falling.
If the broader market continues to make new lows in the near term, BNB is very likely to break below this 4-hour ascending trend
BNB+0.14%
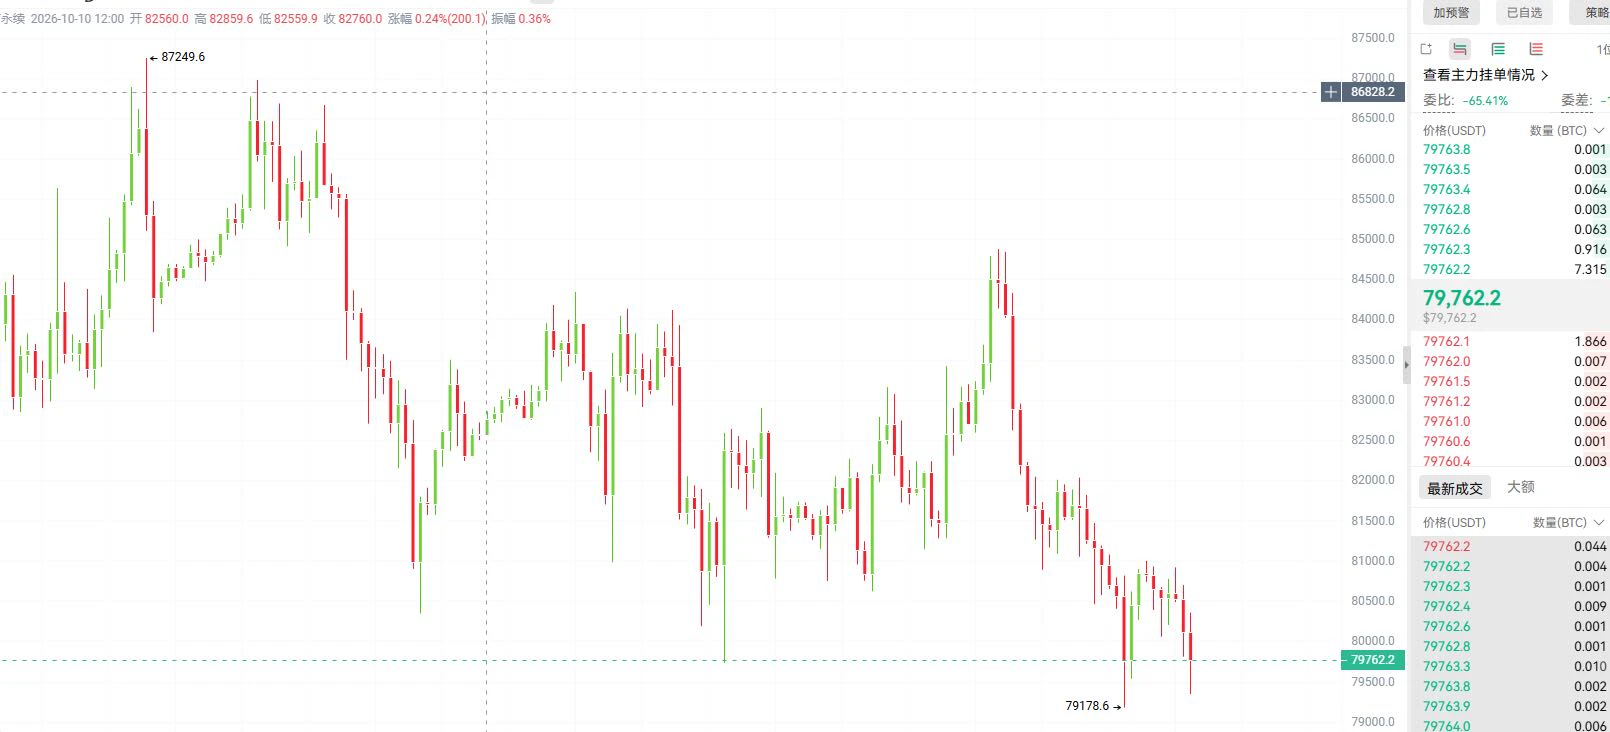
$BTC Bitcoin is bouncing after a sharp rejection
Bitcoin is bouncing after a sharp rejection and is trying to reclaim structure from the recent breakdown. Price has pushed back above the key support area near $81.6K, which is a positive short-term sign.
The main level to watch now is the $82.4K–$82.8K zone. That area is acting as resistance, and BTC still needs a clean break and hold above it to confirm stronger upside momentum. If that happens, the next move could target the higher resistance region around $83.6K+.
On the downside, if BTC loses $81.6K again, the bounce could fail and price ma
post-image
BTC+0.99%
JUST IN: MSCI to remove Michael Saylor's Strategy $MSTR from its indexes.
MSCI+2.49%
MSTR+5.58%
On October 16 $ETH , the ETH strategy is actually very similar to the BTC view; both are headed in the same direction, as discussed during the livestream.
Currently, 2545 is the resistance level. After the decline from the October 7 starting point, there was a natural rebound high when the price fell to 2545. This high, 2586, is tentatively set as an anchor point. From the price action, 2545 was broken and reclaimed twice. The second time, the price did not touch the area above 2545, so we will enter short in the area of selling pressure here, taking shorts in the 2500–2530 range.
The hard sto
post-image
ETH+1.62%
  • 3
“You’ve been in crypto for 4 years, so you must be rich by now, right?” Me: a deeply relatable $ZE l $HYPE l $SUI holder
post-image
HYPE+2.05%
SUI+1.01%
Interesting turn 😳
$OTHETS / $BTC turned positive
#Altcoins outperformed BTC today
post-image
BTC+0.98%
$PI The old system will not collapse because of hacking, but because it is completely abandoned. Don’t panic, adapt.
As traditional finance decays, sovereign protocols like PiNetwork replace it with real utility through RWA tokenization and immutable code
Change is underway.
Stay calm & build.
post-image
PI+1.55%
$SOL At this level, the market will most likely make a major move tomorrow. The funding rate has stayed positive for three consecutive days, with longs continuously paying interest to shorts. In this kind of structure, either a short squeeze sends prices surging, or the funding rate collapses first and the price follows. The same applies to ZK: whichever comes first, privacy or scaling, will gain pricing power. It’s still early. So what’s the conclusion? I haven’t figured it out yet either. Those watching it, keep an eye on #SOL.
post-image
SOL+1.21%
ZK+11.07%
The most unusual detail in today’s market action is not on the gainers list, but in the volatility structure: $CRCLB rose 9.20% over 24h, while the 30-candle range has already reached 14.77%; the price is running along the Bollinger upper band at 89.77, RSI 68.5 is approaching the overbought zone, while the Fear & Greed Index is only 53 (neutral). This means the rise is driven by capital rather than overheated sentiment, but it also shows that once bullish momentum fades, the high volatility will amplify the downside—at this point, the risk-reward ratio of chasing longs is not attractive.
Tec
post-image
BNB+0.12%
$BTW Long plan: 4-hour chart support at 1.908–1.925
Buyers must hold this area to maintain dominance. I will watch whether they can defend it here and avoid chasing the price. Why focus on this level: - The 4-hour price is 1.92, above the EMA50 at 1.81, favoring buyers - The stop-loss risk is 6.4%, while the potential TP3 gain is 10.3%, giving a favorable risk-reward ratio - BTC's short-term trend is bullish, providing support🟢 Long · Entry 1.908–1.925 · Take profit 1.990 / 2.039 / 2.113 · Stop loss 1.794
Not investment advice · Do your own research
post-image
BTW-21.91%
BTC+0.98%
Load More

Join 40 M users in our growing community

⚡️ Join 40 M users in the crypto craze discussion

💬 Engage with your favorite top creators

👍 See what interests you

Trending Topics

USSeptemberPPIBeatsExpectations

91.35k Views1.88k Discussing

US September PPI came in at 6.3% YoY, well above the 5.3% market expectation, pointing to renewed producer-side inflation pressure. Weekly jobless claims were 199K, broadly in line with forecasts. Could hotter inflation further reduce room for rate cuts, and what does it mean for $BTC, US stocks, and gold?

DrLinHanSpeaksAtOxfordUnion

135.63k Views1.86k Discussing

JapanAndKoreaStocksPlunge

47.27k Views1.76k Discussing

View More