





Square
Following
Hot
News
Profile
Share your thoughts
placeholder
Article
Gold’s intraday ten-win streak is interrupted!
Long at 4152, stop loss at 4145, -7 points, -1161🔪$XAUT
post-image
XAUT+1.34%
*BREAKING*
🇺🇸 US PPI Data: 6.3%
Expectations: 5.3%
#USSeptemberCPITopsEstimates
post-image
  • 2
AKE breaks out after consolidating around 0.032! Hot-money probing behind AKE’s single-day surge
The short-code AKE surged 28.99% in a single day to $0.032399.
No official standalone calendar or protocol updates were found. During the broader market rebound and active AI-themed trading, this was purely an intraday follow-through rally in a small-cap asset with thin capital.
Conclusion: Liquidity is relatively thin, making it an intraday scalping target for hot money with no fundamental support—take profits while you can.
‍#AKE #山寨币 #薄盘
$AKE #IntradayShortTermTrading
post-image
AKE+35.34%
$MYX MYXUSDT Medium-term Bullish potential!
The price is moving within a descending channel on the 1-hour timeframe. It has reached the lower boundary and appears to be preparing for a rebound; a retest of this boundary is expected, which could support an upward move.
The Relative Strength Index (RSI) indicates a bearish trend, but given the "oversold" condition on the 1-hour timeframe, there is a strong possibility of an upward breakout from this downtrend.
An orange trend line is present, providing support for an upward rebound.
There is an initial support level at 0.05373, which acts as a p
post-image
MYX-3.80%
BTC, GOLD, NVDA, AMD, ETH, XRP, SOL, SOXL, ADA, SUI, BTU, HNT, PEAQ, RE: Live TA
Watch now 👉
Ethereum is testing a critical decision point while Bitcoin holds $80K and altseason hangs in the balance, with The Trading Parrot tracking the S&P, VIX and gold into PPI. We work through Solana, Cardano, XRP, Sui, Helium, RE Protocol and PEAQ, plus Nvidia, AMD and BTU. Watch the full live TA now.
00:00 AI Stocks vs Crypto: Early Bull Debate
03:44 Bitcoin-S&P Coupling and AI Bubble Risk
04:37 Bitcoin One Hour: Double Bottom or Squeeze
06:06 Open Interest Band Grows to $470M
07:56 CPI Hot, PPI Incomin
post-image
BTC-2.56%
XAU+1.49%
NVDA-3.08%
AMD-5.74%
ETH-5.07%
Meet Machi Big Brother
This guy turned $56K into $12.25M in just 4 months, then managed to lose almost all of it
His ETH positions got completely liquidated, leaving him with just $21.7K in his wallet.
From $56K to $12M to $21K
What a fucking round trip
ETH-5.03%
$NEAR Current price: 4.601. The key short-term support is the lower Bollinger Band at 4.540, while resistance above is MA20 at 4.739. A break below the lower band would open room for further downside; only reclaiming MA5 at 4.631 would count as an initial stabilization.
Compared with other tokens in the same sector, NEAR has suffered the deepest decline in this round: -8.42% over 24h, significantly weaker than HYPE at -2.83%, while the rebounding NIL has already formed an MA5-crossing-above-MA20 structure. NEAR’s MA5 at 4.631 remains below MA20 at 4.739, with the moving averages in a bearish a
post-image
HYPE-2.83%
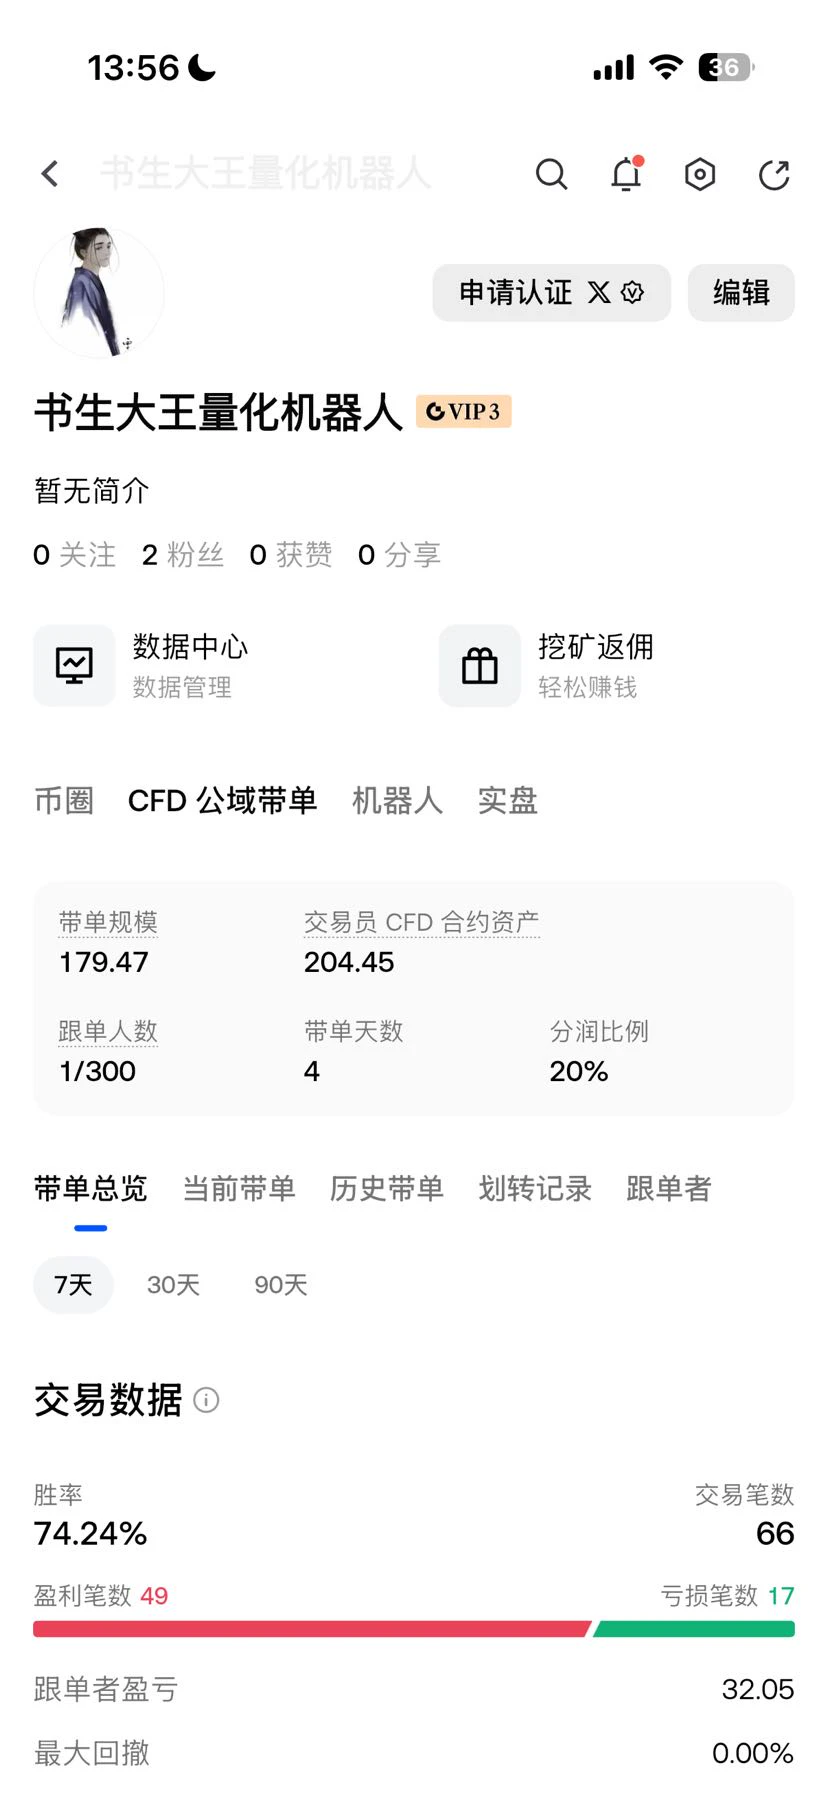
Sub-sites are still opening continuously; anyone who wants to become an agent can contact me.
The self-built main site: everyone who registers today will be switched to wholesale prices tomorrow.
Currently only offering GPT top-ups; the others will be integrated later.
(Actually, after restoring the prices, they didn't increase by much 😂)
post-image
$TRUMP : FROM -98% CRASH TO A POTENTIAL MASSIVE REVERSAL?
I WAS BEARISH SINCE JAN 2025. I called the $60–$70 EXIT zone. After reaching $79, #TRUMP crashed 98.29%. I NEVER told you to buy.
NOW, my SMC analysis shows a bullish flip + CHoCH!
Accumulation Zone: $1.80–$1.46
Targets: $5 → $10 → $20 → $45
SL: HTF close below $1.35
I'm DCAing small quantities gradually. Bullish bias activated!
Leverage: Accordingly | NFA & DYOR
post-image
TRUMP-3.23%
Gold: nine intraday wins
4152 long, 4158 exit, 6 points, 889🔪$XAUT
post-image
XAUT+1.34%
#每周来晒 #WCTCS9 #美国9月PPI数据公布
CPI just blew up—will PPI take over tonight? Time to position for longs early?
The aftershock of last night’s September CPI beating expectations across the board has yet to dissipate, and tonight at 20:30, the US September PPI will take the stage. This is the second hurdle of inflation week, and the market’s second test of just how sticky inflation really is after CPI proved it wrong. While we do not bet on the data, tonight’s Little God of Wealth plan is to position for longs early:
📊 Market expectations: Month-on-month growth is accelerating, and inflationary pre
post-image
BTC-2.56%
GLDX+1.12%
PAXG+1.29%
The 80,000 support level is really solid— all short positions have taken profit! The overall hourly trend is still bearish! The 15-minute chart shows signs of stabilization! Just watching and letting the institutions play out the trend themselves before saying more! #Bitcoin
BTC-2.55%
#USSeptemberPPIReleased 🌍🔥 Gate WCTCS9 Global Trading Competition! 🏆
Ready to compete on the global trading stage? 🚀
The Gate WCTCS9 Global Trading Competition brings excitement to the trading world, challenging traders to sharpen their strategies, manage risk, and aim for top performance. 📊💹
💎 Compete with traders worldwide
📈 Test your trading strategies
🏆 Aim for the leaderboard
🔥 Stay focused and trade smart
Success isn't just about taking risks — it's about making informed decisions and staying disciplined!
💬 Are you ready to join the global
post-image
Yesterday’s CPI data was bearish, with both the core monthly and annual rates exceeding expectations!
Tonight will bring the PPI data and the U.S. September retail sales monthly rate, both of which are also somewhat related to inflation.
PPI is the Producer Price Index. A reported figure > the expected figure is bearish,
and the same applies to the retail sales monthly rate: reported figure > expected figure = bearish!
Simply put:
Rising raw-material PPI (Producer Price Index) → higher production costs for factories → after some time, factories pass on the higher costs → higher supermarket ret
  • 1
AI hot stocks face a broad sell-off! Optical communications lead the decline, while chip and memory
live-cover
LIVE2,586
If Bitcoin pulls back to the 200-day moving average……
I’ll go all-in!
post-image
BTC-2.55%
10.15 BTC Analysis
The current market is showing a typical bearish alignment. After touching a high of 84322, the price formed a bearish engulfing pattern, followed by a continuous descending channel. Recent candlesticks have consecutively closed with solid bearish bodies, accompanied by long lower shadows reaching 80458, indicating some buying support below, but the overall center of gravity continues to move downward.
In terms of technical indicators, the price has decisively broken below the lower Bollinger Band at 80694, while the bands are widening downward. The middle band at 81400 has s
post-image
BTC-2.55%
$ALTS / #TOTAL3
This is the first meaningful retest of the weekly 12/21 EMA since the bullish crossover, which signalled a shift in higher-timeframe momentum.
Price is currently trading below support, which is not ideal. However, the key factor now is whether the 12/21 EMA can hold as support and preserve the bullish higher-timeframe structure, keeping the potential for further upside continuation intact.
#ShareWeekly
#USSeptemberPPIDataRelease
The Producer Price Index (PPI) for September will be released today at 20:30 Beijing time—and it could trigger a new wave of market volatility. Yesterday, BTC broke sharply to the downside, and now all eyes are on this release.
📊 What does the market expect from the PPI?
The consensus forecast calls for a 0.5–0.6% m/m increase in headline PPI (versus 0.4% in August)—the strongest increase in four months. Core PPI (excluding food and energy) is expected to come in at +0.3% m/m. On a y/y basis, headline PPI could slow to 5.3% from 5.4%, while core PPI c
MU-4.12%
AMD-5.74%
  • 2
BTC MARKET UPDATES
live-cover
LIVE2,424
Load More

Join 40 M users in our growing community

⚡️ Join 40 M users in the crypto craze discussion

💬 Engage with your favorite top creators

👍 See what interests you

Trending Topics

USSeptemberPPIBeatsExpectations

91.35k Views1.81k Discussing

US September PPI came in at 6.3% YoY, well above the 5.3% market expectation, pointing to renewed producer-side inflation pressure. Weekly jobless claims were 199K, broadly in line with forecasts. Could hotter inflation further reduce room for rate cuts, and what does it mean for $BTC, US stocks, and gold?

DrLinHanSpeaksAtOxfordUnion

135.63k Views1.86k Discussing

JapanAndKoreaStocksPlunge

47.27k Views1.74k Discussing

View More