



Square
Following
Hot
News
Profile
Share your thoughts
placeholder
Article
AI Stocks Are Bleeding, But Nvidia Is Buying the Dip in Europe
Nvidia is proving once again that while Wall Street panics, Jensen Huang keeps building.
Even with semi stocks trapped in their longest 8-day losing streak since 2015 -erasing over $1.6 trillion across the sector Nvidia is preparing a massive multi-hundred-million-euro AI deal with Germany.
What's dropping next week in Berlin:
Industrial AI & Robotics: Expanding beyond data centers into physical AI systems for autonomous vehicles and smart factories.
SOOFI Integration: Partnering with Germany's Sovereign Open Source initiative and
post-image
NVDA-0.28%
BTC+0.72%
🔹U.S. AI Stocks Stage a Strong Comeback! APLD and WDC both surge over 6. Are memory and computing p
live-cover
LIVE986
Trenches
Pokémon
P
bade
b
Pokémon
D42T...Xvb1
Market Cap
$.
Change
.
24h Vol
$.
Holders
.
AGT
A
bade
b
AGT
0x5d...e274
Market Cap
$.
Change
.
24h Vol
$.
Holders
.
Dacity
D
bade
b
Dacity
nxPq...pump
Market Cap
$.
Change
.
24h Vol
$.
Holders
.
COLLECTOOOR
C
bade
b
COLLECTOOOR
ESnW...pump
Market Cap
$.
Change
.
24h Vol
$.
Holders
.
STONK
S
bade
b
STONK
6GmA...UNgx
Market Cap
$.
Change
.
24h Vol
$.
Holders
.
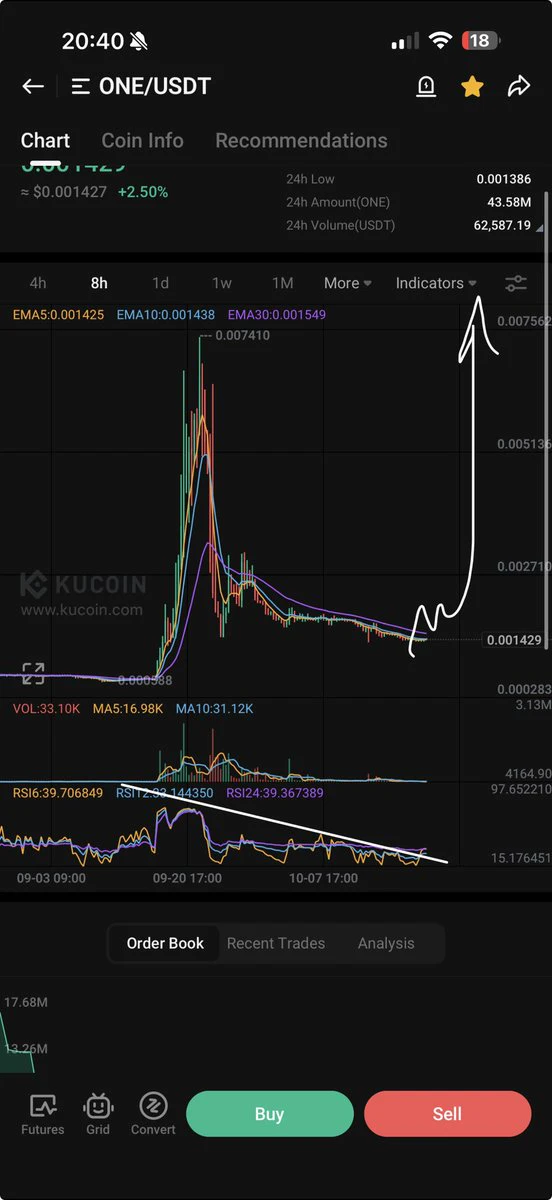
$ONE ANYTIME NOW
post-image
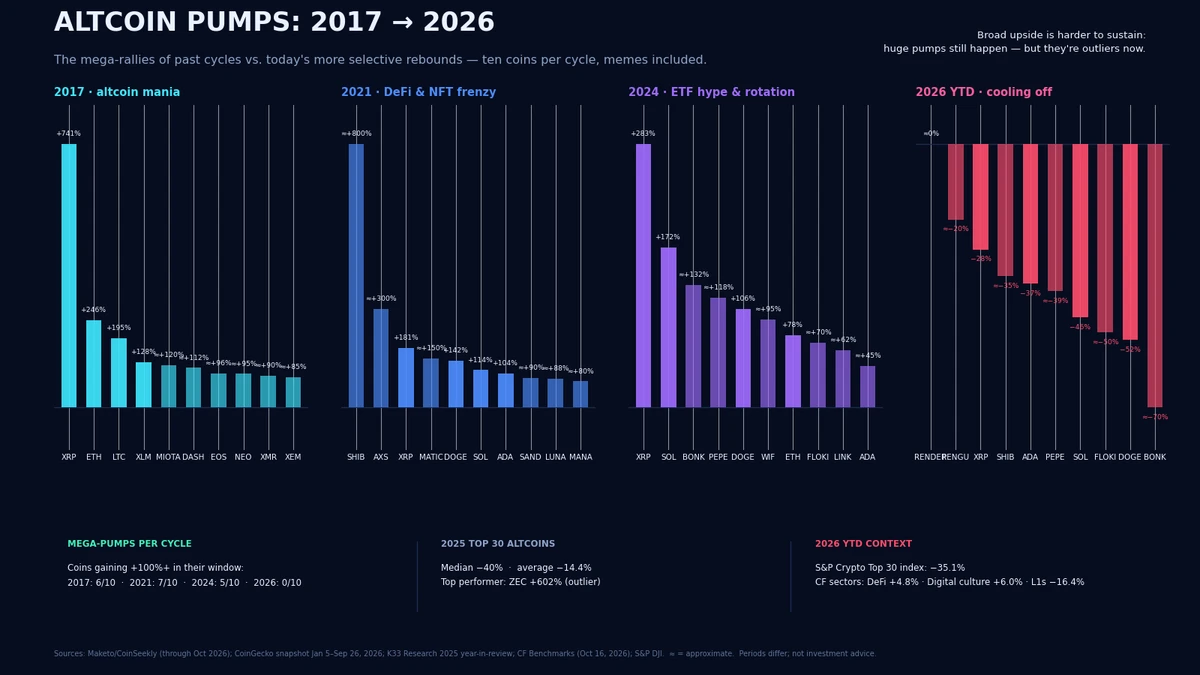
Every cycle, the timeline says "altseason is finally back"
Data says the definition has changed
2017 → 6 of 10 top coins more than doubled in a single month
2021 → $SHIB did +800% in October alone
2024 → Pumps turned selective
2026 YTD → Top-30 index is −35%
Now it's merely a race of who can find the outliers first. Not a deep and broadening market many expected and hoped for.
In 2017, crypto added 723 new tracked coins for the year, which is roughly 7-10× the number of operating-company IPOs in the US per any given year.
In 2026, alone launches around 25,000–35,000 tokens on a typical d
post-image
SHIB+2.14%
INDEX-1.44%
🚀 BTC/USDT Multi-Timeframe Technical Breakdown: Consolidation Before the Next Major Move?
Bitcoin ($BTC ) is currently trading at $82,467.5, up +0.65% on the day. After pulling back from recent local highs, price action across the 1-Hour, 4-Hour, and Daily charts suggests BTC is consolidating within a crucial zone.
Below is an in-depth analysis of key technical indicators, support/resistance levels, and tactical trading strategies.
📊 Market Overview (24h Statistics)
Current Price: $82,467.5
JPG
24h High: $83,435.2
24h Low: $81,199.9
24h Volume (BTC): 9.12K BTC
24h Turnover (USDT
CryptoSquad
🚀 BTC Technical Deep Dive: Consolidating Near $82,000 — Bullish Continuation or Key Retest?
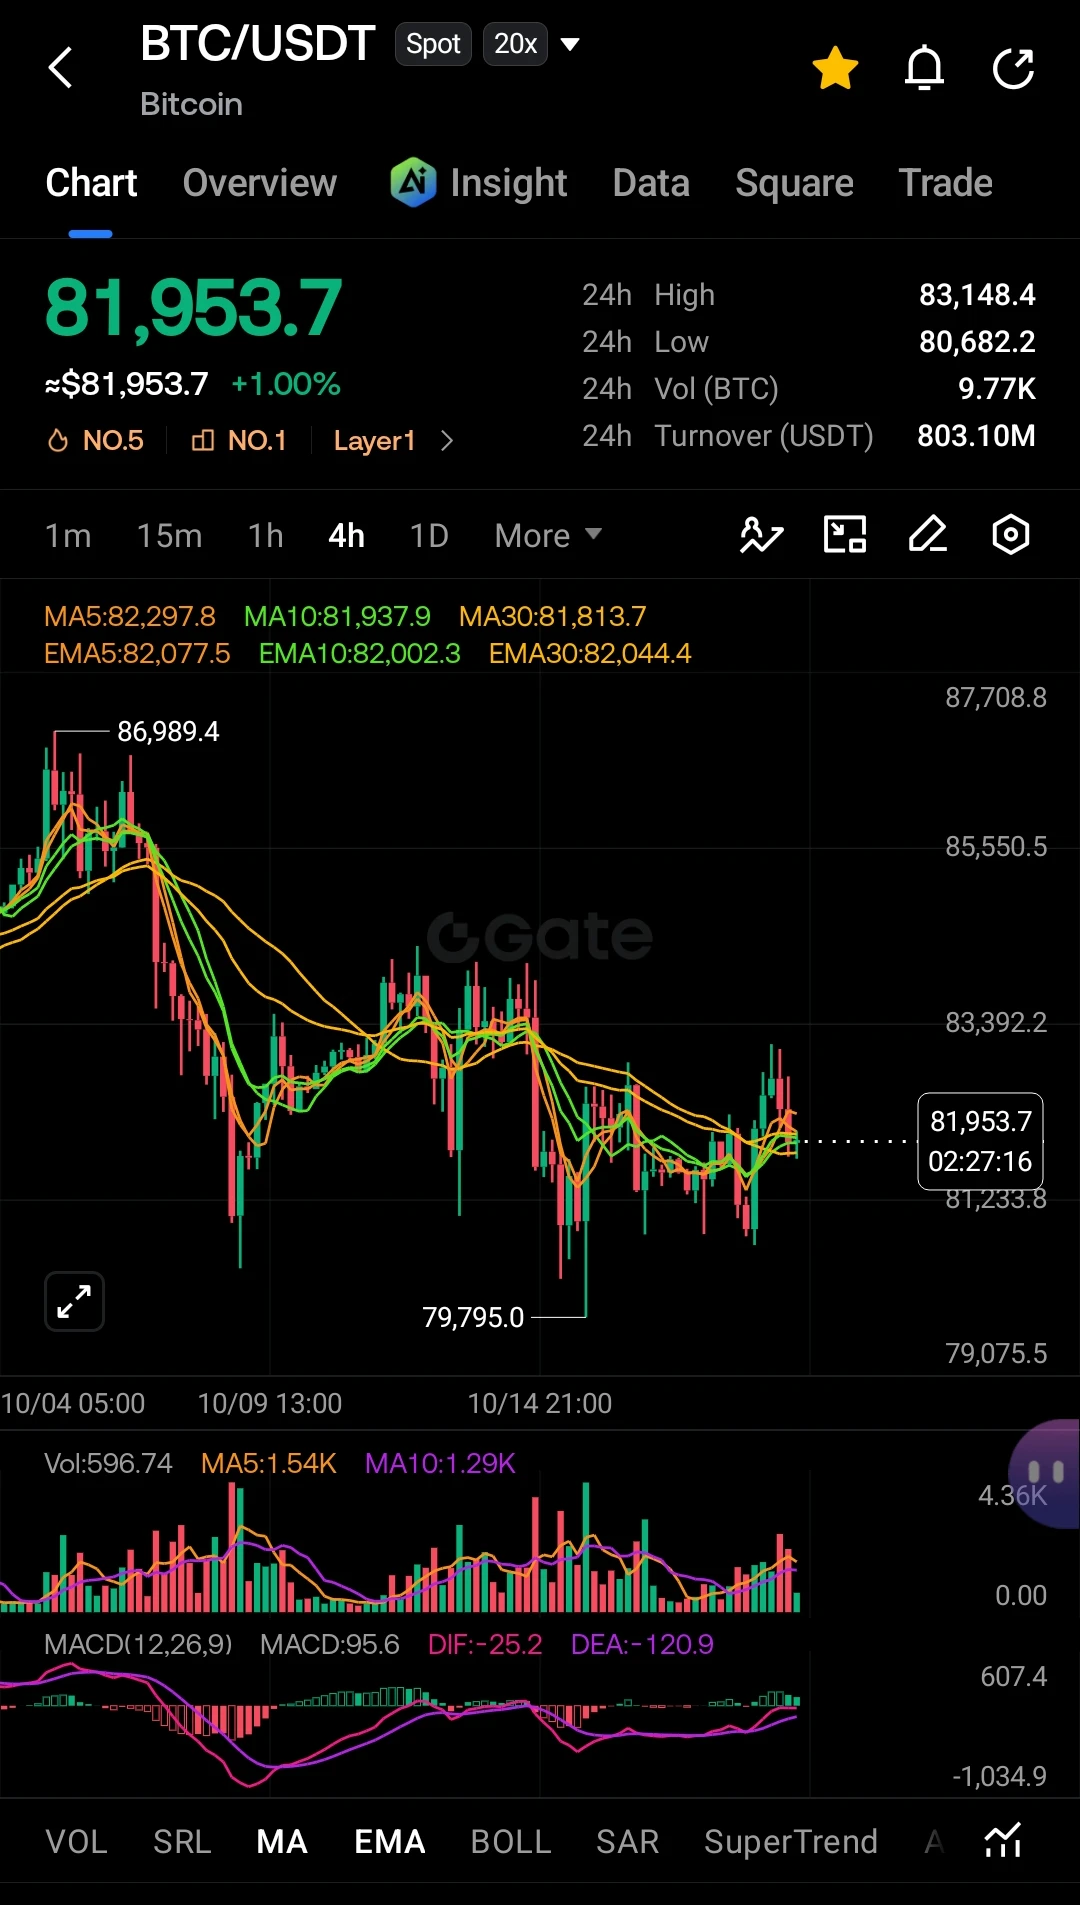
Bitcoin ($BTC ) is hovering right around the $81,900 – $82,000 mark, maintaining a steady posture after rebounding strongly from its recent local swing low.
Let's break down the technical outlook across multiple timeframes to map out potential trade setups and crucial levels to watch.
📊 Multi-Timeframe Technical Breakdown
1️⃣ 1-Hour Timeframe (Short-Term Momentum)
Price Range: Floating near $81,964.
Support & Resistance:
Immediate support held firmly at $79,795, where aggressive buyers stepped in.
Local resistance sits near $83,148 (24h High) and $84,142.
Moving Averages: MA5 ($82,060) and MA10 ($82,324) are flattening out alongside EMA lines, indicating a temporary period of equilibrium and consolidation.
MACD: The histogram shows mild bearish momentum fading, preparing for a potential crossover above the zero line.
2️⃣ 4-Hour Timeframe (Mid-Term Trend)
Price Action: Following a pullback from $86,989 down to $79,795, price action is forming a higher low base.
Structure: MA30 ($81,813) is acting as dynamic support, providing a floor for the current recovery phase.
Key Indicators: MACD line (DIF: -25.2, DEA: -120.9) is curling upward, suggesting selling pressure is drying up on intermediate timeframes.
3️⃣ Daily Timeframe (Macro Picture)
Macro Trend: The broader daily chart remains structural and strong, moving upwards from $62,538 up toward the peak near $87,401.
Moving Averages: MA5 ($81,873) and MA10 ($82,281) remain cluster-packed around current spot prices, while the longer-term MA30 ($83,637) serves as the primary hurdle for macro bulls to reclaim.
Volume Profile: Daily volume has normalized, pointing toward market accumulation rather than distribution.
🎯 Key Levels to Watch
Metric / Level Price Point Significance
Immediate Resistance
$83,150 – $84,150
Breakout zone for continuation toward $87,000+.
Current Pivot Zone
$81,900 – $82,000
Equilibrium point across MA5/EMA5 indicators.
Key Support Zone
$79,795 – $80,680
Crucial demand zone to maintain bullish market structure.
💡 Trading Strategy & Outlook
Bullish Scenario: A clean hourly close above $83,150 on rising volume could spark a rally back toward $85,500 and potentially retest the $87,400 highs.
Bearish / Defensive Scenario: If $81,800 fails to hold, expect a sweep of liquidity down toward $80,600, with major invalidation below the key low of $79,795.
Trading Insight: High volatility often follows tight consolidation around key moving averages. Keep tight risk management controls and monitor volume spikes for direction confirmation! 📉📈
👇 What’s your take on BTC’s next move? Are we breaking $85,000 this week, or testing sub-$80k support first? Share your thoughts below!
#Bitcoin #BTC #Gateio
#BitcoinTops$82K
$BTC ‌ ‌
repost-content-media
BTC+0.72%
  • 3
October 20 Tuesday Daily Summary
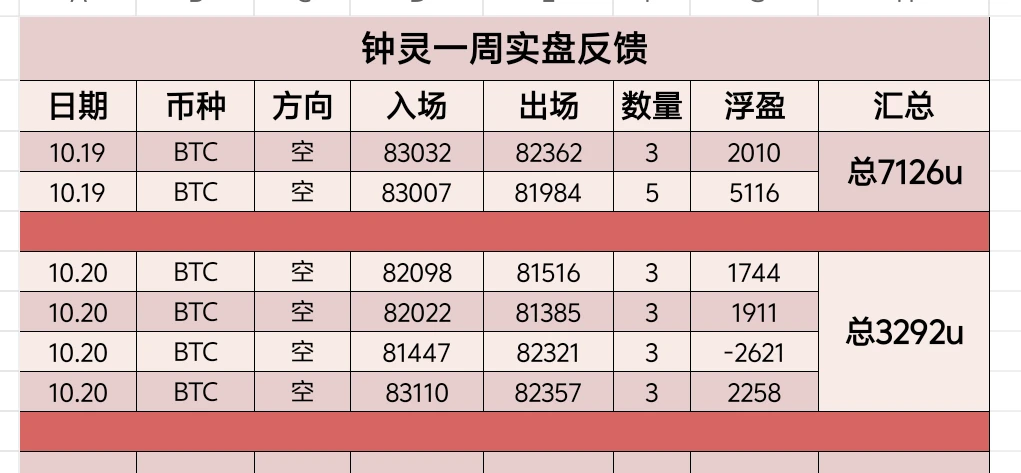
Since BTC rebounded from 79,700 on the 1-hour chart, it reached a high near 83,400 today. Strong resistance for BTC is at 83,800. Today, amid easing US-Iran tensions, it initially rallied, then fell after the reports were debunked. It is currently consolidating at 82,700. Four trades were placed intraday: one by Zhǐsǔn and three by Zhǐyíng.
BTC short | Entry 82098 | Exit 81516 | Profit 1744
BTC short | Entry 82022 | Exit 81385 | Profit 1911
BTC short | Entry 81447 | Exit 82321 | Small loss -2621
BTC short | Entry 83110 | Exit 82357 | Profit 2258
⭕Total taken to
post-image
BTC+0.67%
ETH+1.45%
bitcoin:native up and UCL - perfect match
BTC+0.72%
UP-6.71%
MATCH-0.31%
🔹U.S. AI Stocks Stage a Strong Comeback! APLD and WDC both surge over 6. Are memory and computing p
live-cover
LIVE1,229
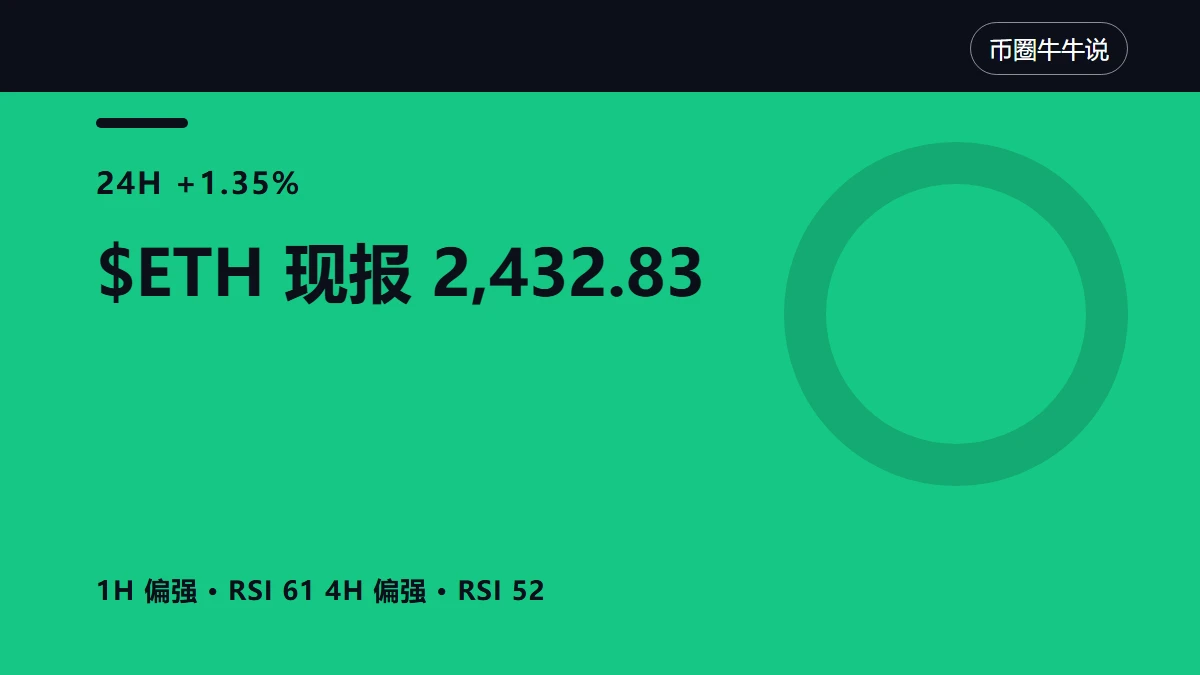
What matters this time for $ETH isn't simply whether it will “rise” or “fall,” but which of the two nearby boundaries is actually tested first now that the price has reached 2,432.83. Rather than picking a bullish or bearish side, first check whether price and volume are moving in sync. Price shows direction; trading volume shows participation. When the price has moved but volume is clearly below average, the follow-through on either a breakout or a decline should be viewed with caution.
One verifiable update: Gate's official announcement reads, “Gate Research: Corporate Earnings Support U.S.
post-image
ETH+1.51%
✍️ Gate Square is recruiting creators! Join the Square and share in monthly creator rewards worth $100,000+!
High-quality creators and active traders can apply for verification to unlock rewards and traffic support!
📌 How to Participate
Existing platform creators: Apply for the “Creator Verification Badge” to participate
New creators: Fill out the application form 👉 https://www.gate.com/questionnaire/7698
🎁 Creator Benefits
1️⃣ New creators can earn up to 30 USDT for their first post
2️⃣ Publish 5 original posts each week to share a 10,000 USDT prize pool
3️⃣ Publish at least 8 posts per mo
GateSquare
✍️ Gate Square is recruiting creators! Join the Square and share in monthly creator rewards worth $100,000+!
High-quality creators and active traders can apply for verification to unlock rewards and traffic support!
📌 How to Participate
Existing platform creators: Apply for the “Creator Verification Badge” to participate
New creators: Fill out the application form 👉 https://www.gate.com/questionnaire/7698
🎁 Creator Benefits
1️⃣ New creators can earn up to 30 USDT for their first post
2️⃣ Publish 5 original posts each week to share a 10,000 USDT prize pool
3️⃣ Publish at least 8 posts per month to participate in a prize pool worth 100,000+ USDT; top creators can earn up to 600 USDT
4️⃣ Plus token rewards, Gate merchandise, traffic support, and other great perks
Event details 👉 https://www.gate.com/announcements/article/100944
repost-content-media
$FLOKI bottom is in.
ETH and ETH memes will explode this cycle.
A new ATH for $FLOKI in the next 12 months.
30x potential.
post-image
FLOKI+4.19%
ETH+1.51%
$ETH It’s really testing our patience, ranging narrowly on the 15-minute chart. It’s still holding its hourly trend for now, but watching it churn sideways is downright putting us to sleep. It just needs a little catalyst to truly pick a direction. Take profit: 2,484.18 Stop loss: 2,399.35 Trending coins: $BTC : Current price 82,507.2 - 24-hour change: +0.82% $JCT : Current price 0.004664 - 24-hour change: +137.96%
post-image
ETH+1.51%
BTC+0.72%
JCT+133.77%
NEW: From Tesla’s shareholder letter -
“Readied V3 Optimus for mass-production”
TSLA+1.55%
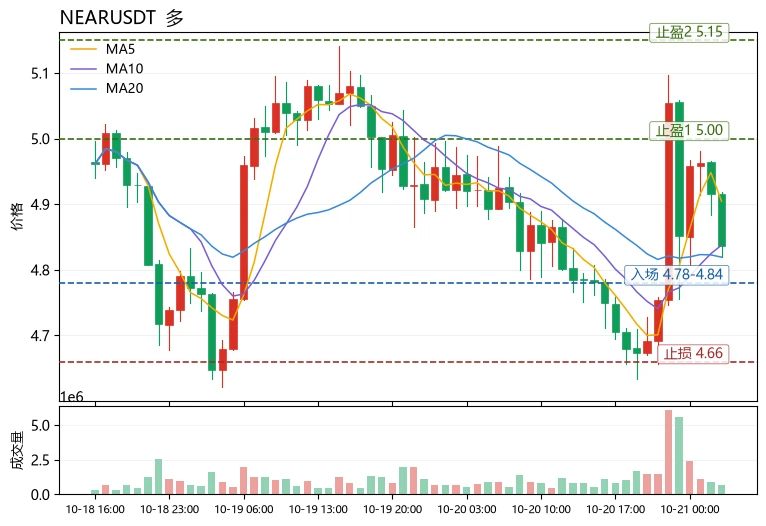
$NEAR Current price 4.835, down 2.13% over 24h, with a trading volume of 168.9M USDT; MA5=4.9046 is above MA20=4.8194, and the MACD histogram at +0.01979 remains bullish, but RSI is only 48.5 and the price is close to the Bollinger midline. The 30-candle range is 9.57%, the funding rate of +0.0100% indicates longs are slightly crowded, and the Fear & Greed Index at 55 is in the greed zone. Assessment: The medium-term structure remains intact, but short-term momentum is insufficient. This is high-level consolidation rather than trend acceleration, so position size should be reduced to half the
post-image
NEAR-2.03%
IOST+30.88%
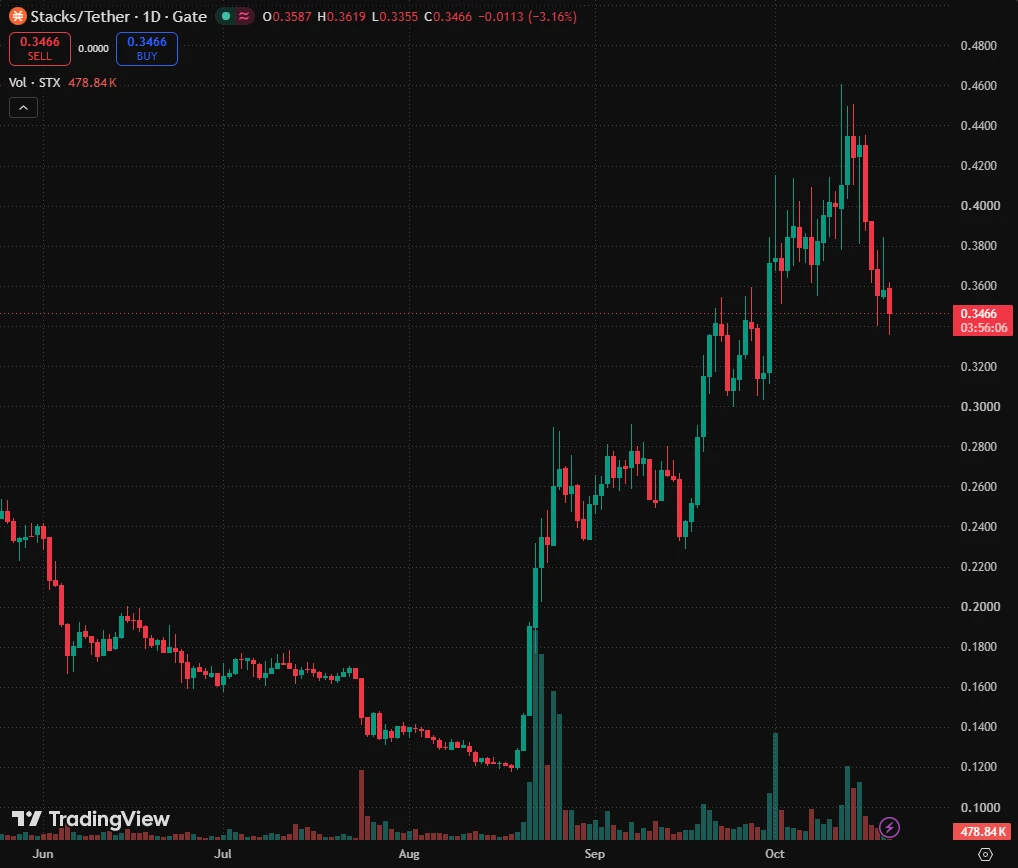
$STX STX/USDT: +112% Macro Expansion Setup
Stacks (
STX
) is exhibiting strong macro accumulation characteristics as price action builds a solid rounding base above the **$0.300 – $0.330** key demand block. Following prolonged seller volume exhaustion and dynamic trendline support holding firm on lower timeframes, market structure favors a high-conviction breakout expansion. A confirmed H4 close above the primary resistance pivot clears immediate overhead supply, unlocking multi-target upside toward major structural resistance nodes.
A sustained H4 close above the $0.380 resistance line valida
post-image
STX-4.84%
We’ve been shorting with the trend and turning a profit for more than ten days straight. But in today’s market, it broke out to the upside. Nothing we can do—no excuses, just take the hit
post-image
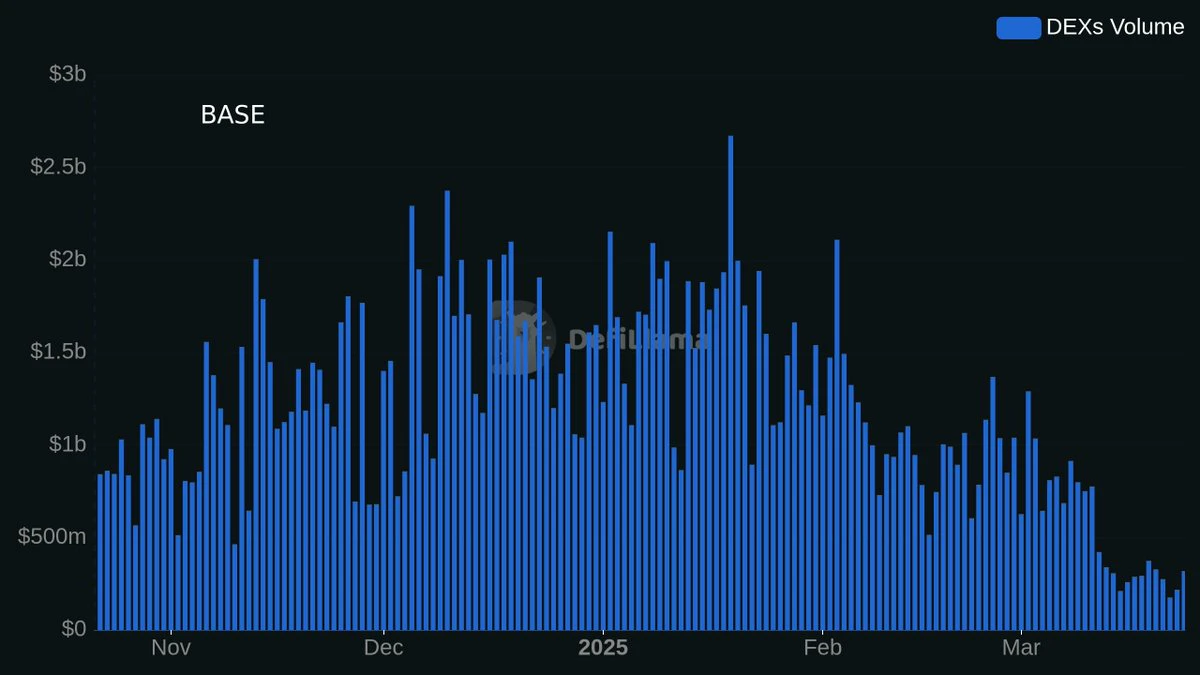
Robinhood DEX volume exceeded Base at its peak, when Virtuals hit $5B, yet the upside was nowhere near the same.
It’s as if RH had higher taxes + someone was constantly minting tokens + devs got better at extracting + and degens believed Vlad's lies on his Arbitrum Orbit chain?
post-image
ARB-2.21%
In a way, Pump may be too much like a casino. Does that count as bullish for $PUMP ?
PUMP-2.11%
Everyone, $IOST worked perfectly as I predicted...‼️... The first take-profit target (TP) has been successfully hit... Now, move the stop-loss (SL) to the entry price and take partial profits to lock in gains...‼️
post-image
IOST+30.88%
nothing like the great outdoors
post-image
Load More

Join 40 M users in our growing community

⚡️ Join 40 M users in the crypto craze discussion

💬 Engage with your favorite top creators

👍 See what interests you

Trending Topics

GateRanks2ndIn30DayNetInflows

5.23k Views765 Discussing

According to DefiLlama, Gate recorded over $199 million in net inflow over the past 30 days, ranking second among global centralized exchanges. Capital keeps flowing in — what's your strategy? [👉 Read more](https://www.odaily.news/en/newsflash/525820)

GateIdleFundsSurpass$300M

7.09k Views1.46k Discussing

TeslaQ3EarningsPreview

3.01k Views207 Discussing

View More