Square
Following
Hot
News
Notifications
Profile
Share your thoughts
placeholder
Article
Crypto vs. Pokémon Cards
In their favor: if the cards go to zero, at least you’re left with a nice piece of cardboard.
Jokes aside, they’re very similar markets: if you understand one well, you practically understand the other.
Have a good Sunday 🤝
post-image
Layout: Bitcoin, Ethereum, Dogecoin
live-cover
LIVE880
  • 1
Trenches
ZIG
Z
bade
b
ZIG
0x8c...1145
Market Cap
$.
Change
.
24h Vol
$.
Holders
.
BTC
B
bade
b
BTC
C5xp...pump
Market Cap
$.
Change
.
24h Vol
$.
Holders
.
STONK
S
bade
b
STONK
6GmA...UNgx
Market Cap
$.
Change
.
24h Vol
$.
Holders
.
MAGGIE
M
bade
b
MAGGIE
8rHo...PmZV
Market Cap
$.
Change
.
24h Vol
$.
Holders
.
ANSEM
A
bade
b
ANSEM
9cRC...pump
Market Cap
$.
Change
.
24h Vol
$.
Holders
.
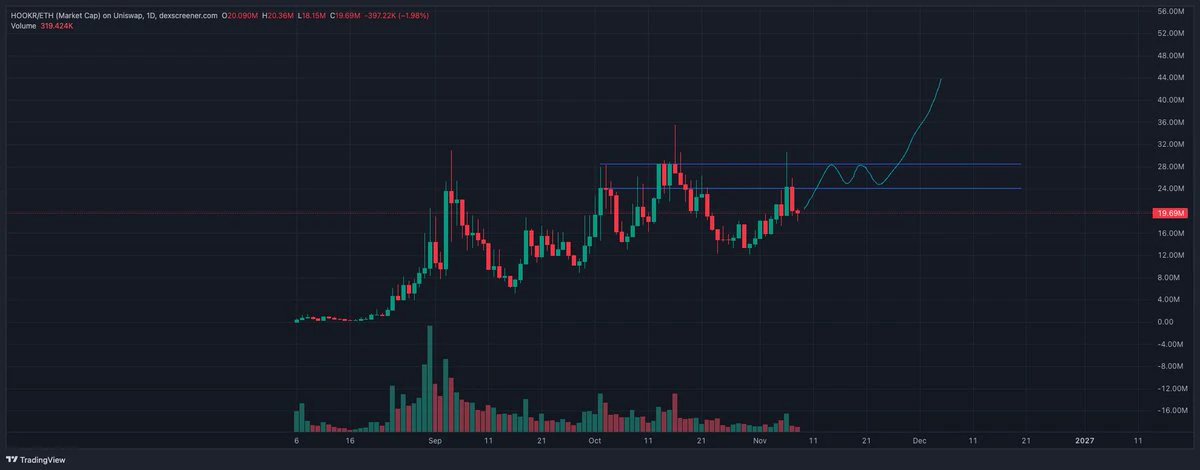
robinhood:0x18e674231a58c239dc7daedcffe15ec3a24cff5c one of the best looking charts on RH eco atm.
post-image
HOOD+4.25%
RH-4.74%
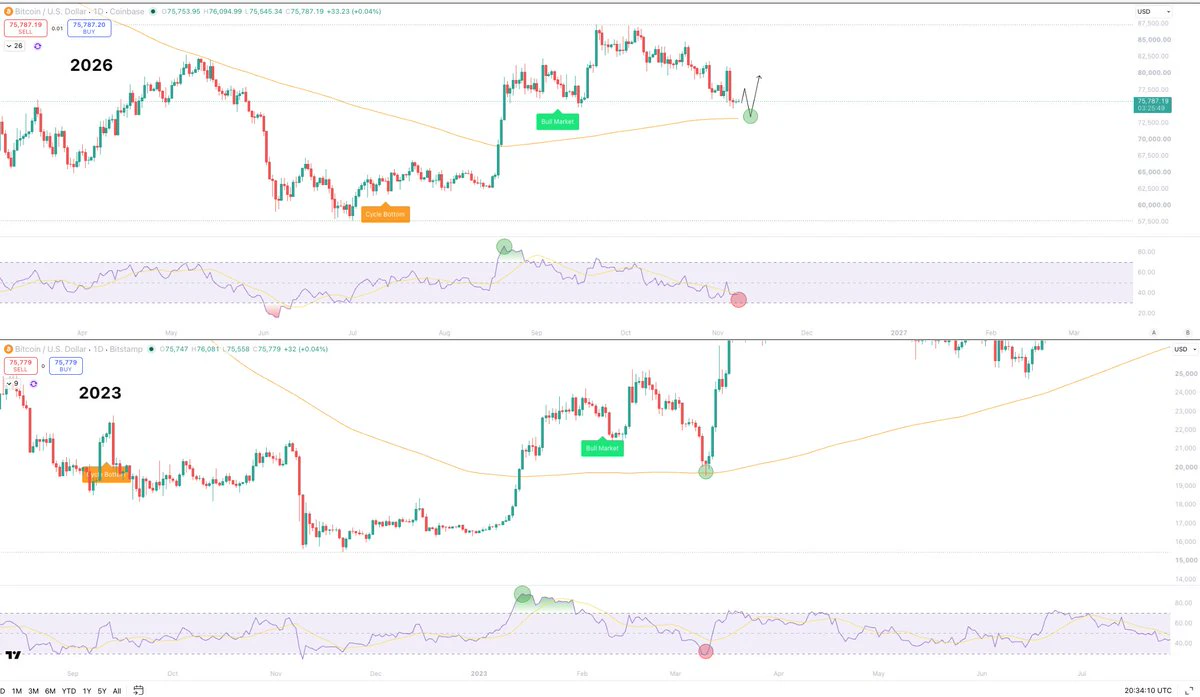
Big move for Bitcoin is loading.
The setup continues to mirror 2023 almost exactly.
In both scenarios we have:
- Cycle bottom signal
- Reclaim 200D SMA
- 85+ on the 1D RSI
- Bull market signal confirm
- Corrective PA leading down to the 200D SMA
- Near oversold levels on 1D RSI
A big move is brewing one war or the other.
Respect the 200D SMA, as well as the other levels its testing right now, and we get our next impulse higher.
Lose the 200D SMA and we will fall quickly.
200D SMA is the level I would not want to see us lose.
Until then though, this is a very high R/R setup, where Bitcoin is p
post-image
BTC-0.67%
$HOT This lesson cost me a real loss of 8,000 U, and now the market has taught me another one. Last year I got trapped chasing the top, and my account shrank from 23,000 to 15,000. Watching the candlesticks drop one after another was a feeling I really don’t want to experience again.
Today $HOT is trading at 0.0004, up 21.97% in 24 hours, with a high of 0.0005, a low of 0.0003, and a trading volume of 102.9 million. These numbers are interesting—the trading volume is over 100 million, but the price is still hovering around 0.0004. What does that tell us? There’s been plenty of turnover, with
Just got another subscriber.
It's cook o'clock 😋🤞
post-image
Which memecoin is about to do this
post-image
MEME-0.94%
MEMECOIN+8.70%
BREAKING
Nvidia board opens probe after Jensen Huang admits affair with suspected Chinese spy
Nvidia’s board is launching an investigation into whether CEO Jensen Huang was targeted by a foreign espionage plot, after he admitted to employees that he was unfaithful to his wife.
Source bloomberg
post-image
NVDA+2.80%
The game isn't over, never give up!
post-image
Dim777 & BTC & DIM777 & LTC & DIM777 & GT
ALPHA in ALPHA on ALPHA
BTC-0.31%
LTC-0.07%
GT-2.41%
market update
live-cover
LIVE69
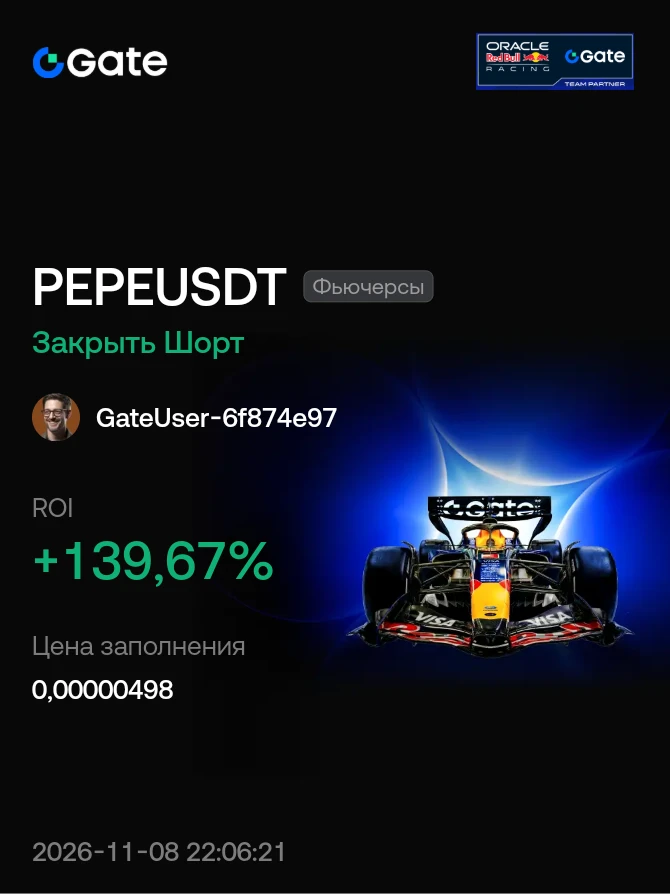
My result in the trading challenge! 🚀 Closed a short on PEPEUSDT with a profit of +139.67%. Great trade on Gate.io! 🔥
Join the event and share your results! Good luck to all participants!
#GateSquareTradingChallenge
post-image
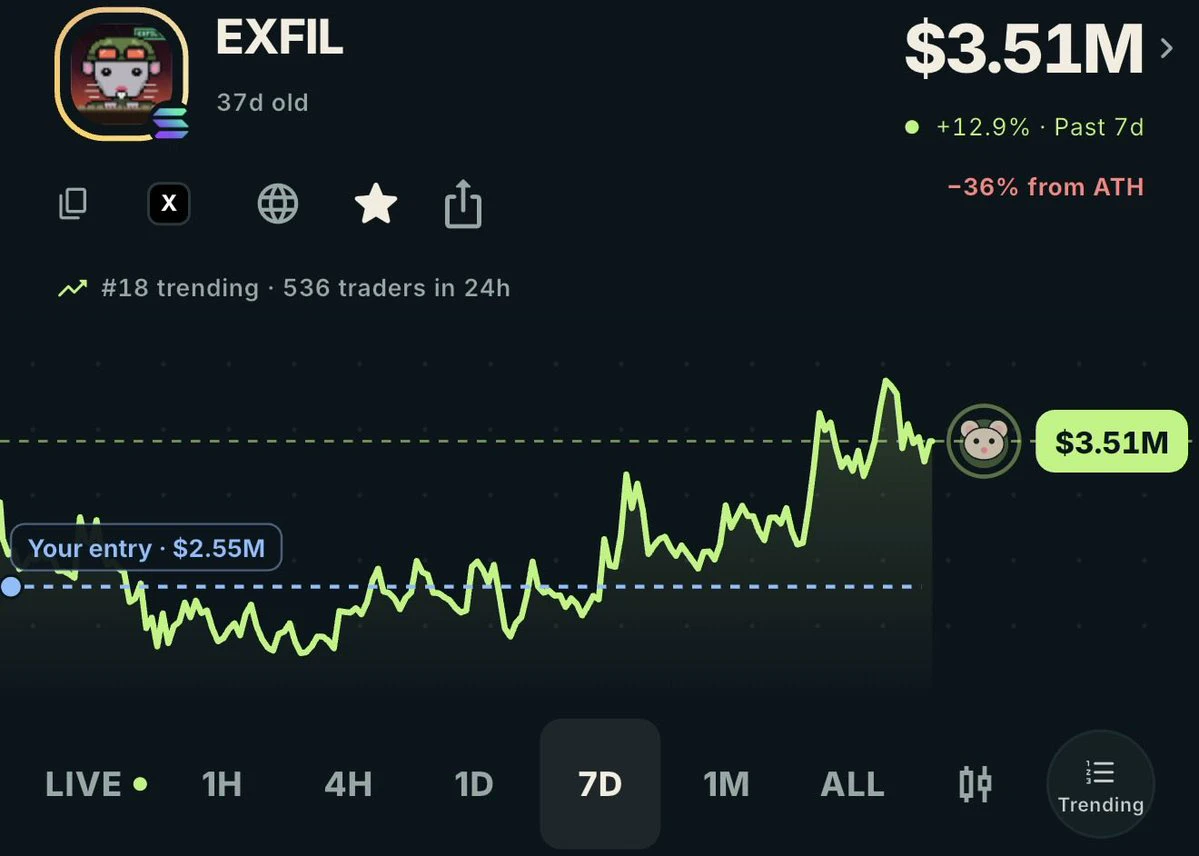
Adding $EXFIL on any dips, I found the best place is using the app 👇
10% off fees using-> $EXFIL.
Didn’t use it much at first but these last few days been using it more and more, also able to buy @Enter_Elysium tokens there but you’ll need the desktop version.
Fire over $USDC or $SOL in seconds from sol chain and buy whatever you want, great notifs like tells you if top holders are selling etc etc very nice imo.
post-image
FIRE-1.16%
USDC+0.01%
SOL-0.77%
Live at the biggest comedy show in Lagos with my bro @mcabilitea
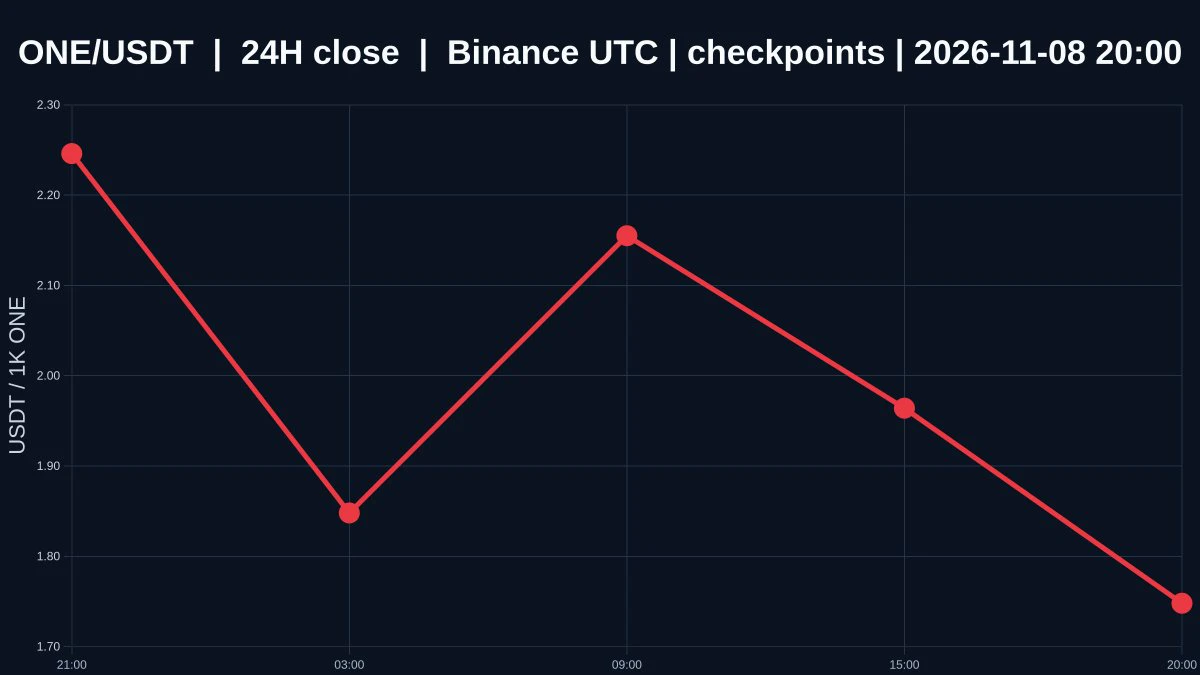
What’s easiest to misread when $ONE’s two time frames haven’t aligned yet?

$ONE is currently priced at 0.001748, down 26.77% over 24 hours, with an intraday high of 0.00243 and a low of 0.001692. The 1-hour trend is weak, while the 4-hour trend is strong. The volume ratio is 0.10325723931514065. The two time frames point in opposite directions, so the trend has yet to be confirmed.

At 0.001748, the price is only 0.000056 above the 1-hour support at 0.001692, but 0.000682 below resistance at 0.00243. This puts it clearly closer to support. Whether support at 0.001692 holds depends on whether
post-image
XRP Technical Outlook: Ripple Breaks Below Key Support as Bearish Momentum Builds

XRP is facing renewed selling pressure on the daily chart, with price trading near $1.15 after losing several short-term support levels. The broader structure remains bearish, as XRP continues to trade below all four major exponential moving averages.

The latest breakdown raises the risk of another move toward the $1.00 psychological support zone. However, RSI is approaching oversold territory, so a short-term relief bounce remains possible if buyers defend the current area.

1. EMA Structure: Sellers Remain in
XRP-1.12%
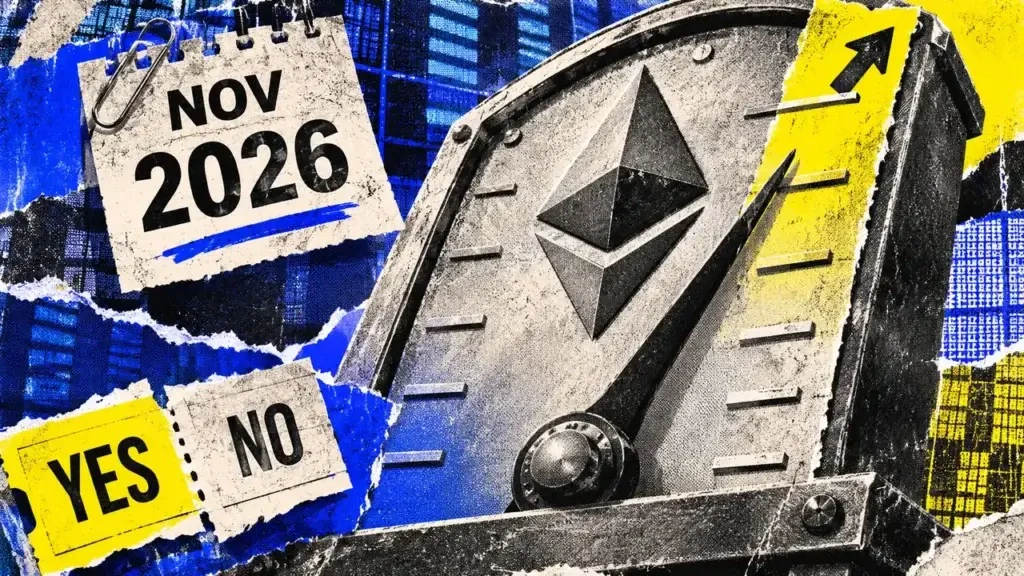
📉 NEW PREDICTION MARKET: Will Ethereum dip below $2,200 in November?
The below-$2,200 outcome led at 86.5% in the Nov. 8 snapshot. A later rebound could also satisfy separate upside contracts.
post-image
ETH-1.26%
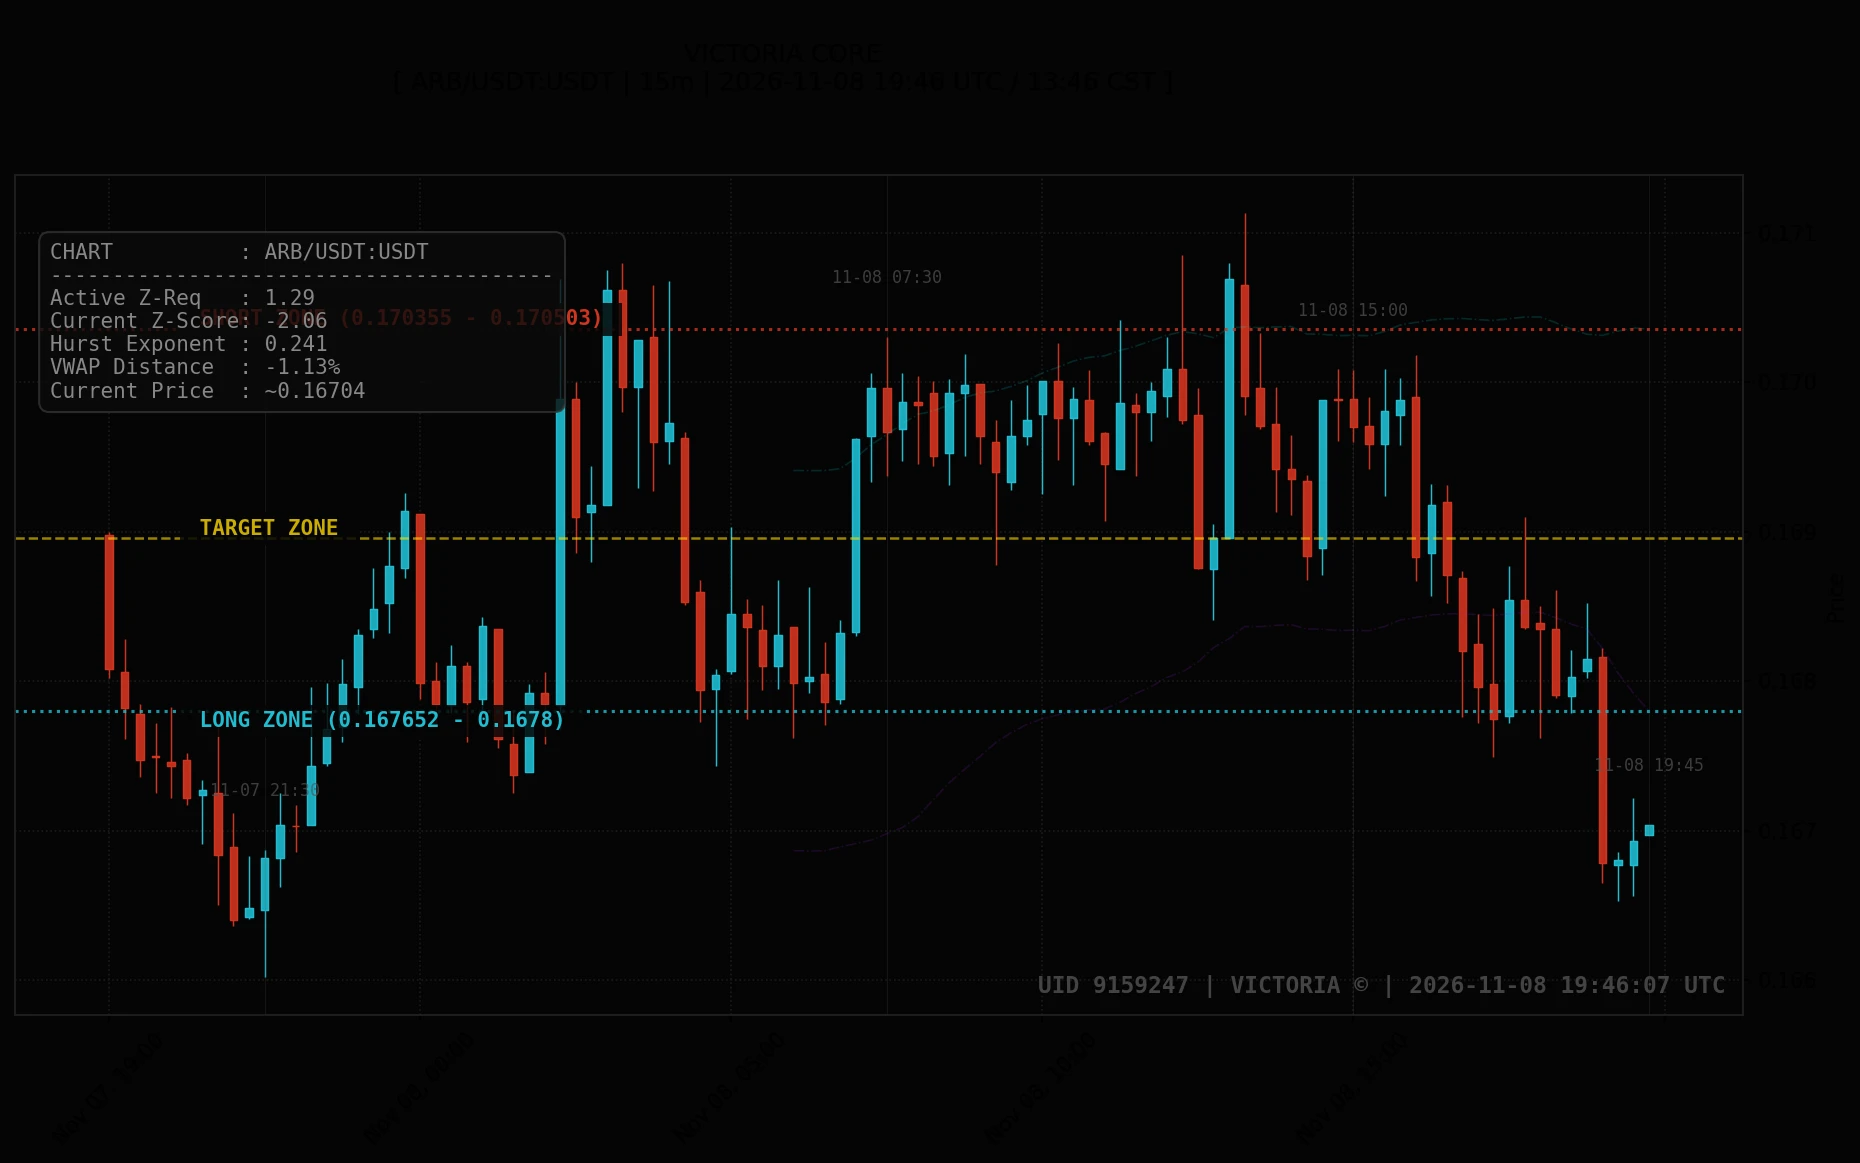
2026-11-08 19:46 UTC. ARB/USDT trades at ~0.16704 USDT in an extended discount structure, offering mean-reversion buyers an attractive risk-to-reward window if support at 0.16653 holds firmly. For safe execution, wait for price confirmation at LONG ZONE (0.167652 - 0.1678 USDT) targeting TARGET ZONE (~0.168955 USDT), while guarding against unexpected volatility with SHORT ZONE (0.170355 - 0.170503 USDT).

In secondary tracking, XRP/USDT at ~1.1544 USDT sits lower mid-range between LONG ZONE (1.15188 - 1.15267 USDT), SHORT ZONE (1.16618 - 1.16696 USDT), and TARGET ZONE (~1.15982 USDT). Finally
post-image
ARB+1.17%
XRP-1.15%
BTC-0.67%
$PIEVERSE ‌ has flipped the momentum, and buyers are making their presence felt.

After bottoming near $0.9465, the price has staged a strong recovery and reclaimed $1.40. Trading around $1.4776, it remains above the bullish daily Supertrend at $1.1199.

Levels I'm watching:

Support: $1.40 to $1.37
Major support: $1.12
Immediate resistance: $1.5257
Next targets: $1.57 and $1.70

A daily close above $1.5257 could set up another leg higher. For now, holding above $1.37 is important to keep this recovery intact.

The structure has improved considerably. Now the breakout needs confirmation.

$S
PIEVERSE+0.58%
SPCX+8.74%
Load More

Join 40 M users in our growing community

⚡️ Join 40 M users in the crypto craze discussion

💬 Engage with your favorite top creators

👍 See what interests you

Trending Topics

USCPIDataIncoming

15.83k Views1.66k Discussing

The U.S. October CPI report will be released on November 10 at 8:30 a.m. ET. September CPI came in at 3.7% year over year, and markets will be watching closely for signs that inflation is cooling, especially in core CPI. A softer-than-expected reading could strengthen rate-cut expectations, while hotter inflation may pressure risk assets through higher Treasury yields and a stronger dollar. How do you think this CPI print will move $BTC, U.S. stocks and gold?

USAIStocksHitHard

29.43k Views3.74k Discussing

USNonfarmPayrolls

57.15k Views4.5k Discussing

View More