Square
Following
Hot
News
Profile
Share your thoughts
placeholder
Article
10.16 Bitcoin price action analysis
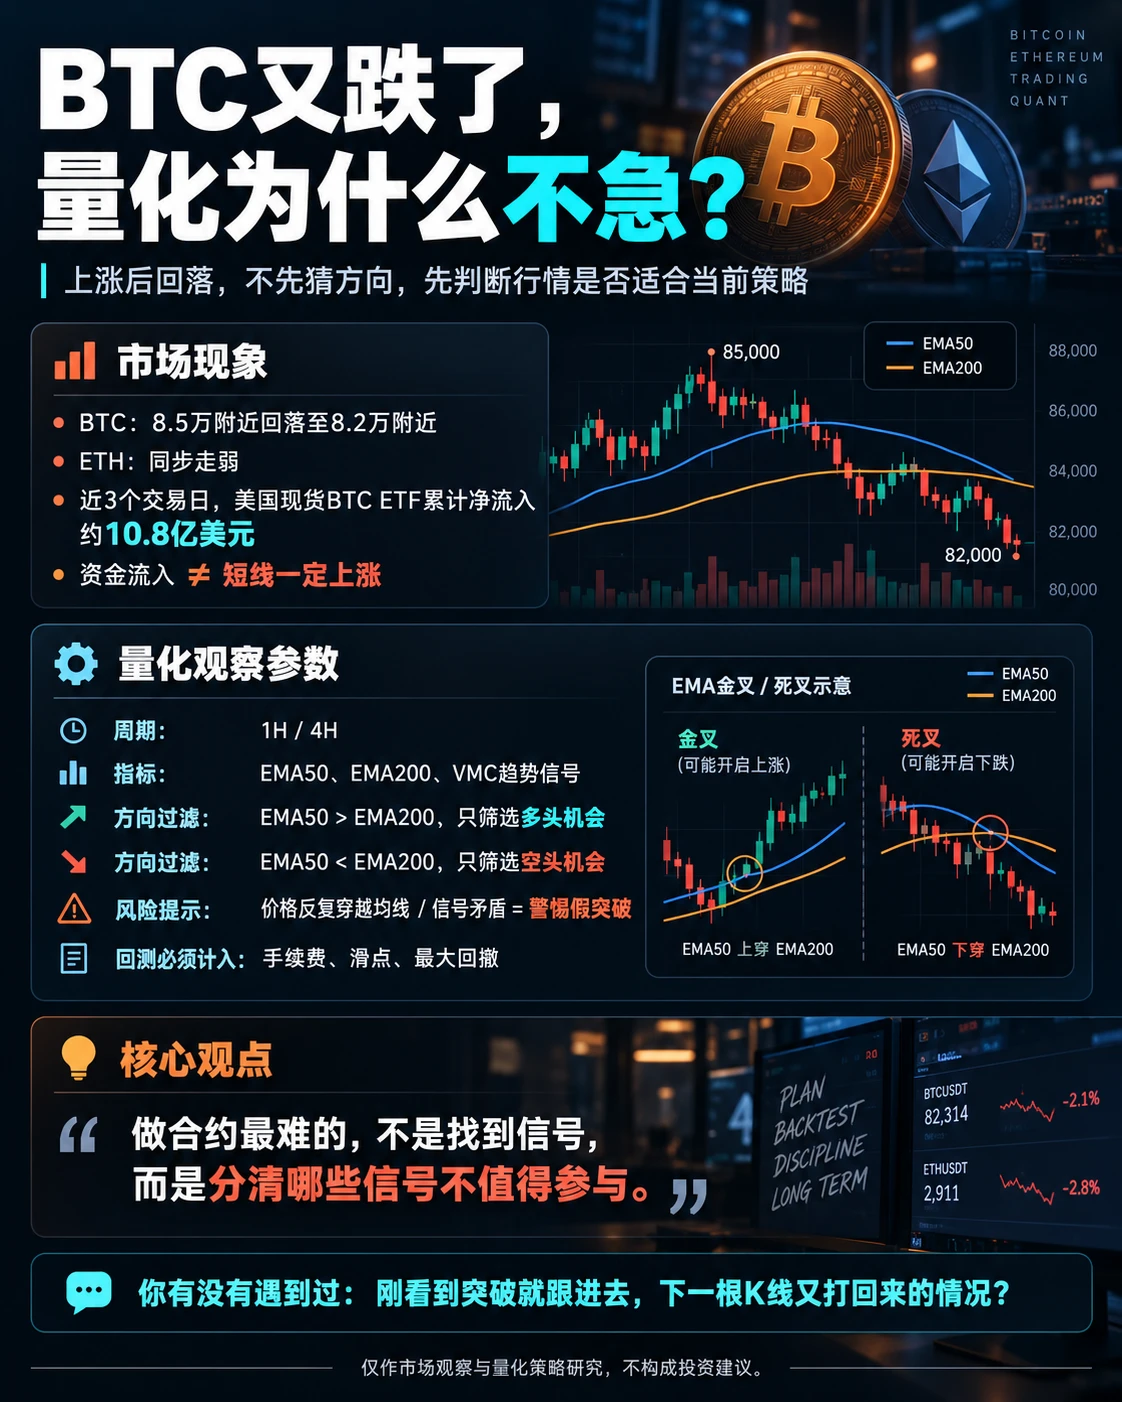
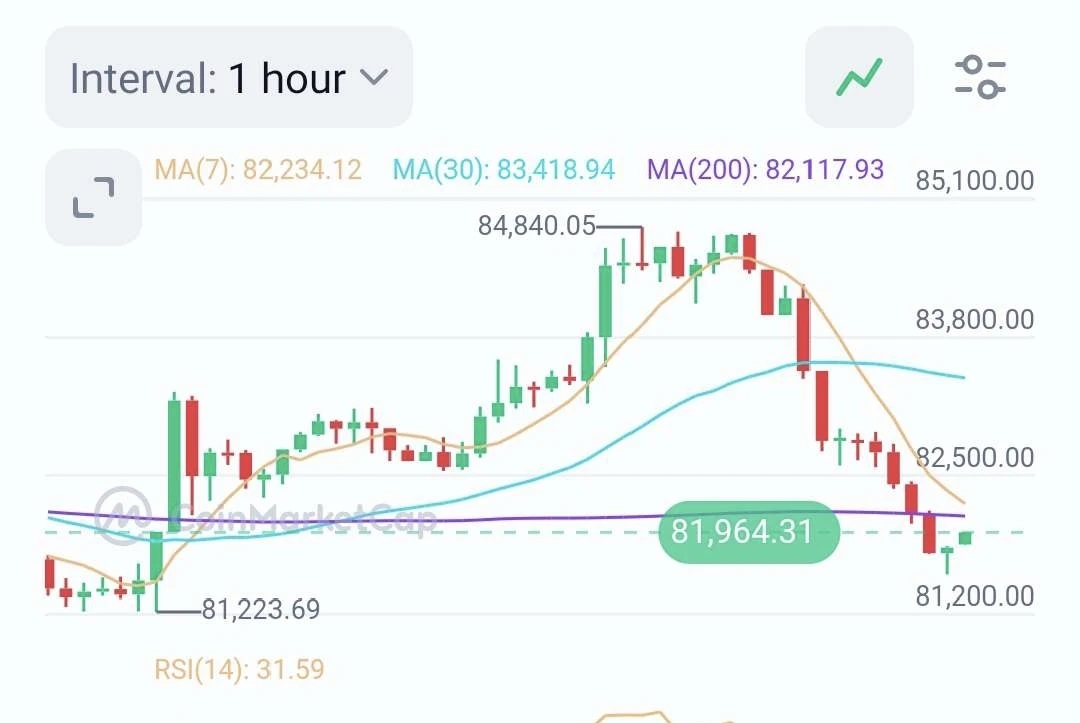
The market opened a strong rebound from the low of 79732.3, with the rally reaching a high of 82639.2 before losing momentum. The price then entered a range-bound consolidation phase. The Bollinger Bands gradually flattened, with the upper and lower bands narrowing as the market repeatedly oscillated within the channel. In terms of indicators, long and short forces have tended toward equilibrium, with no clear one-sided direction. This is a high-level range-bound consolidation pattern following a sharp rally. 82639 is the key resistance level, while support
post-image
BTC+1.15%
$SOL The Water Thunder Tun hexagram, Kan above and Zhen below. Thunder rumbles beneath the water, trying to surface but unable to break through; with Tun, the biggest taboo is pulling hard as soon as it sprouts—waiting until it grows taller before cutting is steadier.
The daily moving averages are still overhead: EMA20 around 110.8 and EMA50 around 107.1. Yesterday's low was 100.5 and high was 106.5; the current price is around 105.4. Each rebound is lower than the last, so the structure remains bearish.
Plan: Scale into shorts from 106.8 to 110.5, with a stop-loss at 113.5—don't hold if it br
post-image
SOL+2.96%
KOL take: Ansem remains firmly bullish on BTC! Crypto market confidence has fallen to a ten-year low
live-cover
LIVE2,019
#美国9月PPI大超预期 Data beat expectations across the board, yet the market "isn't following the script": PPI came in at 6.3%, with BTC hanging by a thread at $80K—will this be "the end of bad news" or "stagflation panic"?

Actual data: U.S. September PPI rose 6.3% year-over-year (forecast 5.3%) and 1.3% month-over-month (forecast 0.5%)—the highest in more than four years; core PPI rose 5.0% year-over-year, while retail sales rose 0.8%, also beating expectations. All four readings "blew out the charts." But interestingly, the more explosive the data, the more "divided" the market became—U.S. Treasur
post-image
BTC+1.10%
XAU+0.44%
NDAQ+1.57%
DOW+1.59%
#美国9月PPI大超预期 #美国9月CPI超预期 The Federal Reserve, Inflation, and Employment: How Ordinary People Can Understand U.S. Macroeconomic Indicators
Don’t confuse CPI, PCE, and PPI
CPI: Price changes on the consumer sideCPI, the Consumer Price Index, measures the average change in the prices of a basket of goods and services purchased by urban consumers, including food, housing, transportation, and medical care. Every household has a different consumption structure, so personal experiences and the index average may differ. The “core CPI” often mentioned in the news excludes food and energy. This does not
XAU+0.44%
Live market update
live-cover
LIVE2,387
🌍 ONEA Network|The future of payments is more than just “making payments”
When we talk about the future of digital payments, many people first think of:
Faster.
Cheaper.
More convenient.
But speed is only part of the story.
The question truly worth considering is:
What happens when payments become a way to connect people with one another, people with products, people with services, people with digital assets, and the global economy?
Today, payments are usually seen as the final step of a transaction.
Choose a product.
Place an order.
Enter the payment page.
Complete the payment.
The transacti
post-image
TOKEN+1.93%
Dahuang’s weekly rhythm—the previous summary played out perfectly. You can watch the replay
post-image
Genhao3
[Ended] End of the week wrap-up, live trading action on
10-16 00:38246 views
  • 1
  • 1
#美国9月PPI大超预期 #每周来晒
U.S. September PPI Surprises the Market — My Take on Inflation, the Fed, and Crypto |
Whenever important U.S. economic data comes out, I like to look beyond the headline and understand what it could mean for the market. This time, the September Producer Price Index (PPI) has caught my attention because the numbers came in much higher than expected.
According to the U.S. Bureau of Labor Statistics, producer prices increased 1.3% month over month in September, while the annual increase reached 6.3%. The monthly figure was the largest increase since March 2022. Energy prices
post-image
BTC+1.10%
ETH+2.43%
#美国9月PPI大超预期 #每周来晒 September PPI Surges to Four-Year High—Will the Fed Take Drastic Action in December?
Following Wednesday’s hotter-than-expected CPI, the PPI once again confirmed mounting inflationary pressure. U.S. PPI rose 6.3% year over year in September, far above the expected 5.3%, marking the largest increase since December 2022; it rose 1.3% month over month, also well above the expected 0.5%, marking the largest increase since March 2022. Core PPI, excluding food and energy, was also strong. It rose 5% year over year and 0.7% month over month, both above expectations.
Energy Drives P
GAS+3.50%
CME+1.39%
C+0.76%
  • 2
Most of those shaken out over the past two weeks didn’t misread the direction—their accounts disappeared first.
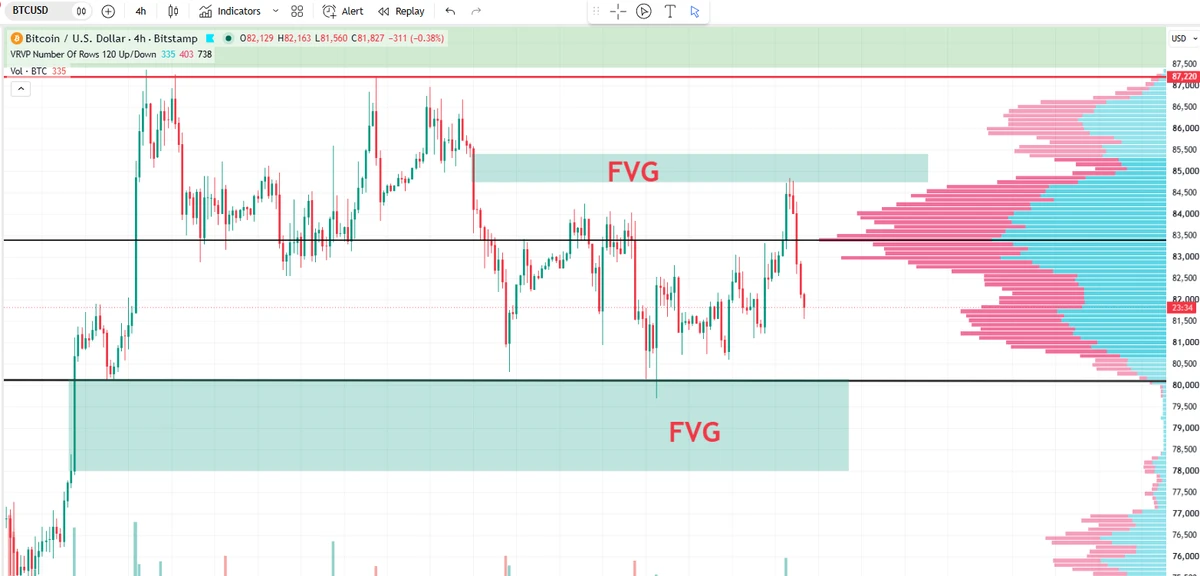
It hit a high of 87220 at the beginning of the month, then that wick plunged to 79800 early yesterday morning—in between, the Coin Cat on my list didn’t move for a day, only saying the drop could be ignored and the market was skittish.
I judge people by one thing: only those who talk about how much they lost before how much they made get onto my list.
I won’t guarantee the next new high for him; the position is right here for you to judge.
Do you think it will revisit 79800 first, or
post-image
BTC+1.15%
ETH+3.13%
I hope this plague doesn’t turn out like COVID last time. I’m getting vaccinated now—my body really can’t take it anymore.
post-image
$SNDK Hey, I stared at this chart for a while, and now I want to share a few heartfelt words with you guys.
Looking at the market, you can't just see that it's up 2.21% and start celebrating. Let's dig into the chart and see what clues we can find.
First, the market's overall “climate” is off.
Look at the scrolling news in the chart: “Trader Loracle's Nasdaq short position has turned profitable.” What's the implication? The broader environment is falling! The shorts on U.S. tech stocks are popping champagne and counting their money. As a stock token, no matter how strong SNDKG is, can it withs
post-image
SNDK-0.56%
  • 2
  • 1
#美国9月PPI大超预期
The overall market is in a state of inching upward today. Yesterday’s wick scared quite a few people into a cold sweat, with Bitcoin at one point crashing below $80,000. Thankfully, everyone managed to buy it back up, and it is now hovering around $82,000. It has risen, but it still feels somewhat shaky.
The macro hand is still gripping the market by the throat. CPI and PPI both came in above expectations in succession. Although the probability of a rate hike has fallen from 49%, the market is still on edge. $929 million in leveraged positions were liquidated, including $777 mill
post-image
BTC+1.10%
  • 7
All steady spot profits in crypto have never come from betting on market moves or relying on luck! True professional traders only trade high-confidence moves at key support and resistance levels! All price rises and falls, shakeouts, and breakouts revolve around key levels of market consensus! No empty talk today—we’re directly revealing precise BTC/ETH/SOL/BNB resistance and support levels, and teaching you step by step how to draw lines, identify trends and signals, and determine entries and exits. Put it straight into practice after reading!
📍 Spot Strategy · Practical Identification and L
BTC+1.10%
ETH+2.43%
SOL+3.00%
BNB+1.41%
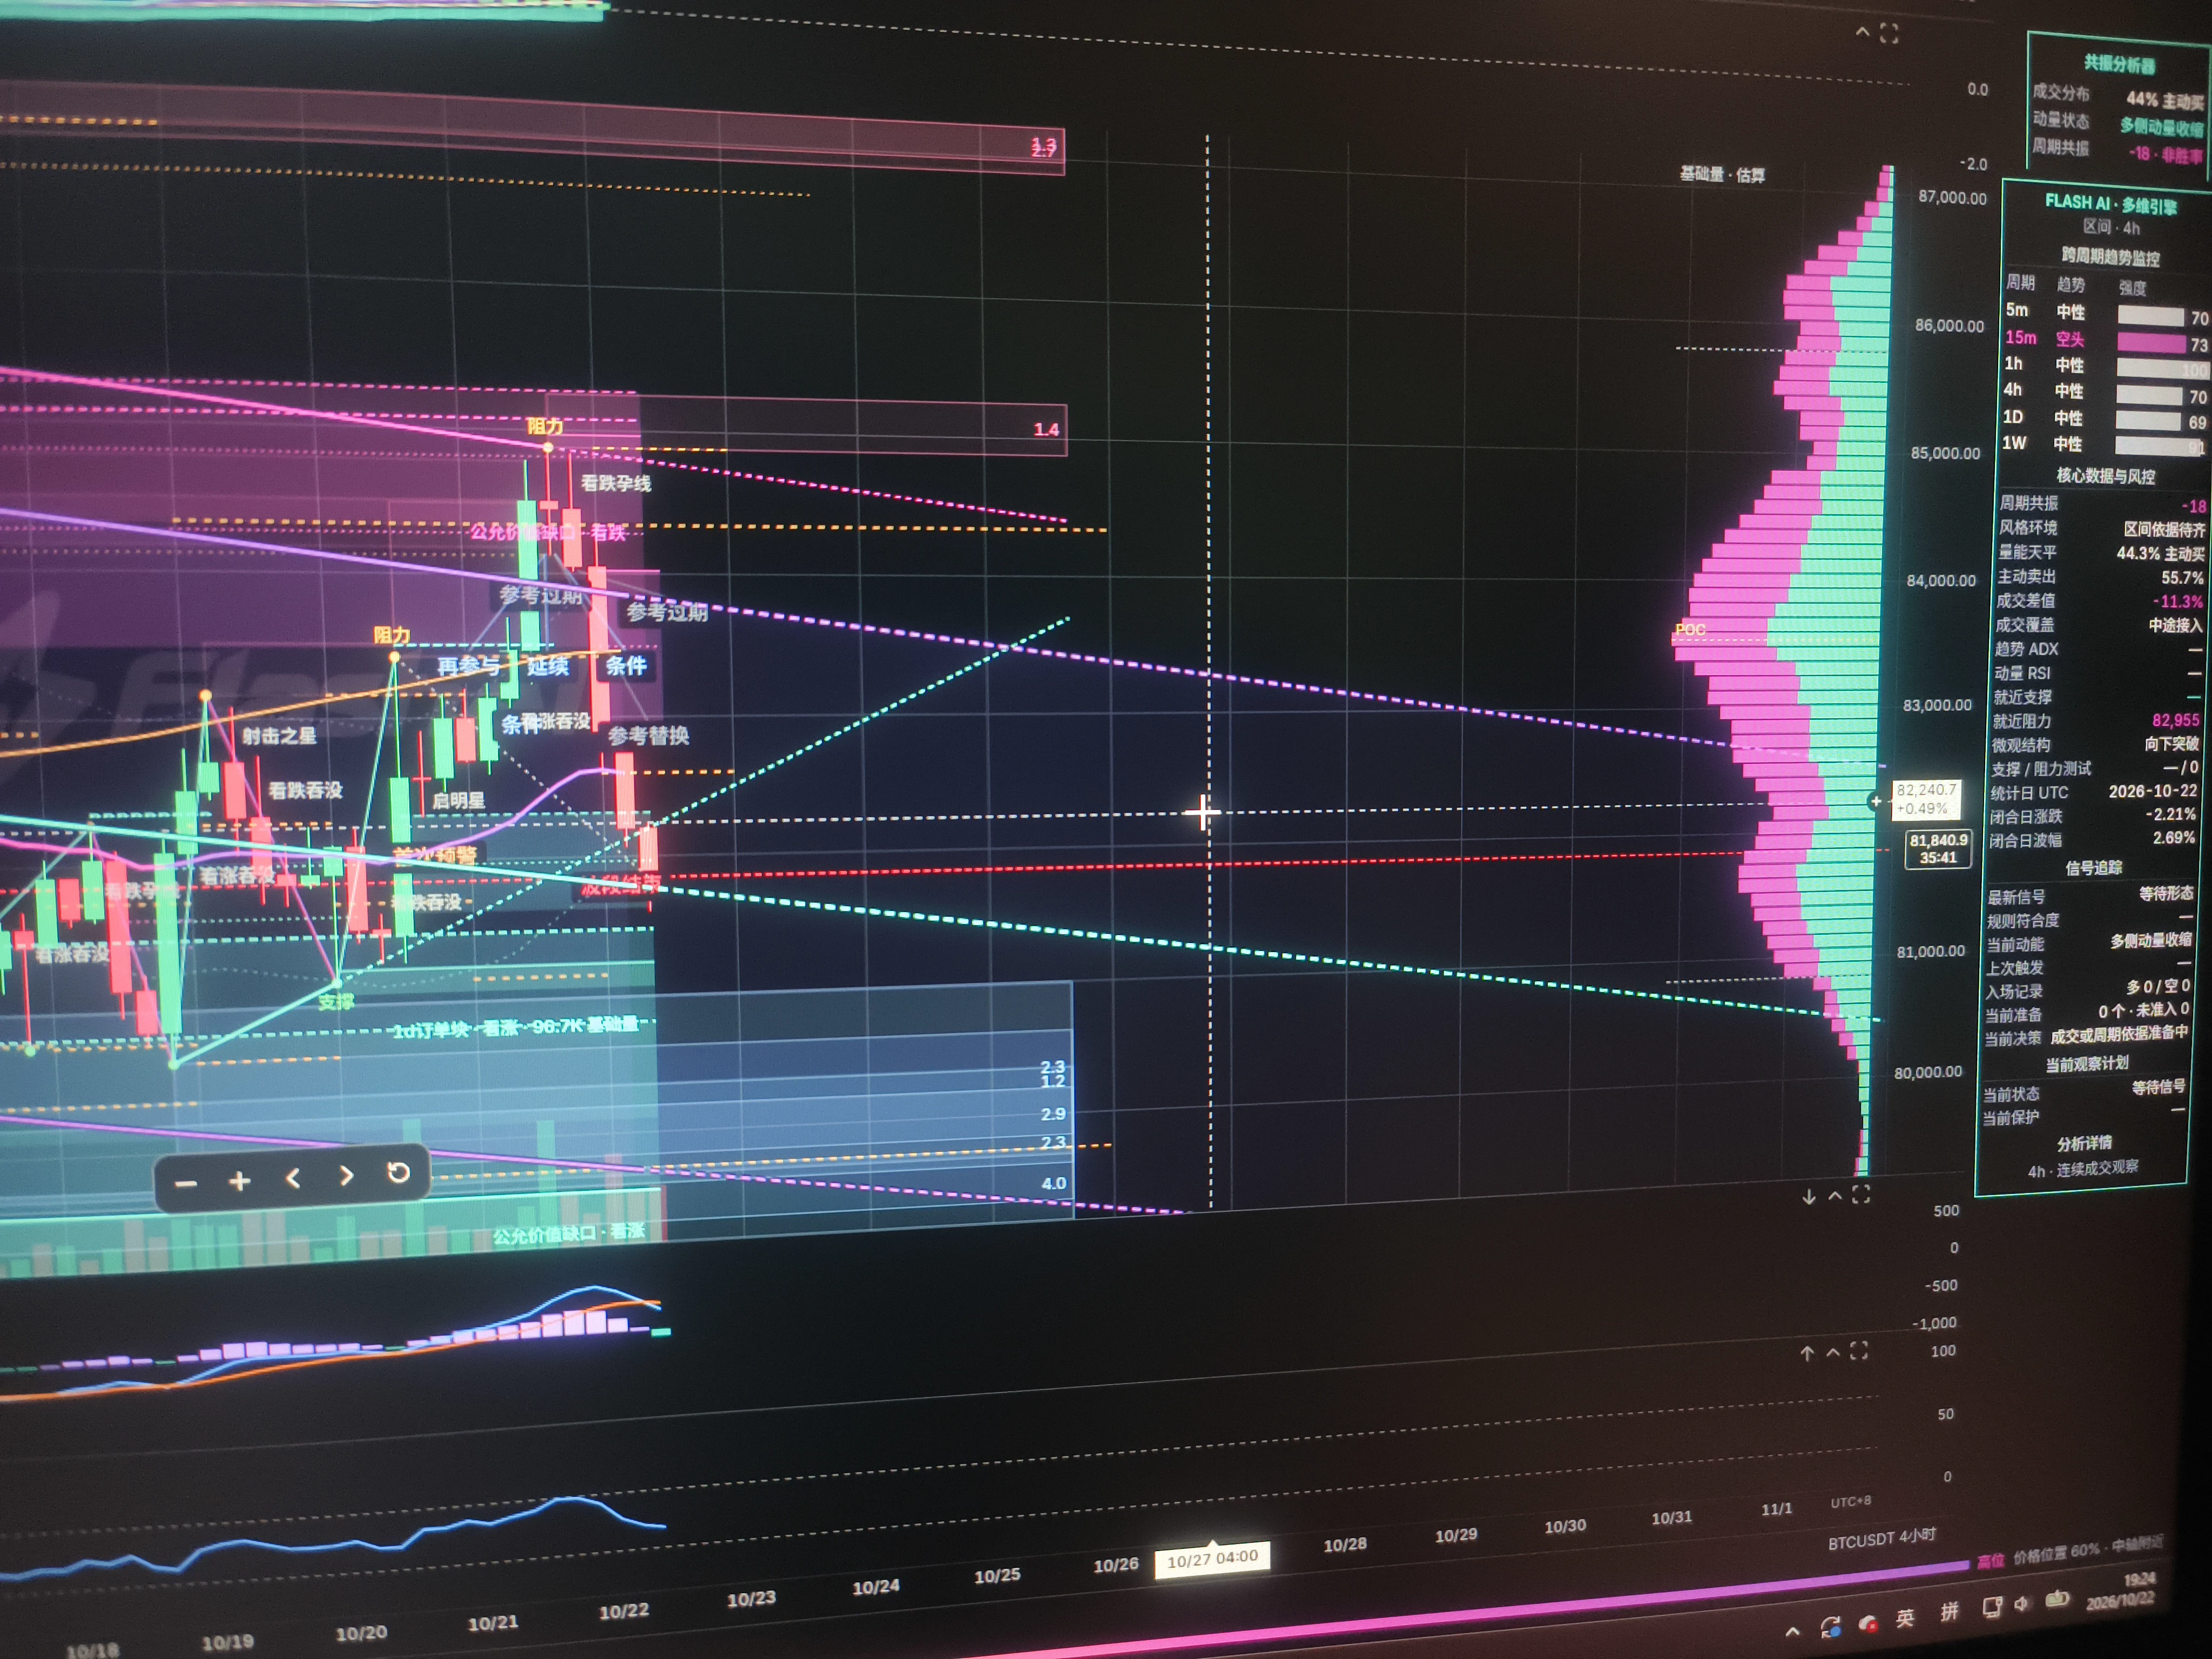
$MU Last night’s pullback was not too deep. If it moves up again, watch the 4-hour OB955 for a pullback; shorts can be considered here. The 875–882 area below can be used for a rebound. The current 15-minute chart is converging, so just see which direction the convergence chooses during the day. If you don’t know how to identify stop-loss levels, watch Section Chief’s ICT Tutorial Episode 03: Market Structure!
post-image
MU+1.93%
The short-term prediction market shows an extremely strong bullish consensus, with the market barely considering price action below 78000.
All three strike levels have extremely low odds, leaving no room for returns on the long side;
With expectations so highly aligned, beware the risk of a low-probability black swan wick; if a rapid drop occurs, it will have a strong impact on the market.
post-image
One: Today we have to congratulate the subscribed followers who were monitoring the charts—the pickup code last night brought in profits, because none of the limit orders were filled.
Last night's pickup code SIREN rose from the tweet price of 0.0273 to 0.035, a gain of as much as 28%. The take-profit level we gave was 0.035, representing a gain of only 13.5%. The actual gain was more than double the range we gave, and some people still failed to keep up.
Review of the strategy:
The October 15 pickup code SIREN was a trade that only those monitoring the charts could follow; most limit orders w
SIREN+34.53%
GT+2.52%
  • 1
$FIL I’m done pretending; I’ll alter the data
FIL+8.57%
  • 1
$AGT is making it tough for traders to choose between LONG and SHORT, even after careful analysis. 📊⚡ The market is moving too fast, and every move brings uncertainty. Stay sharp, stay disciplined, and manage your risk! 🎯
AGT+109.84%
Load More

Join 40 M users in our growing community

⚡️ Join 40 M users in the crypto craze discussion

💬 Engage with your favorite top creators

👍 See what interests you

Trending Topics

USSeptemberPPIBeatsExpectations

91.35k Views1.9k Discussing

US September PPI came in at 6.3% YoY, well above the 5.3% market expectation, pointing to renewed producer-side inflation pressure. Weekly jobless claims were 199K, broadly in line with forecasts. Could hotter inflation further reduce room for rate cuts, and what does it mean for $BTC, US stocks, and gold?

GateWCTCS9GlobalTradingCompetition

37.87k Views6.4k Discussing

WarshIMFSpeech

62.4k Views745 Discussing

View More