


Square
Following
Hot
News
Profile
Share your thoughts
placeholder
Article
Crypto trade Today
live-cover
LIVE1,111
Stablecoin Supply Changes Reveal New Shifts in Crypto Market Activity
live-cover
LIVE910
Some coins, when I follow their liquidity and movement and like them, then enter the platform and check the order book... I back off, give up, and stop.
The reason is that my buying power is greater than the order book.
Do you identify the coin from the order book? It has a good opportunity, God willing.
post-image
🚨 JUST IN: $215 MILLION worth of crypto long positions have been liquidated over the past 24 hours. 🩸
post-image
#STRKUpOver55%in24Hours Starknet’s Quantum-Resistant Layer 1 Ambition Meets a $127M Token Unlock
STRK’s explosive rally has put Starknet at the centre of a major market debate: can a potential move from Ethereum Layer 2 to an independent, quantum-resistant Layer 1 create lasting token demand, or has speculative trading moved ahead of the fundamentals?
On October 12, STRK was reported to have surged approximately 55.16% in 24 hours, with its recent high near $0.1235. However, the latest available market snapshot showed the token pulling back to approximately $0.111, down 5.77% over 24 hours aft
post-image
STRK-18.35%
ETH-0.79%
$ICP compute demand going up too, great to see!
👌
post-image
ICP-1.64%
$W
POSITION CLOSED!
ALHAMDULILLAH!
MASSIVE GAIN...
post-image
Many traders chase after seeing a sharp one-day surge, but overlook a more important signal: which asset in the same sector is strengthening against the trend. $RSR rose nearly 40% today, while RAY fell nearly 11% and ONDO dropped more than 3% over the same period. This divergence is what deserves closer study.
Looking across the three, RAY's RSI has fallen to 28.8, with a bearish MACD and the price near the lower Bollinger Band, indicating oversold conditions but no signs of stabilization; ONDO is likewise trading below MA5 with an RSI of 36, consolidating weakly. Meanwhile, $RSR 's MA5 has
post-image
ONDO-3.03%
📊 NEW PREDICTION MARKET: Where will UK September inflation land?
The 3.4–3.6% range leads at 53% in the Oct. 12 snapshot. October’s energy cap changes fall outside the September reading.
post-image
A quarter-ounce silver coin sold for $8, and people at the venue were calling it a steal. At today’s prices, that’s practically giving it away. Staring at the charts for too long can make you see what you want to see. The physical premium on silver is only just starting to emerge. Where should you set your stop-loss? Those watching, give it a follow. #Silver
post-image
XAG-1.29%
📉 Korean equities slide as Samsung and SK Hynix face macro pressure.
KOSPI dropped over 3% to a two-month low, with foreign investors selling for a fifth straight session. AI bubble concerns and elevated Treasury yields are weighing on the market.
⚖️ The details:
• SK Hynix fell over 2%.
• Samsung Electronics also weakened.
• Samsung's preliminary Q3 data showed strong revenue and profit, pointing to solid memory demand.
Macro sentiment is driving price action right now, while underlying demand signals remain positive. Two different pictures.
💬 Share Your Take
Korean stocks plunge as Samsung
post-image
Gate_Square
🧧 Gate Square Share Weekly Special Edition Is Here!
💰️ Post with hashtags for red packets, new users 100% win!
Up to 100 USDT on the weekly leaderboard!
📌 How to Join
1️⃣ Register 👉 https://www.gate.com/campaigns/6244
2️⃣ Share with #ShareWeekly and
‍#WillYouBuyDipInKoreanStocks
💬 Share Your Take
Korean stocks plunge as Samsung and SK Hynix slide. Is it time to buy the dip?
🎁 Limited red packets, share views, first come, first served!
Post Now: https://www.gate.com/post/topic/KoreanStocksPlungeWillYouBuyTheDip?topic_id=205811
repost-content-media
  • 1
$NIL Down 14 points in a single day, and those who chased the price at 0.0959 now have their accounts deep in the red.
This drop isn't unjustified. The 24h trading volume was 16.1M, and although volume didn't increase, the price was hammered directly from 0.0959 to 0.0794—a typical liquidity vacuum sell-off. The current price of 0.0809 is sitting right near today's low, indicating that selling pressure has not yet been fully released.
I haven't seen any unusual whale activity on-chain, but the market is speaking plainly—there is no buying support. 0.08 is a psychological level; breaking it wou
NIL-13.53%
BTC-1.40%
SOL-3.51%
World Liberty Financial's USD1 moved $2.22B on Ethereum in the past 30 days, up 37.69%. BitGo holds the reserves backing USD1.
@worldlibertyfi
USD1+0.04%
ETH-0.79%
"You can never cross the ocean unless you have the courage to lose sight of the shore."
Christopher Columbus
post-image
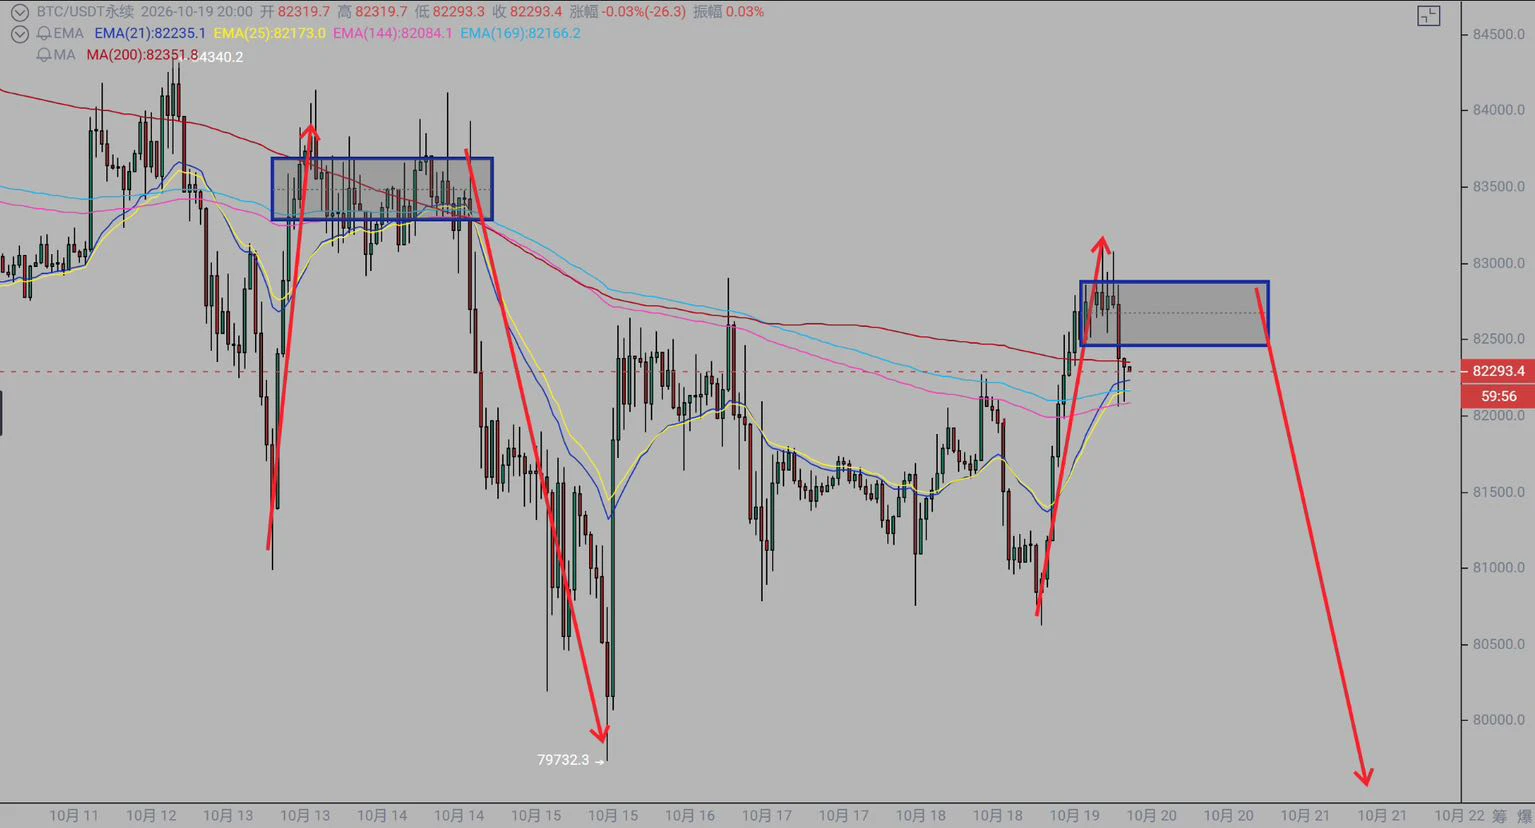
BTCUSDT Market Update: False Breakdown Recovered — Is 85,600 the Next Target?
Market Structure: Bulls Attempt to Regain Control
Bitcoin has rebounded from its recent support area after a period of consolidation within a descending channel and triangle structure. Following an earlier breakout attempt, BTC entered a range, tested resistance near 85,600, and subsequently retreated toward support.
The latest recovery suggests that buyers are attempting to regain momentum. BTC is currently described as trading below the 85,600 resistance zone while holding above the 81,500 support area and the asce
post-image
BTC-1.40%
Think I may be on to my second 1000x+ publicly .
ZCAT was 8k but I didn't know you could call non pump tokens then lmao.
post-image
ZCAT-3.26%
Many people see a 40% 24-hour gain and chase in, but never first ask: if it moves in the opposite direction tomorrow, where will I admit I was wrong? $OSMO is a typical example right now—the current price is 0.0516, 24h +41.37%, RSI has reached 79.2, and the price at 0.0516 has surged above the upper Bollinger Band at 0.0483. MA5=0.04508 is far above MA20=0.03982, and the MACD histogram at +0.001141 remains bullish, but the amplitude across 30 candles is approximately 38.95%, with volatility at an extremely high level. The greed index is 69, indicating overheated sentiment. Worst-case scenari
post-image
OSMO+40.98%
RAY-10.91%
$WDC
There’s no topping structure that could end the rally, but it looks capable of a deep correction. It broke back below the triangle
post-image
WDC-2.58%
Another coordinated low cap pump & dump
Bullish tweets being deleted as we speak
$W
post-image
#BTCUp1.17% ‌
#BTCUp1.17% Bitcoin at $83,600: Short-Covering Bounce or a Genuine Trend Reversal?
Bitcoin has recovered to approximately $83,600 on October 12, bringing buyers back into the discussion after last week’s sharp sell-off. The rebound follows a move toward $81,000 and comes as bearish positions face pressure, but BTC remains below the $84,000–$85,000 area that would provide stronger evidence of recovery. The important question is not simply why Bitcoin bounced. It is whether the market can sustain the move once short-covering demand fades.
The Liquidation Effect: Why BTC Rebounded
post-image
BTC-1.42%
Load More

Join 40 M users in our growing community

⚡️ Join 40 M users in the crypto craze discussion

💬 Engage with your favorite top creators

👍 See what interests you

Trending Topics

GateWCTCS9GlobalTradingCompetition

35.48k Views5.47k Discussing

Gate WCTC S9 Global Trading Competition is officially live, crossing asset boundaries across crypto, stocks, and CFDs with an 8M USDT total prize pool. The Lucky Launchpad guarantees a win every time, new users get a 20 USDT futures voucher upon registration, and the Event Contract PK tournament features a prize pool of up to 400,000 USDT.[👉 Read announcement](https://www.gate.com/announcements/article/102133)

GateXRedBullWinsSingaporeGP

174.4k Views6.49k Discussing

WillYouBuyDipInKoreanStocks

61.76k Views1.79k Discussing

View More