
Share your thoughts
placeholder
Article
$DASH getting ready to hit our 1st targets 😉
Who's in????
post-image
NVD
NVDNVIDIA
Pump.Fun
MC:$2.84KHolders:2
0%
CryptoSat
$DASH is so beautiful right now Buddiesssssss... We can see above 70$ soon 😍
RSI is in overbought zone adding more fuel to pump more... And also just suirved recent horizontal resistance...
Who wants take it?
Aim for 72 - 77 as 1st expansion zone
2nd round would be 80 - 100
If it still maintains healthy structure? Then 3rd round towards 120 - 150
repost-content-media
DASH-4.63%
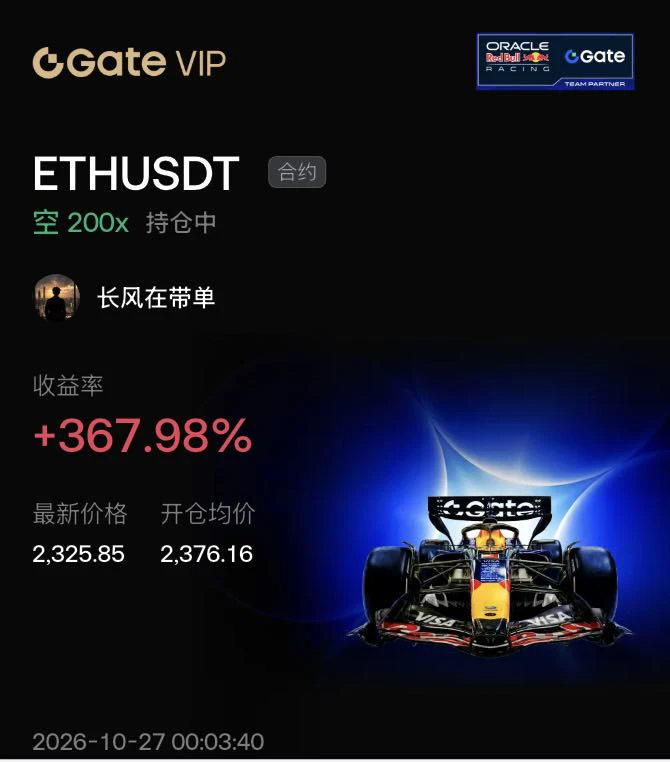
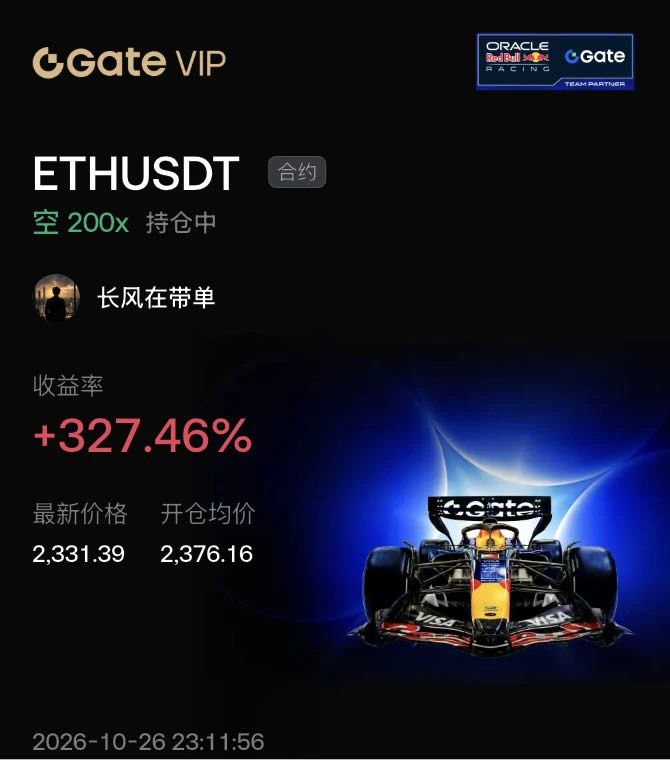
A few days ago I was still calculating whether I had enough money for instant noodles this month; this morning I’m already wondering whether to add a sausage🍜 A few days ago, I took a look at the chart before bed. $BLESS This section clearly had strong signs of a bull trap: every upward push was weak, selling pressure was heavy, and there was no support below. I judged at the time that this wasn’t a good position to chase longs, so I directly placed a short order. Entered at 0.011363, and it has now been pressed down to 0.008681, +464.73% nailed. Those who got on the ride should all be waking
post-image
BLESS-1.54%
ETH-2.61%
SOL-2.20%
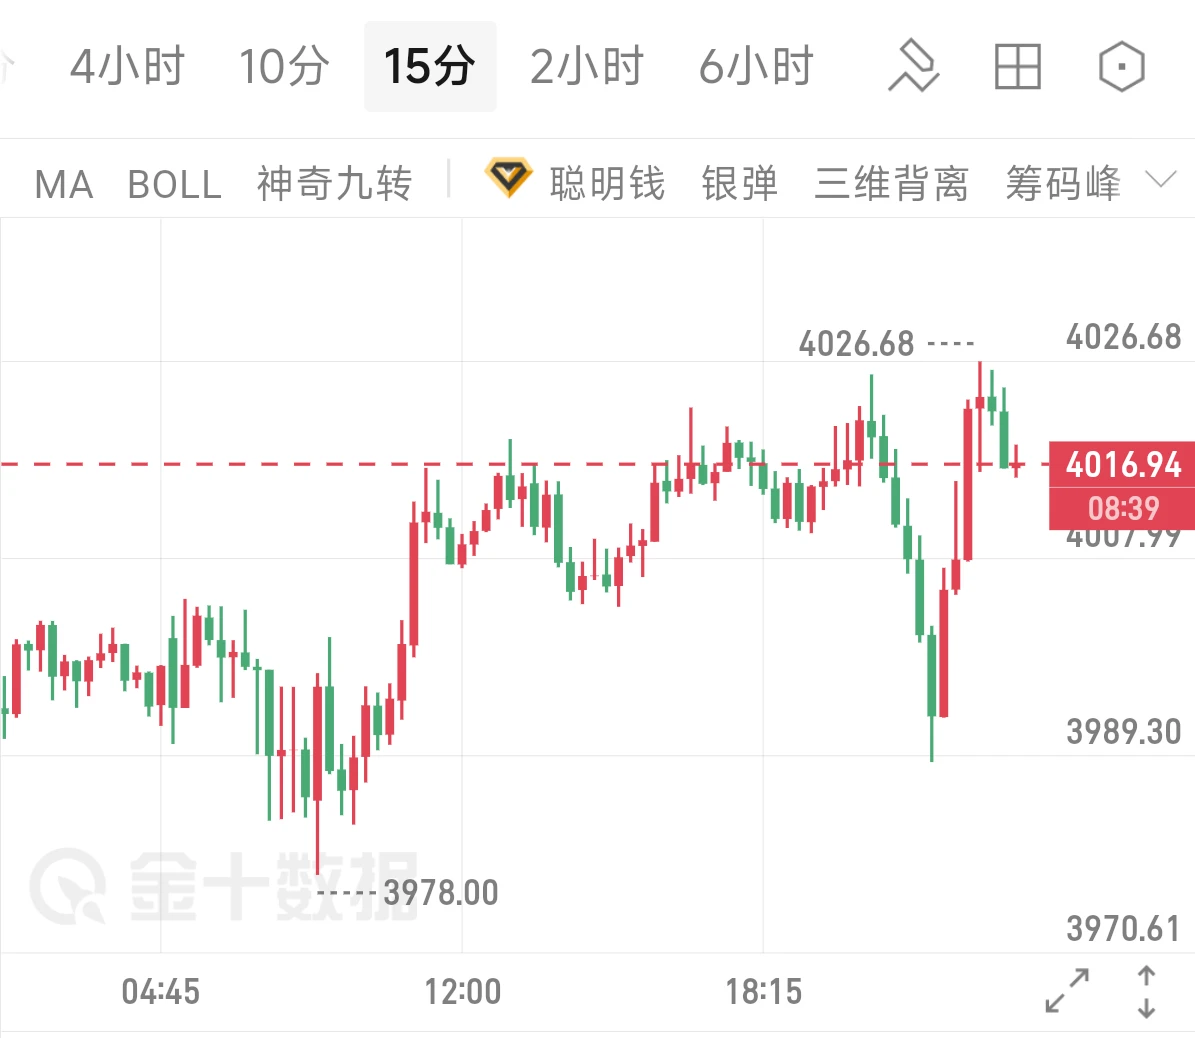
Gold may rebound higher with two relatively attractive selling zones worth watching
$XAU $XAUT
XAU-0.88%
XAUT-0.80%
  • 4
2026‑09‑05 ETH‑USDT Perpetual Contract Technical Analysis Strategy
Content is for technical analysis purposes only and does not constitute trading advice. Contract trading carries extremely high risk.
Key Levels
Resistance: 2510‑2540, 2570‑2600
Support: 2400‑2420, 2330‑2360
Market Overview
The medium- to long-term bullish structure on the daily chart remains intact. After the surge, the market has entered high-level consolidation, with the MACD red histogram contracting and upward momentum slowing. Price action remains highly correlated with BTC. The 4-hour chart is moving within a range, with
post-image
ETH-2.61%
$ETH Signal】Bearish setup - 4H death cross pressure, short on rebound
$ETH Order book bid/ask depth ratio 3.47, with the price repeatedly testing 2451, while the 1H Bollinger Bands narrow to 2409-2513. The 4H MACD has formed a high-level death cross, with the histogram at -0.99, giving bears the momentum advantage. A short position can be set up if the short-term rebound reaches the 2443.6570-2451.0100 range.
🎯 Direction: Short
⚡ Entry/limit order: 2443.6570 - 2451.0100
🛑 Stop-loss: 2475.5201
🚀 Target 1: 2414.2449
🚀 Target 2: 2395.8623
🛡️Trade management:
- Execution strategy: After re
post-image
ETH-2.61%
A few days ago, my hand trembled as I set the stop-loss, only to realize this morning that the filial piety was unnecessary. The last thing I saw before bed was $MSTRX consolidating around 129.26, but funds were already quietly moving in and volume was gradually building. I judged this to be the calm before the launch and directly placed a long order. Looking again now, the price has reached 141.8, and my account return is +466.41%. I caught the rhythm of this move—the long period of grinding beforehand has finally paid off. Staying out of the market is not a sin; opening positions recklessly
post-image
MSTRX-0.69%
SOL-2.20%
XRP-3.77%
On July 18: ¥483; the account balance is now ¥92,800. I withdrew 5k midway, completed 10,000 U, and grew it 200x. I’m really lucky. I couldn’t hold my SAND long position and even stopped out for more than $1,000. If I had held that SAND long position, the account balance would be over ¥100,000 now. What a pity....
SNDK+11.98%
  • 1
【$Q Signal】1H volume breakout + bullish momentum continuation, go with the trend
$Q 1H trading volume surged to 106 million, with the price rushing to 0.0288 and RSI(1H) at 66, indicating buying pressure remains. The 4H MACD shows expanding bullish momentum, while the Bollinger upper band at 0.0279 has been touched and the bands are widening. The order book shows slightly higher selling pressure, with a depth imbalance of -19%; exercise caution when buying the dip.
🎯Direction: Long
⚡Entry/Limit Order: 0.02782727 - 0.02791100
🛑Stop-loss: 0.02651545
🚀Target 1: 0.03000432
🚀Target 2: 0.0310509
post-image
BTC-1.91%
ETH-2.60%
SOL-2.19%
The Pitfalls I Encountered on Gate—A Newcomer’s Guide to Avoiding Traps
After one month, I’ve encountered enough pitfalls on Gate to write a book. Today, I’m sharing a few tips to help newcomers avoid them:
First, don’t jump straight into futures. My experience of being liquidated in 5 minutes is still fresh in my memory. Start with spot trading, and build a solid foundation of basic knowledge first.
Second, don’t go all in on one coin. Diversify your holdings—if one falls, the others can still provide support.
Third, don’t blindly follow the crowd. There’s a lot of information on the feed, so
NVDA+0.87%
Friendly reminder! Conservative strategy.
BTC‑USDT|Current price 79536.1

✅Short-term
Support: 78200, 77100
Resistance: 80800, 82100
🔹Long: Go long after a pullback to 78150‑78450 stabilizes,
Stop-loss 77700, targets 80600‑81900
🔹Short: Go short if a rebound to 80700‑82000 stalls, stop-loss 82550, targets 79000‑77300

✅Medium- to long-term
Lifeline support: 73200
Medium- to long-term resistance: 87800
🔹Long: After holding above 77000, look for pullbacks to enter long, targeting above 87800
🔹Short: If 73200 is decisively broken, follow the trend and enter short positions


ETH‑USDT|Cu
BTC-1.91%
ETH-2.60%
$PONS 24-hour revenue continues to rise and stabilize, while #PUMP's revenue keeps declining
4-hour candlestick (see screenshot): The previous 2 times both pulled back to the 20 MA before taking off again. This time, it may also pull back to the 20 MA before taking off again. The current 20 MA price is around 0.58, but as time passes, the 20 MA price will gradually rise.
Judging from the revenue, #PONS has no significant negative catalyst. After yesterday's surge in volume, a proper consolidation is also a healthy and normal candlestick trend
0x39dbed3a2bd333467115de45665cc57f813c4571
post-image
PONS+3.32%
PUMP-4.13%
market update
live-cover
LIVE1,057
2026‑09‑05 BTC‑USDT Perpetual Contract Technical Analysis Strategy
For technical analysis purposes only; not trading advice. Futures trading carries high risk.
Key Levels
Resistance: 80700‑81200, 82100‑82400
Support: 78400‑78800, 75400‑75800
Market Overview
The daily bullish structure remains intact. After rising above 82200, price encountered resistance and pulled back, with weakening upward momentum, entering a high-level consolidation and repair phase. The 4-hour chart remains range-bound, with 80000 serving as the short-term dividing line. Weekend liquidity is relatively weak, making volat
post-image
BTC-1.93%
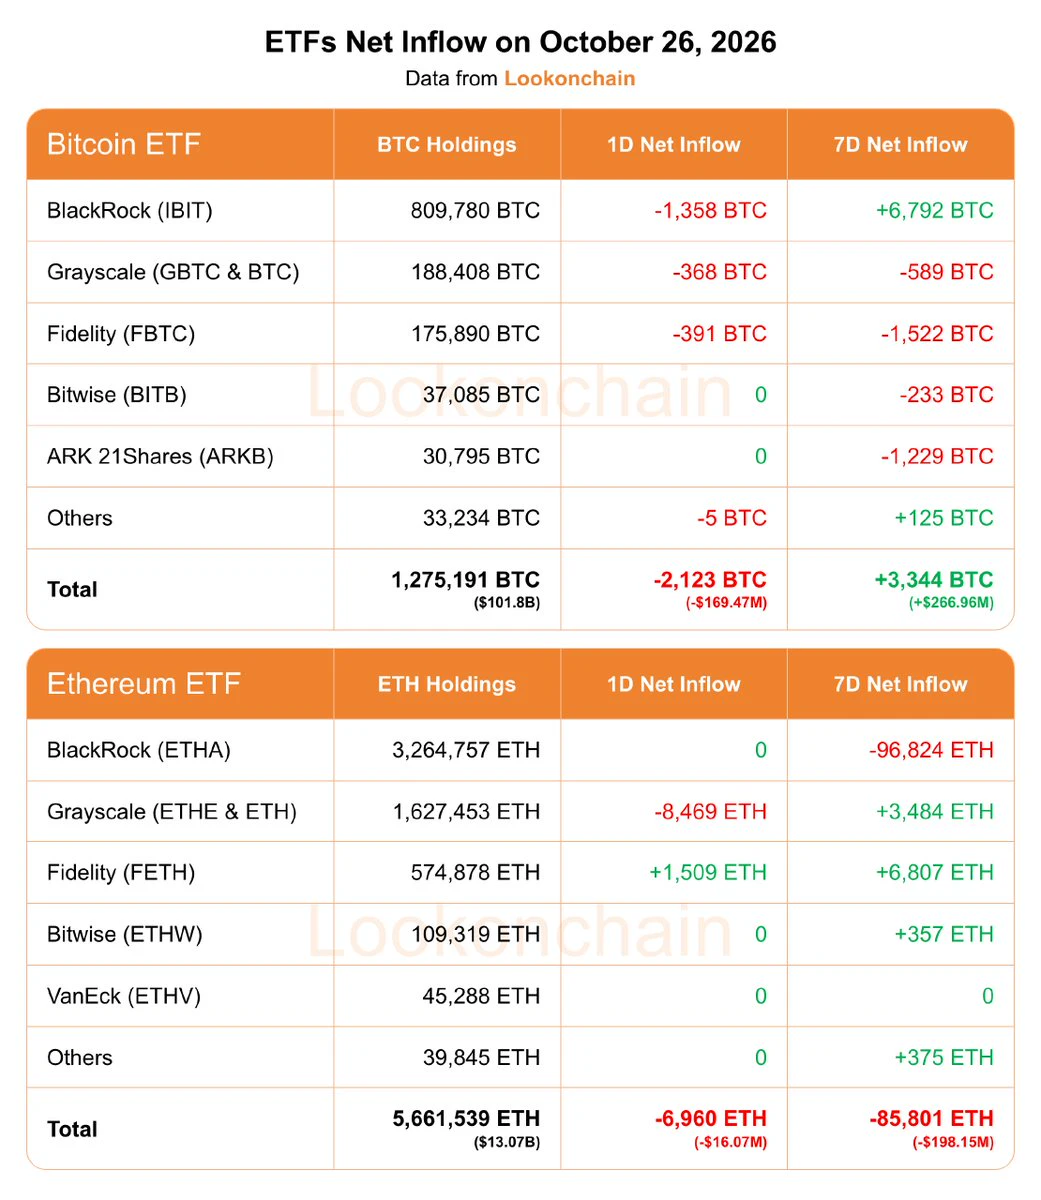
JUST IN: U.S. spot Bitcoin ETFs posted a net inflow of $174.6 million yesterday, extending a three-day streak. Could signal firm sustained demand from institutions. $BTC
post-image
BTC-2.35%
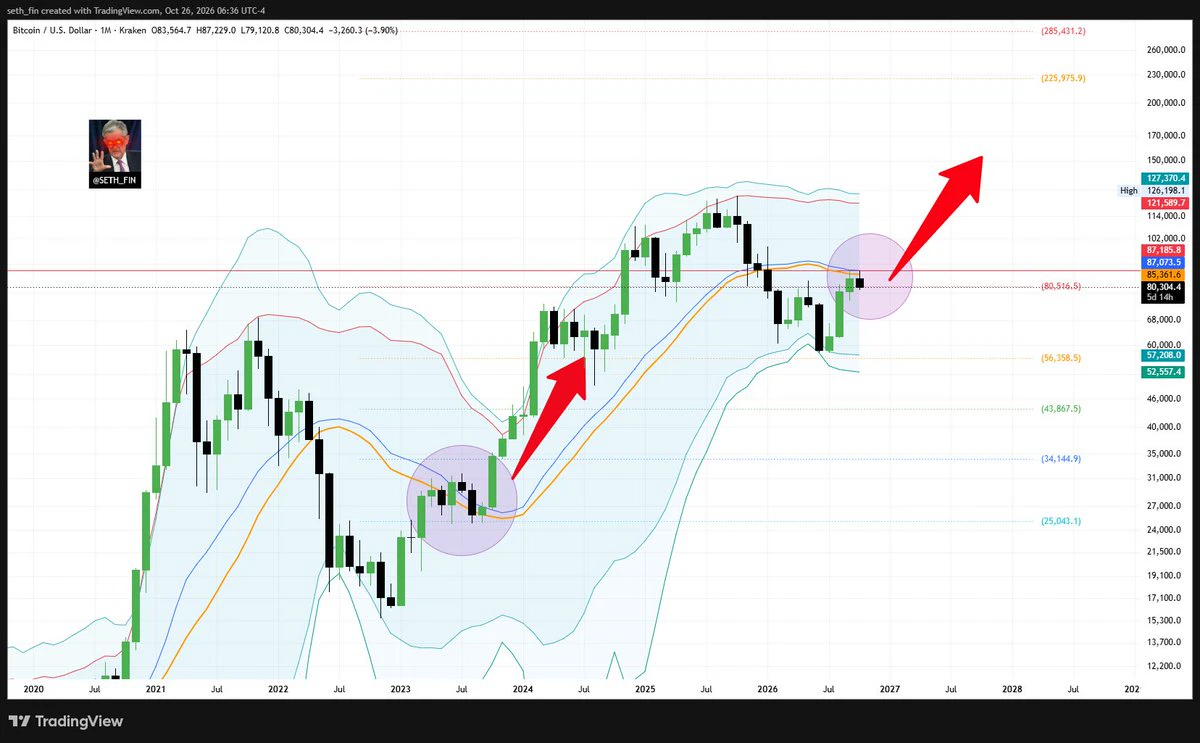
In 2026, the Bitcoin market is expected to remain volatile, with a pullback to around 75,000 being the most likely scenario; a rise to 85,000 during the year has strong consensus; breaking through 90,000 will be somewhat difficult and is considered a neutral-to-optimistic event.
post-image
BTC-1.91%
The older generation’s empathy amounts to only 0.1 grams.
post-image
Real-life crypto trading VS comic-book crypto trading
post-image
Want to buy a dog? Buy Nvidia first.
That’s the idea behind the latest “Crypto-Stock Meme” trend gaining attention around Robinhood Chain.
The model connects tokenized U.S. stocks such as $NVDA with crypto assets and meme-style trading, creating a new bridge between traditional markets and on-chain speculation.
The bigger story is the liquidity.
In just two months, the model has reportedly generated hundreds of millions of dollars in additional trading activity and locked value. But there’s an important problem: U.S. stock markets close on weekends while crypto markets trade 24/7.
That creates
post-image
NVDA+0.87%
  • 8
9.5 BTC Market Analysis
Last night's nonfarm payrolls data significantly exceeded expectations, fueling rate hike expectations. Meanwhile, Trump publicly pressured the Federal Reserve to cut rates, making the macro tug-of-war between bulls and bears particularly pronounced. Next week's CPI will be the key focus.

After surging, the price quickly pulled back, reaching a low of 78600. The moving averages are currently converging in a choppy range, indicating a recovery after the decline rather than a strong reversal. Do not blindly chase the price higher.

Short-term long entry: 78800‑79200, s
post-image
BTC-1.93%
Load More

Join 40 M users in our growing community

⚡️ Join 40 M users in the crypto craze discussion

💬 Engage with your favorite top creators

👍 See what interests you

View More