



Share your thoughts
placeholder
Article
Convert Lucky Draw Phase 23: $1 Unlocks ETH, Check In to Win
https://www.gate.com/share/act/0a621023
post-image
ETH+0.49%
  • 9
Everyone’s watching ENA for a breakout—but the 4h chart is screaming the opposite.

$ENA /USDT - SHORT

Trade Plan:
Entry: 0.17564 – 0.17726
SL: 0.18423
TP1: 0.17062
TP2: 0.16673
TP3: 0.16089

Why this setup?
- 1D trend is *range*, not momentum—meaning the 0.17645 level is a magnet, not a launchpad.
- RSI (15m) at 62 is fading—buyers exhausted before they even reach the 1h resistance.
- ATR (1h) at 0.00324 is tight—when volatility squeezes, shorts win the first pop down to TP1 (0.17062) and TP2 (0.16673).
- Why now? The “waiting” status means the trap is set: 0.17645 is the bait, 0.18
ENA+2.43%
$ETH Signal】Long sniper entry + 1H pullback limit order
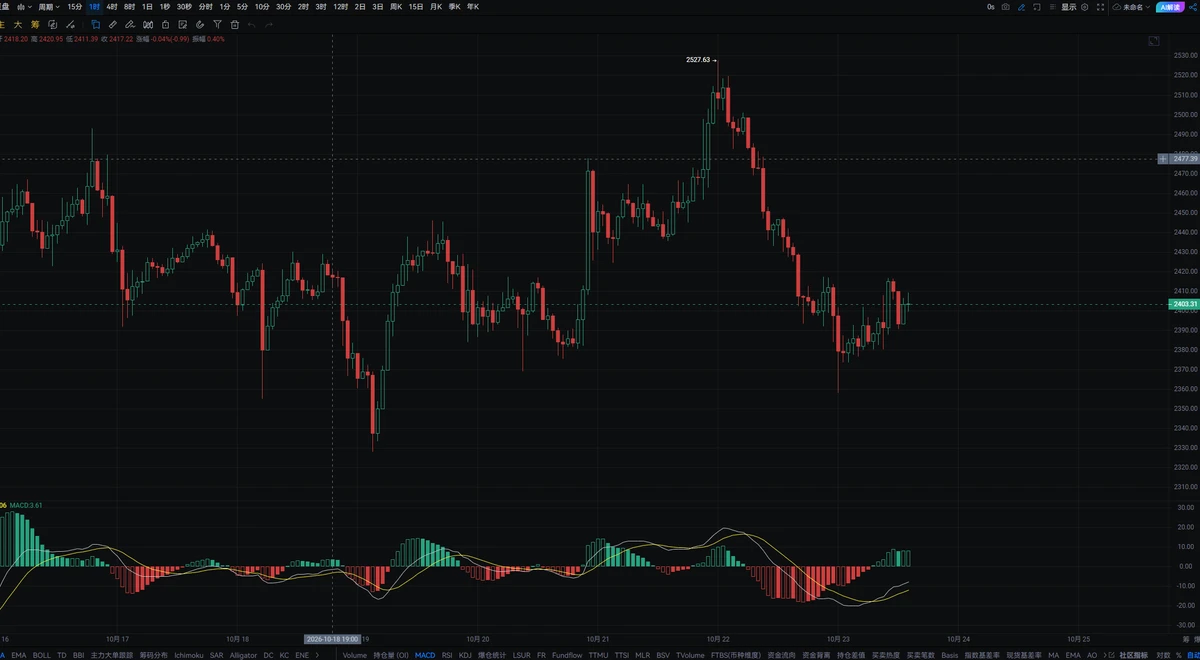
$ETH Order book buy/sell ratio 1.93, with buyers dominant; substantial orders are placed at 2495-2498. 1H RSI is 57.6, the MACD histogram is contracting, and the price remains above EMA20. The 4H Bollinger Band middle line is at 2480, with EMA20/50 arranged upward.
🎯Direction: Long
⚡Entry/Limit order: 2490.3166 - 2497.8100
🛑Stop-loss: 2458.3718
🚀Target 1: 2556.9672
🚀Target 2: 2586.5458
🛡️Trade management:
- After reaching Target 1, reduce the position by 50% and move the stop-loss up to the breakeven level. If the price falls back t
post-image
ETH+0.52%
BTC-0.15%
SOL+1.75%
$ETH Signal】1H pullback long + 4H momentum support
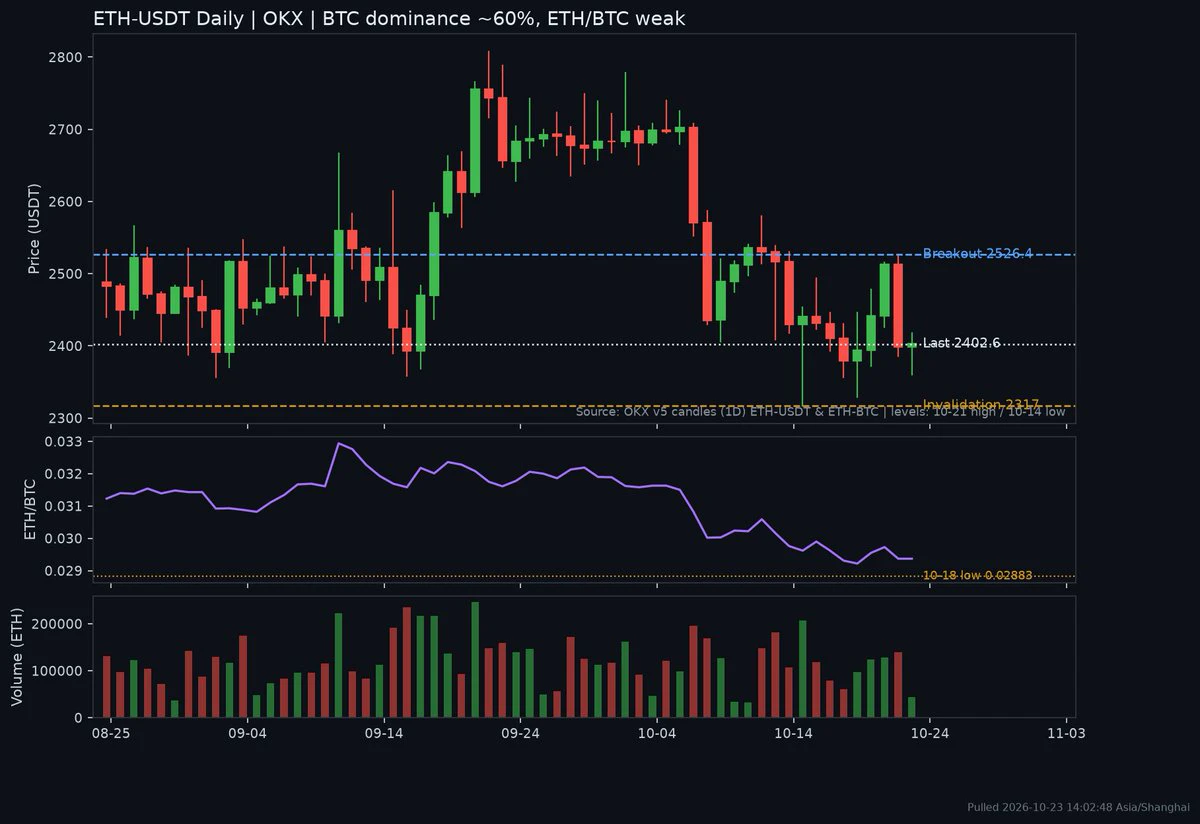
$ETH Order-book sell pressure skewed -57.52%, yet the price is pinned at 2496.32. The 1H EMA20 at 2492.43 provides short-term support, while the 4H MACD histogram is expanding at 1.64, with the broader trend intact. The 1H MACD histogram is contracting at -0.32, indicating a short-term pullback.
🎯Direction: Long
⚡Entry/Limit order: 2489.64-2496.32
🛑Stop-loss: 2462.92
🚀Target 1: 2546.41
🚀Target 2: 2571.46
🛡️Trade management:
- Execution strategy: After reaching Target 1, reduce the position by 50% and move the stop-loss up to breakeven. I
post-image
ETH+0.52%
BTC-0.15%
SOL+1.75%
After $FARTCOIN rallied, I didn’t exit my entire position. I took 80% in profits first and moved the protective stop on the remaining position above breakeven. Just now, a quick pullback took out the remaining position, locking in the profits smoothly.

The entry reason was simple: on the hourly timeframe, price pulled back to the previous high without continuing lower, and instead reclaimed the area above the moving average on rising volume. This was a textbook pullback confirmation. After going long, I kept my stop loss below the lower boundary of the small range.

After the pullback took
post-image
FARTCOIN+2.63%
SNDK+1.13%
ZEC+20.51%
$$COLLECT 24-hour drop of 29%, with trading volume surging to 38.8 million—this script is almost a carbon copy of the big bearish candle on May 19, 2021. The historical pattern is clear: the 6th–8th month after the halving is always a brutal shakeout. October 2020 was like this, and August 2016 was too. Each time, the main uptrend only began 30–60 days after the crash.
The current 0.0405 level happens to be the 0.618 golden retracement level of the previous rally. Yesterday’s sell-off occurred on exceptionally low volume, but trading value continued to expand, indicating that funds were buying
My hand trembled when I set the stop-loss a few days ago, only to realize this morning that the filial piety was unnecessary. 😌

As the market repeatedly swung intraday, the price kept grinding around 91.82, with the volume shrinking more and more noticeably. Someone stepped in to buy every dip. I watched it for half a day; this kind of level is more of an opportunity than a panic signal, so I cautiously took a shot.

The price has now climbed to 104.92, giving a floating profit of +687.56%. We caught the rhythm of this move perfectly, and everyone is feeling great.

Don't lose your patien
post-image
ADA0.00%
ZEC+20.51%
$ZEC Above $1,200 — What’s Behind the Move?
Zcash is up ~37% this week, but the structure matters more than the headline.
• $40M+ ZEC liquidations, mostly shorts
• $2.3B+ open interest
• ZCSH ETF AUM above $400M
• RSI > 80
The rally appears driven by a mix of ETF demand, spot buying and short covering.
The key test now:
Can real spot demand sustain ZEC after the short squeeze fades?
High leverage can amplify the next move in either direction.
BCRYTEX LABS | Crypto Market Intelligence
#ZEC #Zcash #Crypto
post-image
ZEC+20.54%
$NAORIS Signal】Long — building momentum at 1H support
$NAORIS 4H RSI 81.99, order book depth imbalance at -19.23%, with sellers in control. The 1H MACD histogram has narrowed to 0.0003, indicating weakening bullish momentum. Price remains above the 1H EMA20 at 0.0358, and the short-term structure remains intact. Funding rate is 0.0437%, OI is stable, and no extreme long/short positioning bias is visible. The current risk-reward ratio is 1.5, limiting the cost-effectiveness of chasing longs, but buying support exists near 0.0385 below.
🎯Direction: Long
⚡Entry/Limit order: 0.038484 - 0.038600
post-image
NAORIS+24.61%
BTC-0.15%
ETH+0.49%
SOL+1.75%
Everyone’s eyeing BNB at 750—but the 4h chart is silently screaming “trap” while the daily range holds its breath.

$BNB /USDT - SHORT

Trade Plan:
Entry: 749.30 – 751.40
SL: 760.45
TP1: 742.77
TP2: 737.72
TP3: 730.14

Why this setup?
- Price is pinned at 750.35 with a 1D range, yet the SHORT bias (conf 55) targets a clean drop to 742.77 first.
- RSI on the 15m is only 56.1—no overheated bounce fuel, while ATR (4.2) shows volatility is compressed, priming a snap.
- Why now? The “waiting” status means the entry zone (749.30–751.40) is the exact battlefield; a rejection here flips momentu
BNB-2.77%
No vision, can't hold on—this round's profit is as thin as paper, but I absolutely love it🔥. I had just finished lunch and was checking the chart; $SPCX /SPCX was just moving sideways, while funds seemed to be quietly flowing in. I immediately opened a long to catch it, without waiting for the second candlestick to confirm.

This trade feels great. My entry cost was 138.37, and it's now 151.05, +849.76%. Although the profit isn't huge, I've held it firmly. When going long, only realized gains are real.

Pocket 75% first; for the remaining 20%, move the stop-loss to the breakeven line. Exit i
post-image
SPCX+0.93%
ADA0.00%
DOGE-0.73%
$ARB Signal】4H bullish trend intact, 1H stabilizing for a long entry
$ARB Current price 0.18475, 4H MACD bullish momentum is contracting, and the price has retraced from the high of 0.2068 to near EMA20. 1H RSI is 55.35, with signs of a bottom forming. Order book depth imbalance is -4.41%; selling pressure has not been fully absorbed, while buyers are providing support near 0.1840.
🎯Direction: Long
⚡Entry/limit order: 0.18475
🛑Stop-loss: 0.1755125
🚀Target 1: 0.1986063
🚀Target 2: 0.2055344
🛡️Trade management:
- Execution strategy: After reaching Target 1, reduce the position by 50% and mo
post-image
ARB+5.64%
BTC-0.15%
ETH+0.49%
SOL+1.75%
$MARSCOIN 24-hour dump of 22%, with $350 million in trading volume—this isn’t a pullback; someone is throwing their holdings in your face. Here’s the conclusion: if the 0.177 low breaks, there is no meaningful support below, so don’t rush to catch a falling knife.
You’re asking about the macro picture? There is indeed no CPI or nonfarm payrolls today, and the Federal Reserve is still in its blackout period, but don’t forget that last week’s meeting minutes revealed one signal—the internal disagreement over rate cuts is much greater than what the market has priced in. I pulled nearly three year
MARSCOIN-26.17%
BTC-0.15%
NAS100+0.23%
Keep holding, and be a bit more determined. By the way, if you’ve already reduced your position, hitting the stop-loss still means a profit.
I didn’t do a thing—just went to the restroom, and when I came back, the candlestick chart had already done the work for me. 😂
When I opened the market this morning, $ETH /ETH had just started moving, and volume suddenly surged. Funds were quietly flowing in, buying pressure kept getting stronger with every sell-off, and the pullbacks showed no hesitation at all. I issued a long signal at 2451.64 and entered directly.
Looking again now, the current price is 2498.48, +331.7%. Those already on board must be waking up laughing—this move was purely a gift to the early risers. 😌
Don’t get greedy w
post-image
ETH+0.52%
SNDK+1.13%
XRP-0.25%
Everyone’s staring at the wrong ticker while $USELESS /USDT quietly loads a 95% confidence spring.

$USELESS /USDT - LONG

Trade Plan:
Entry: 0.21712 – 0.22452
SL: 0.18530
TP1: 0.24746
TP2: 0.26523
TP3: 0.29187

Why this setup?
- 4h bias is LONG with a 95% score—this isn’t a coin flip.
- Daily trend is bullish, and the 15m RSI (50.78) sits mid-range: no overheat, no collapse—just clean runway.
- Entry zone 0.217–0.224 is tight; TP1 at 0.247 is a 12% move before you even blink.
- ATR (0.0148) says volatility is awake but not violent—perfect for a controlled breakout, not a fakeout.
-
USELESS-17.99%
MARKET prediction
live-cover
LIVE65
[New Streamer] Market Prediction
live-cover
LIVE45
$AVAX Beautiful Breakout Closed My Long Position Early for $370 In Gains!
post-image
AVAX+1.72%
With this trend, I don’t even need to think—the account is dancing on its own. When the market kept fluctuating intraday, everyone thought there was no chance. I watched the chart grind along a bottom without breaking down, and I knew what was up: if it holds steady, the gains will come. $ZEC is now at 1229.93 from 857.01, up +3090.33%. The beginning was truly sluggish, but the result is truly sweet. The market is waited out, and profits are held onto. Have a strategy before the market opens, discipline during trading, and reflection after the close. I’ll take 75% off the table for now, and p
post-image
ZEC+20.51%
BTC-0.15%
LAB-4.13%
Load More

Join 40 M users in our growing community

⚡️ Join 40 M users in the crypto craze discussion

💬 Engage with your favorite top creators

👍 See what interests you

View More