Square
Following
Hot
News
Notifications
Profile
Share your thoughts
placeholder
Article
$PI Potential for a continued decline in the short term. The price remains capped below the MA10, selling pressure persists, and the MACD is beginning to weaken. Trading volume is also relatively low. Support: 0.0630 – 0.0625 Resistance: 0.0638 – 0.0640 Conclusion: $PI has the potential to decline and test the 0.0630 area. If the support level is breached, the downward trend may continue. If it holds, there remains a possibility of sideways movement or a rebound.

Note: Crypto and stock transactions carry the risk of loss. Please conduct your own research (DYOR) before trading. This informati
post-image
PI-0.60%
Just saw a whale post their positions: short across the board, with high leverage and the entire account on the line. That takes some serious nerve.
$BT : Holding a 5x cross-margin short of 874.51 coins, entry price 76361, position size 57.29 million, current unrealized profit +9.488 million, liquidation price 109620.

$ETH : 5x cross-margin short of 2675 coins, entry price 2322, position size 4.9 million, unrealized profit +1.31 million, liquidation price 16143.
$SOL : 7x cross-margin short of 159,100 coins, entry price 94.3, position size 11.54 million, unrealized profit +3.46 million, liqui
post-image
ETH-1.26%
Trenches
mihao
m
bade
b
mihao
4Cxj...pump
Market Cap
$.
Change
.
24h Vol
$.
Holders
.
bill
b
bade
b
bill
85Rh...pump
Market Cap
$.
Change
.
24h Vol
$.
Holders
.
Socks
S
bade
b
Socks
FS1p...pump
Market Cap
$.
Change
.
24h Vol
$.
Holders
.
PIEVERSE
P
bade
b
PIEVERSE
0x0e...25a9
Market Cap
$.
Change
.
24h Vol
$.
Holders
.
AGT
A
bade
b
AGT
0x5d...e274
Market Cap
$.
Change
.
24h Vol
$.
Holders
.
Retail Investor Sentiment Weakens as Global Markets Face Renewed Uncertainty
live-cover
LIVE647
PEPE MARKET UPDATE: PEPE FALLS 7.31% AS SELLING PRESSURE BUILDS

According to CoinMarketCap, Pepe (PEPE) is trading at around $0.000003931, down 7.31% over the past 24 hours.

MARKET OVERVIEW

* Market cap: $1.62 billion
* 24-hour volume: $497.54 million
* 24-hour high: $0.000004324
* 24-hour low: $0.000003729

MARKET OUTLOOK

PEPE is under short-term selling pressure. A recovery above the recent high could strengthen momentum, while a drop below the recent low may increase downside risk.

As a meme coin, PEPE remains highly sensitive to market sentiment and speculative trading.

Crypto Insigh
PEPE+0.97%
SOLANA MARKET UPDATE: SOL CLIMBS 6.85% AS PRICE RECOVERS

CoinMarketCap data shows Solana trading at $70.28, a 6.85% gain over the past 24 hours.

MARKET OVERVIEW

* Market capitalization: $41.58 billion
* 24-hour trading volume: $5.31 billion
* 24-hour high: $76.11
* 24-hour low: $67.55

MARKET OUTLOOK

SOL has gained momentum after bouncing back from its 24-hour low. Traders will be watching to see if buying activity can keep pushing the price toward its recent high.

Moving above $76.11 could add to the bullish momentum. A fall below $67.55, on the other hand, may point to renewed selling p
SOL-0.77%
Gm everyone ☀️
$mihao will save us from this bloodshed.
post-image
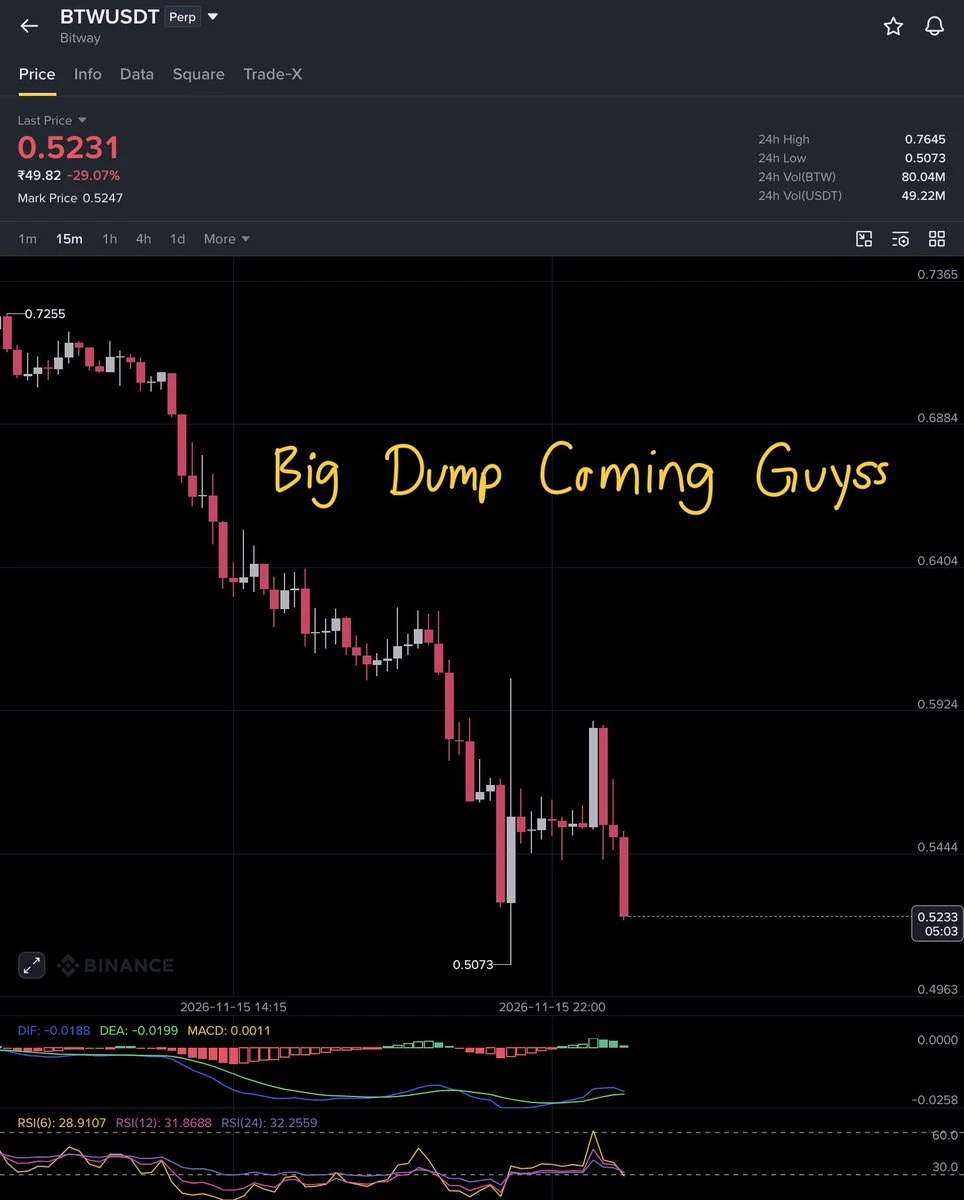
💰 $BTW   /USDT
🔻SHORT
✳️ ENTRY (Use DCA STRATEGY) : 5330, 5400, 5470
🎯 TARGETS - 5160, 5000, 4500, 4000, 3500
🀄️ LEVERAGE -  cross 10x
🔴 STOPLOSS - 5530
Invest 2% fund only
post-image
BTW-7.75%
  • 1
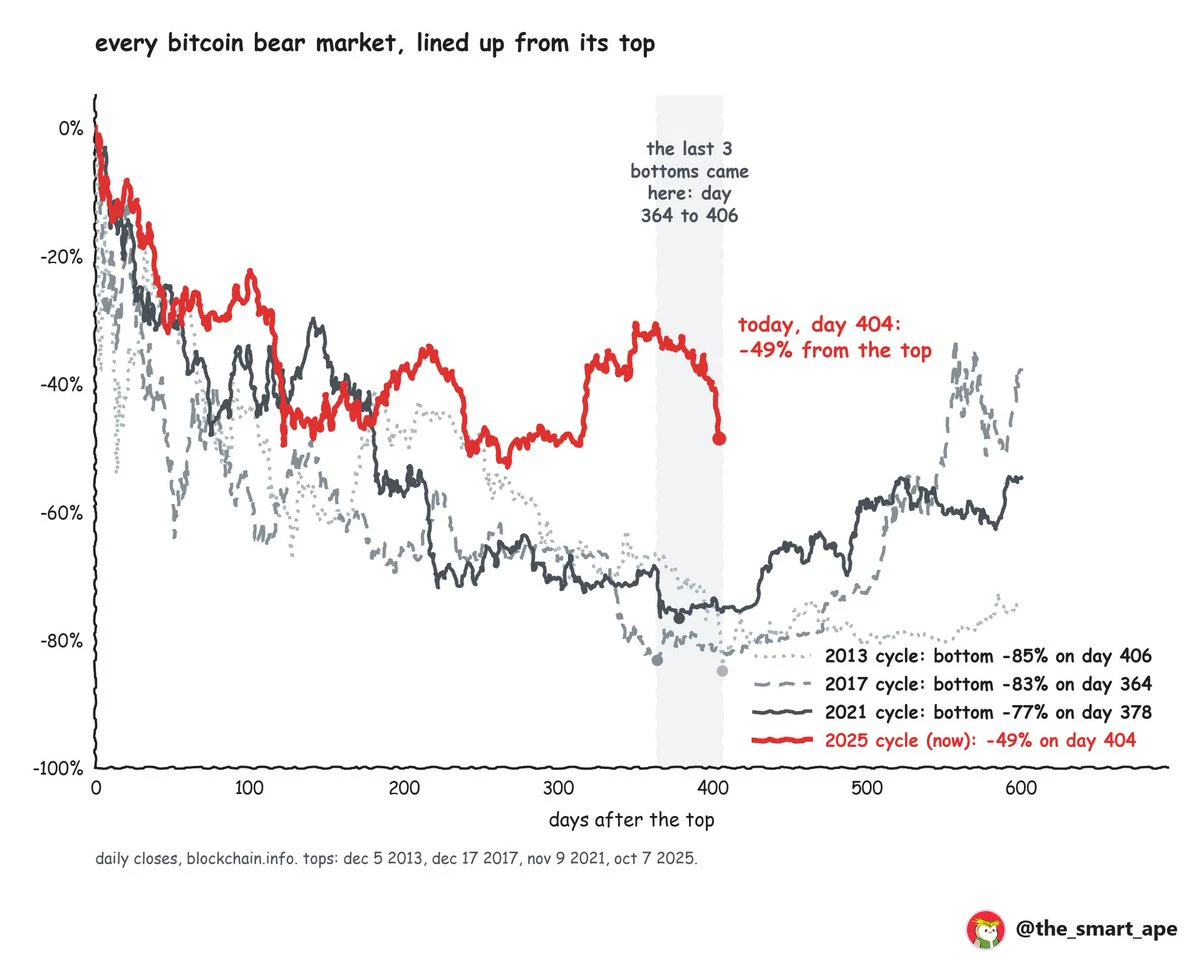
mark my words: it’s up only from here. the bottom is in.
the last 3 bear markets bottomed 364 to 406 days after the top. today is day 404.
i lined up every bitcoin bear market from its top:
> 2013 top: bottomed on day 406, -85%
> 2017 top: bottomed on day 364, -83%
> 2021 top: bottomed on day 378, -77%
> 2025 top: day 404 today, -49%
3 different ways to count the cycle all land on the same window:
> top + 12 to 13 months → oct 6 to nov 17 2026
> next halving (~april 2028) minus ~17 months → oct 16 to nov 14 2026
> last bottom + 4 years → oct 23 to 29 2026
so by the calendar, we’re in the botto
post-image
BTC-0.67%
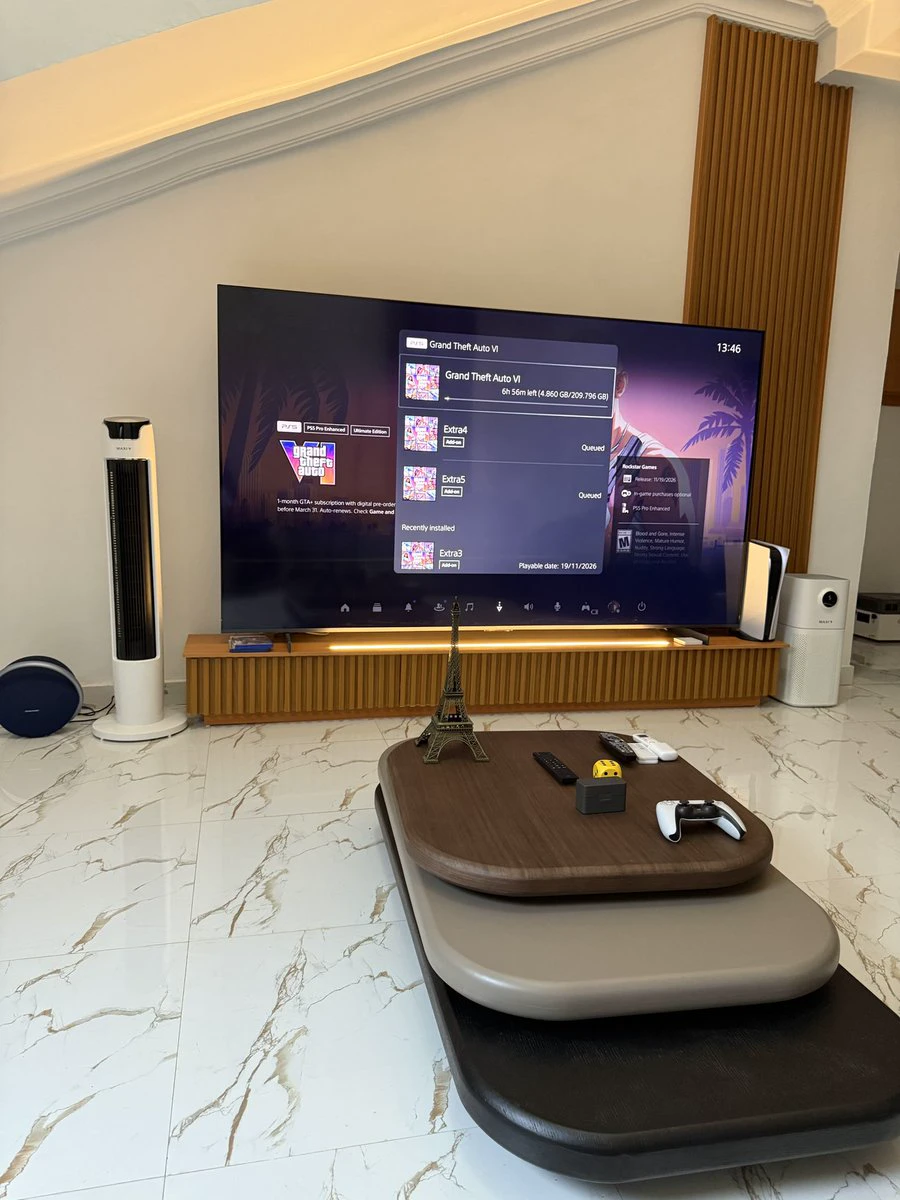
I just pre-ordered for the #GTAVI , was this a good investment 💀?
#GTA6 is 209 GB, which games will you be deleting from your PS5 to free up some space ?
post-image
#ShareWeekly #Anthropic #WCTCS9

The artificial intelligence industry is approaching another major financial milestone, and Anthropic is increasingly becoming the center of attention. Expectations surrounding a potential $1.5 trillion IPO valuation are raising an important question across financial markets: How much are investors actually willing to pay for the future of artificial intelligence?

What makes this situation particularly interesting is the contrast between private AI company valuations and the recent weakness across publicly traded technology stocks. As AI-related equities exper
GOOGL-0.98%
It was still pushing higher shortly after 1, reaching a high of 64934 at $BTC 01:15, just over 60 points shy of 65000. It failed to hold, and selling picked up at 01:30. The 01:45 15-minute candle saw about 36.7 million USDT in volume, more than the 22:30 candle that broke below 65000. It hit a low of 64381, just over 100 points above the overnight low of 64257, but didn’t break through. The current price is around 64650. For now, the key question is whether 64257 holds: a 15-minute close below it would put the afternoon low of 63777 in view; if it holds and price reclaims 65000, that high-vol
post-image
BTC-0.67%
#GateIPOAccessAnthropic
🚀 **Gate IPO Access: Bringing the Future of Artificial Intelligence Closer to Global Investors**
The artificial intelligence industry is entering one of the most exciting phases in financial and technological history. Among the companies attracting significant attention is **Anthropic**, a leading AI research and development company known for building advanced artificial intelligence systems and its Claude family of AI models.
With the growing discussion around **#GateIPOAccessAnthropic**, investors are increasingly interested in how they might gain exposure to one of
post-image
  • 1
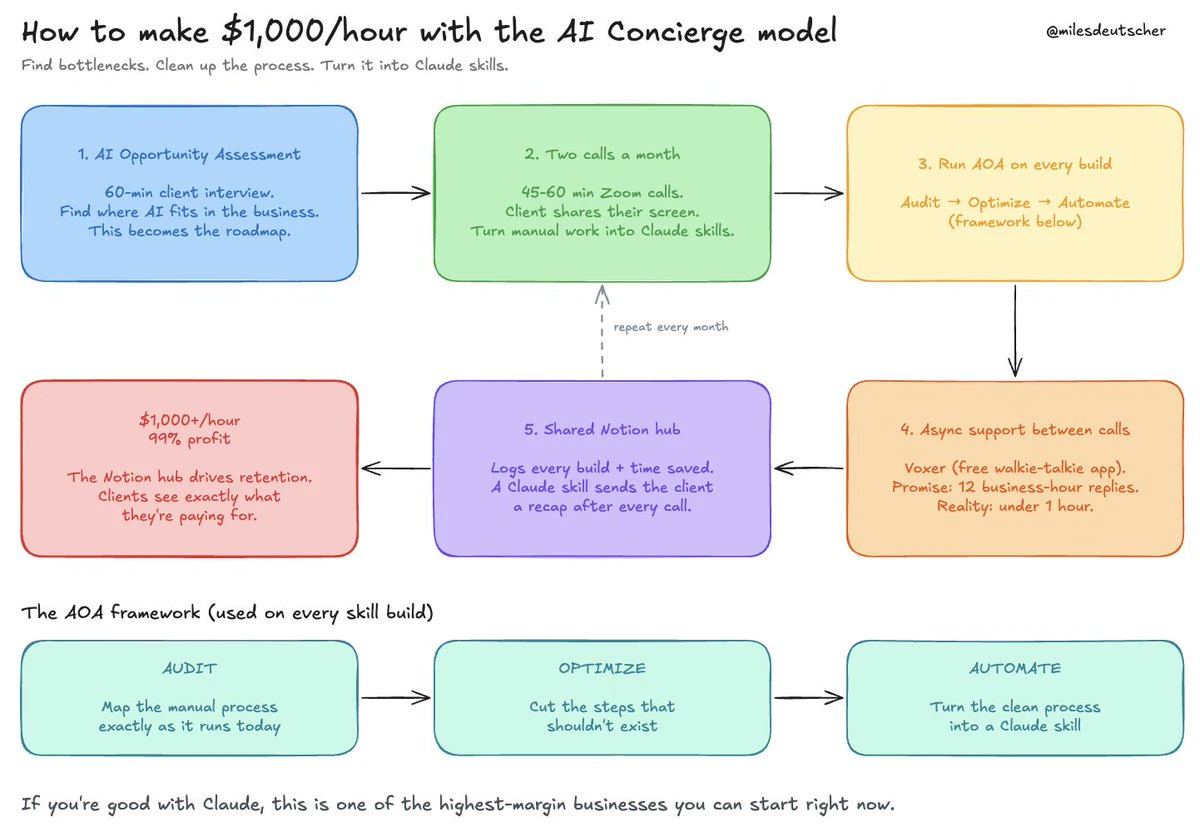
How to make $1000/hour with an AI concierge biz model:
(literally a 97%+ margin business)
post-image
Crypto Market Updates
live-cover
LIVE4,674
Following up on my previous post, here’s what I think is the most likely next move for Bitcoin. This is purely my personal opinion, just sharing—please don’t take it too seriously!!! First, on Saturday, with no substantial major risks or bearish news, Bitcoin saw a massive sell-off. I think this was simply a way for market makers to liquidate positions. Looking at the Coinglass data in Figure 1, during the sell-off, longs were closing while shorts were entering, and the weighted funding rate remained elevated. Then the market started to cascade until it finally stopped falling at 9:00 a.m. Sun
post-image
BTC-0.67%
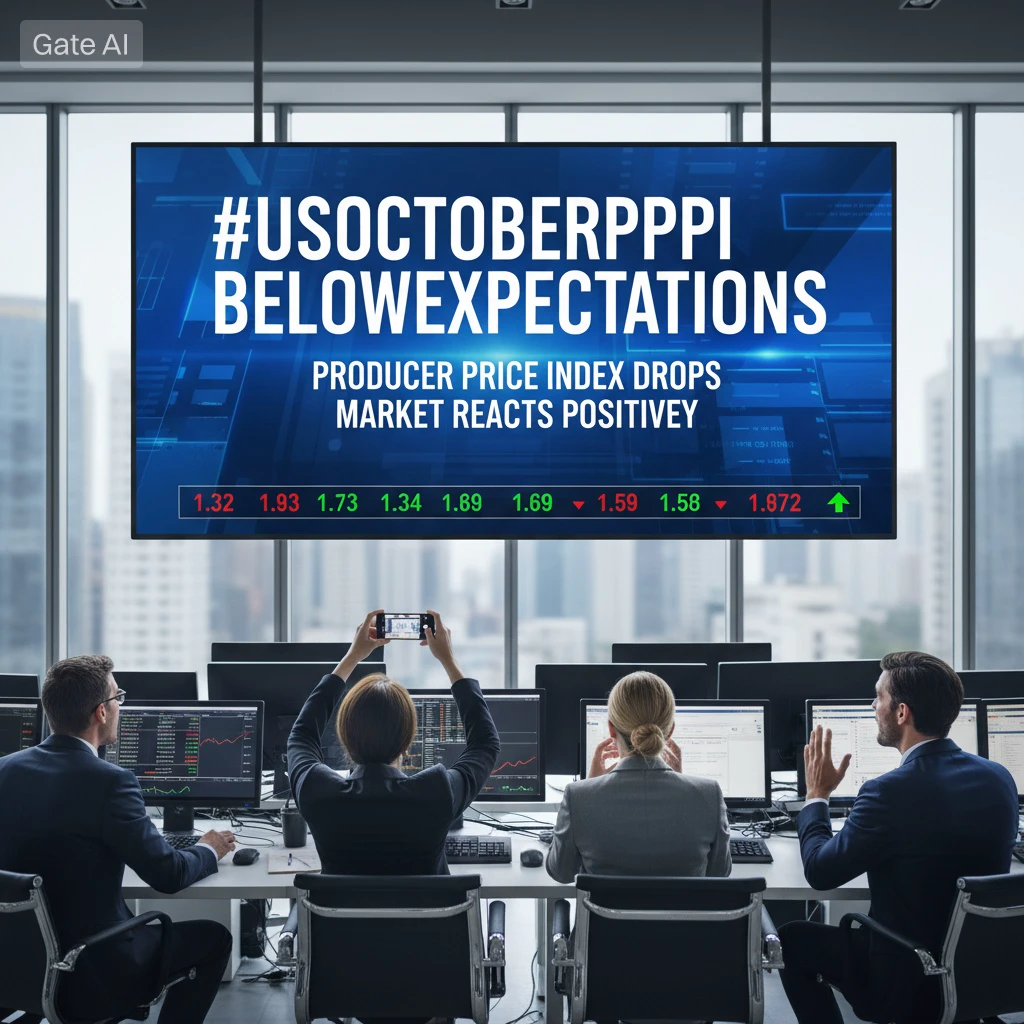
#USOctoberPPIBelowExpectations
The latest US October Producer Price Index (PPI) data has attracted significant attention across global financial markets. Producer inflation reportedly came in below market expectations, creating fresh discussions about the direction of US inflation, Federal Reserve policy, interest rates, and the future of risk assets.
This development could become an important signal for investors who are closely monitoring the US economy and looking for clues about the next major market move.

📊 **1. Why Is October PPI Important?**

The Producer Price Index measures changes
post-image
BTC-0.67%
ETH-1.26%
USIDX+0.00%
  • 2
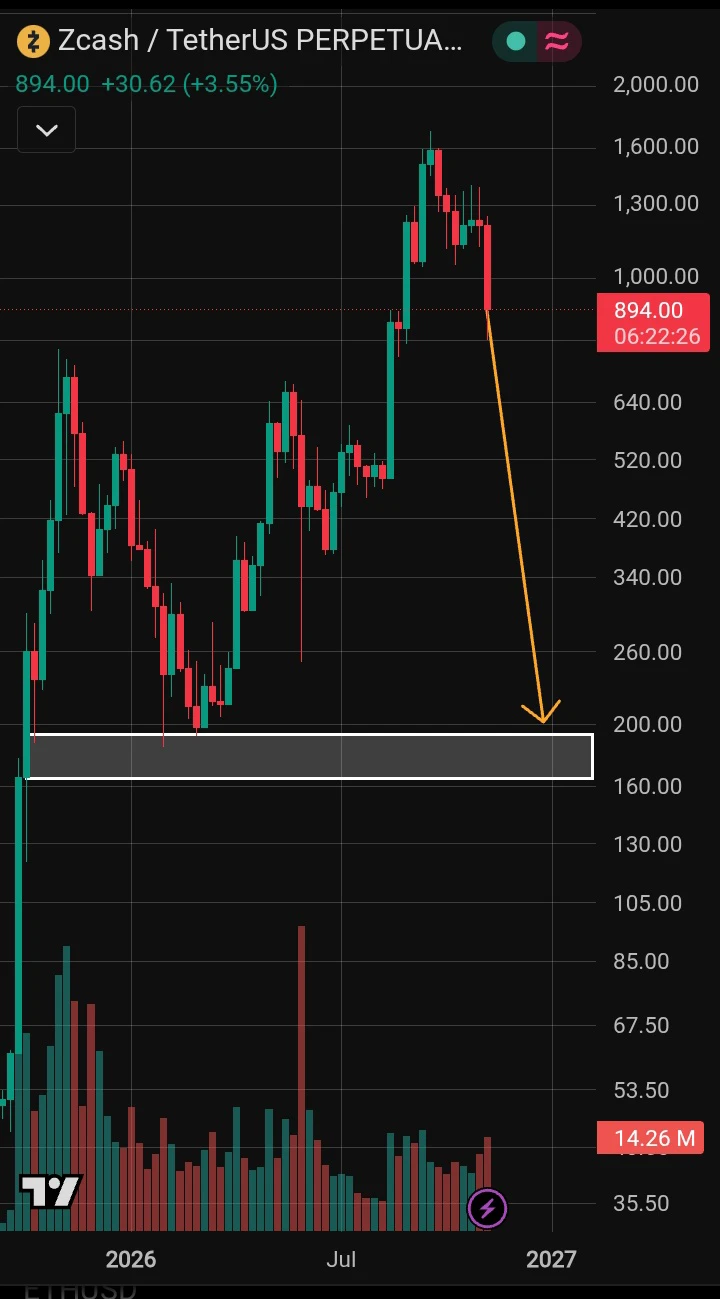
$ZEC /USDT – Bearish Warning ⚠️

$ZEC is showing a strong rejection after its massive rally toward the $1,600 region. Price is currently around $894, and the latest candle shows strong selling pressure.

My chart observation:

* Resistance: $1,200–$1,300

* Major high: Around $1,600

* Current price: $894

* Long-term demand zone: $160–$195

The chart suggests a possible deeper correction, but the $200 area is a long-term projection, not a confirmed immediate target. Price would need to lose intermediate support levels first.

My opinion: I would avoid rushing into LONG positions until buyers
post-image
ZEC+1.29%
On the 4-hour chart, short around 191 $TAO . Sellers need to hold this level, or I’ll exit. Price is approaching 191. I want it to push higher, leave an upper wick, and close below 191. If it breaks above 194 convincingly, I’ll abandon this trade. The 4-hour chart is at 190, still below the 50 EMA at 211, so sellers remain in control of the trend. The daily chart is below the 200 EMA at 243, confirming this on the higher timeframe as well. 🔴 Short · Entry 189.8–190.5 · Take profit 187.6 / 185.9 / 183.4 · Stop loss above 194.4 This is not investment advice; manage your position size accordingl
post-image
TAO+0.41%
$SHELL Up 23% in 24 hours to 0.0325, with 74M in trading volume—that kind of volume isn’t something retail traders can generate. No official announcement has appeared on-chain, so it’s most likely market makers pushing the price up alongside liquidations of short positions. This bullish candle from 0.0243 to 0.0339 erased two weeks of losses—a classic short squeeze setup. Chasing longs now offers a terrible risk-reward ratio: 0.034 is a dense overhead hedging zone near the previous high, while 0.028 is the cost-basis midpoint for this rally. It only counts as a real breakout if the pullback ho
SHELL-2.16%
  • 2
  • 2
Load More

Join 40 M users in our growing community

⚡️ Join 40 M users in the crypto craze discussion

💬 Engage with your favorite top creators

👍 See what interests you

Trending Topics

GateIPOAccessAnthropic

363K Views2.8K Discussing

Gate IPO Access Phase 3 features Anthropic (ANT), with USDT subscription interest starting from 100 USDT. Successful allocations will be delivered as real shares to Gate Stock Accounts. Indicative price: $70–$78/share Subscription: Nov 12–17 (UTC+8) Allocation is not guaranteed. Please manage risk accordingly.

Dr.HanOxfordUnionSpeech

152.5K Views517 Discussing

USOctoberPPIBelowExpectations

487.2K Views1.5K Discussing

View More