Square
Following
Hot
News
Notifications
Profile
Share your thoughts
placeholder
Article
🛢️ Venezuelan Oil Returns to Spain: What It Means for the Dollar and P2P
Venezuela became Spain’s eighth-largest crude oil supplier, with a cumulative 17 million barrels through August—about 2,320,000 metric tons—the largest flow in two decades and ahead of Saudi Arabia. This is the highest volume since 2006, when Spanish refineries were configured to process heavy Venezuelan crude and these shipments were routine.
The shift comes as crude oil prices are under upward pressure and the energy business is being reshaped following the change in administration in Caracas early this year.
🔹 The ha
post-image
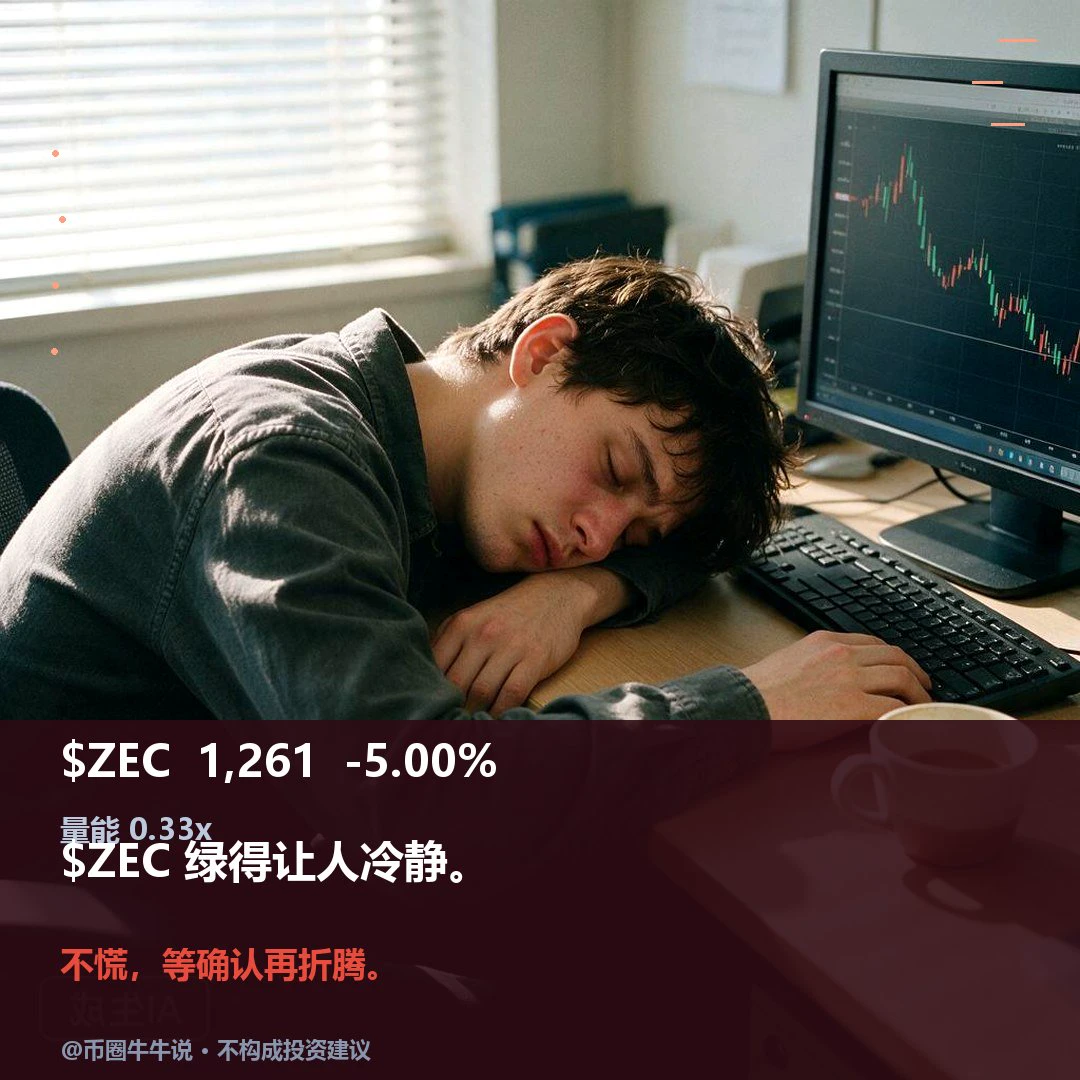
$ZEC Currently at 1260.59, 24H -5.00% (range: 1250.67–1364.08). 1H is weak, with an RSI of 23.48; price is below the EMA20 at 1288.01, and the volume ratio is 0.33. 4H is weak, with an RSI of 54.41; price is below the EMA20 at 1284.31, with support at 1159.00 and resistance at 1387.89. A sustained move above the 1364.08 resistance could indicate continuation; a break below the 1250.67 support would weaken the structure. On review, confirm whether price holds above 1364.08 and reclaims 1250.67; volume is only 0.33x. A hold without volume or failure to reclaim after a breakdown invalidates the s
post-image
ZEC+1.16%
Trenches
ZIG
Z
bade
b
ZIG
0x8c...1145
Market Cap
$.
Change
.
24h Vol
$.
Holders
.
BTC
B
bade
b
BTC
C5xp...pump
Market Cap
$.
Change
.
24h Vol
$.
Holders
.
STONK
S
bade
b
STONK
6GmA...UNgx
Market Cap
$.
Change
.
24h Vol
$.
Holders
.
José
J
bade
b
José
87CQ...1UJT
Market Cap
$.
Change
.
24h Vol
$.
Holders
.
IDOL
I
bade
b
IDOL
0x3b...ab07
Market Cap
$.
Change
.
24h Vol
$.
Holders
.
I just entered a short (sell) trade on $SWARMS
Stop loss: 0.00779 Take-profit targets: 0.00670 - 0.00665 - 0.00643 Start trading here 👇👇👇👇👇👇
post-image
SWARMS-3.61%
$IDOL I went from being down 40% to recovering my losses this time, all because I didn’t cut my losses at 0.023. Let’s get straight to the point.
Up 36.55% in 24h, currently at 0.0348. It briefly hit 0.0456 before getting dumped back down. Trading volume came in at $400 million—that’s explosive for a small-cap coin. But note that the turnover rate is already absurdly high, which means tokens are changing hands on a massive scale, not that there’s one-way accumulation.
On fundamentals, I’ve looked through IDOL’s contracts. The token’s utility is focused on ecosystem governance and node staking,
IDOL-6.71%
BTC ETH MARKET PREDICTION
live-cover
LIVE66
$ONE and $KOMA have both seen their upward momentum weaken noticeably after a rapid rally, with signs of exhaustion emerging in the market. I personally think a pullback is likely next, and I’ve already started building short positions.
$ONE futures short plan: Entry at 0.00240, first target at 0.00156, with defense at 0.00269.
$KOMA futures short plan: Entry at 0.01648, target at 0.01423, stop-loss at 0.01710.
The above is only a personal trading idea and does not constitute investment advice. Futures leverage carries extremely high risk, so please manage your position carefully.
post-image
KOMA-3.91%
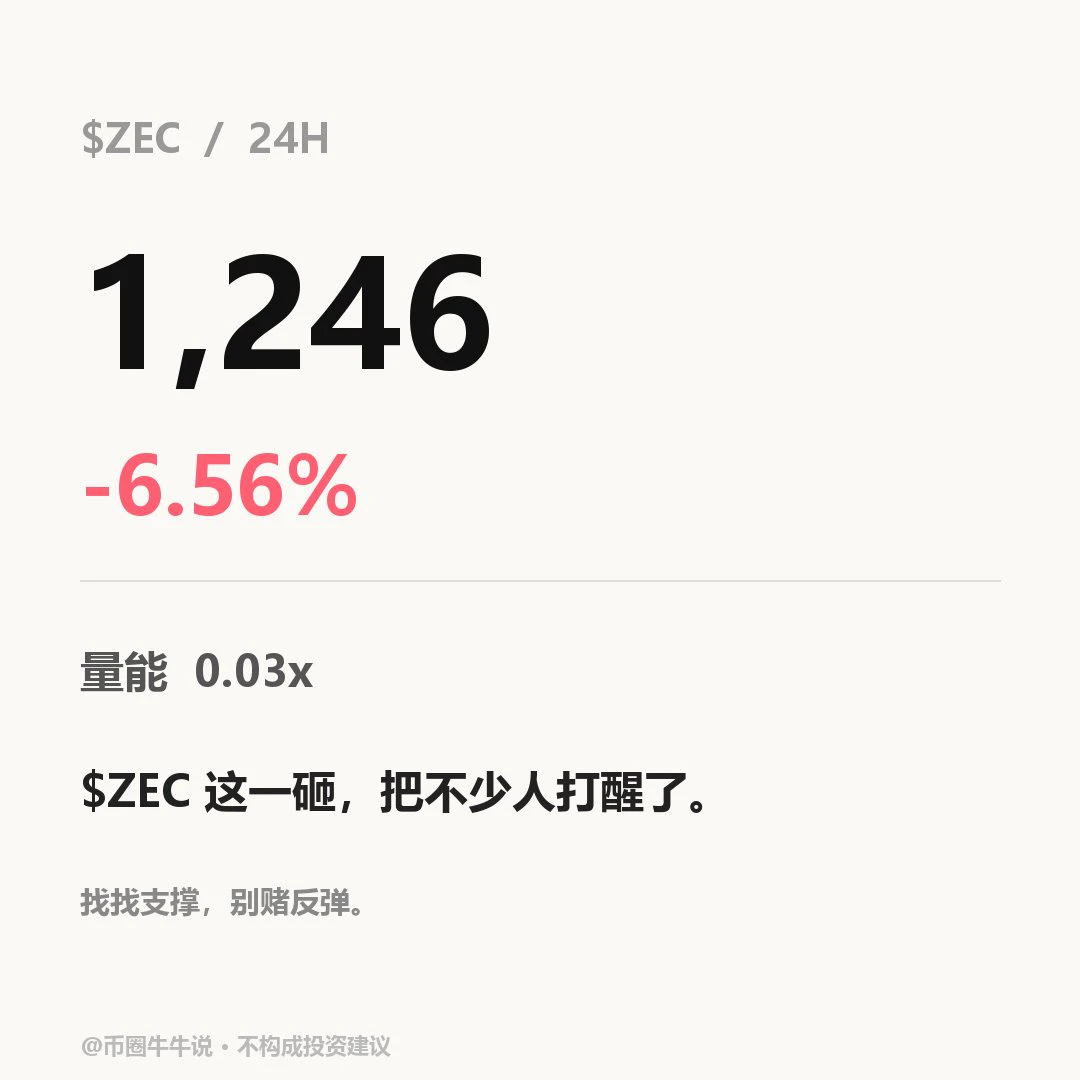
$ZEC Currently at 1246.5, down 6.56% over 24H (range: 1242.05–1364.08). The 1H trend is weak, with RSI at 12.56, price below the EMA20 at 1282.85, and a volume ratio of 0.03. The 4H trend is weak, with RSI at 51.52, price below the EMA20 at 1282.90, support at 1159.00, and resistance at 1387.89. If price moves above and holds the 1364.08 resistance, it can be monitored; a break below the 1242.05 support would weaken the structure. Review whether price holds above 1364.08 and reclaims 1242.05; volume is only 0.03x. A low-volume hold above resistance, or a break below support without a subsequen
post-image
ZEC+1.16%
The Stellar Development Foundation says $5B in tokenized real-world assets are now live on Stellar.
CEO Denelle Dixon:
"$5B is a huge number, and it's just a pit stop."
@StellarOrg @DenelleDixon
XLM-0.64%
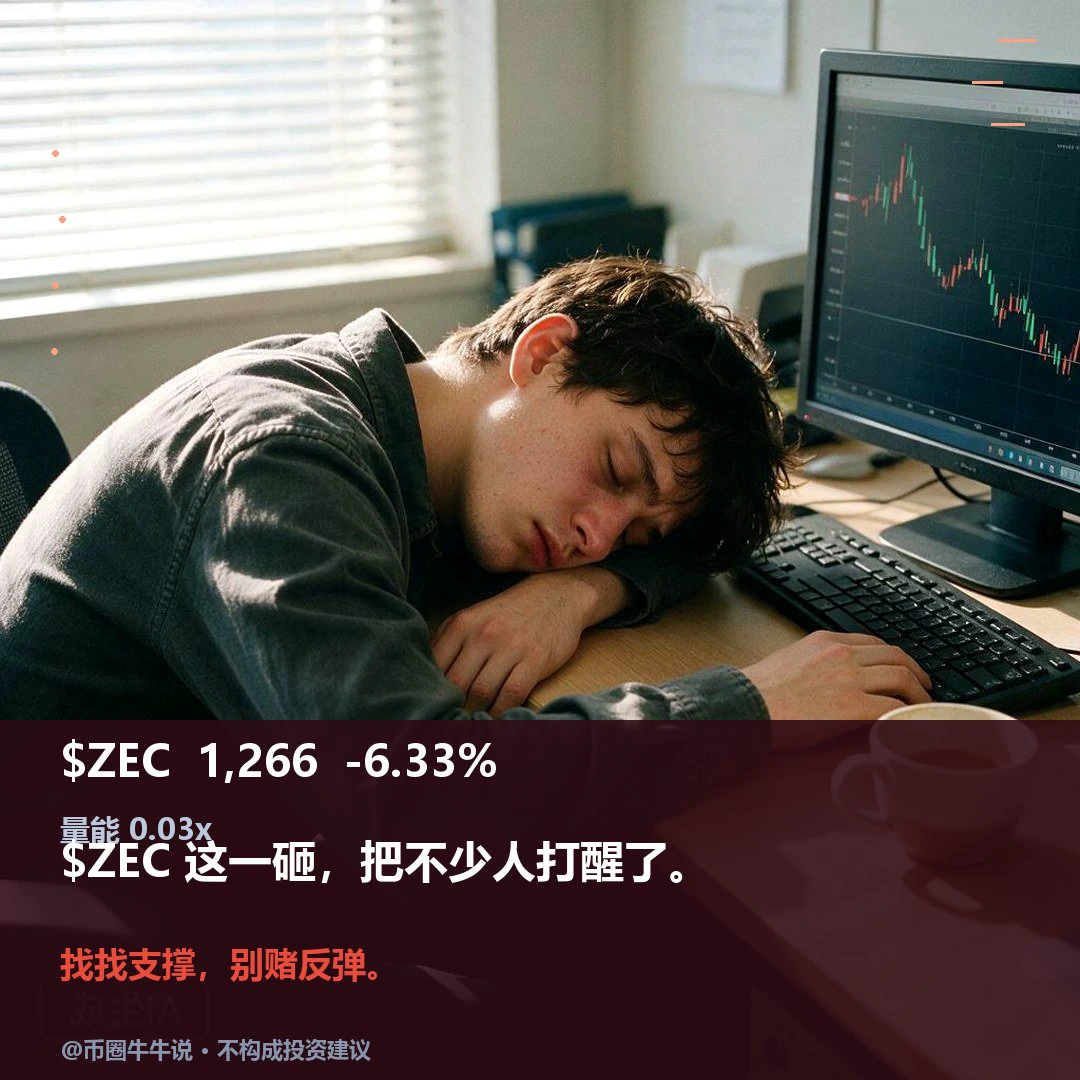
$ZEC Currently trading at 1265.91, down 6.33% over 24H (range: 1250.67–1364.08). The 1H trend is weak, with RSI at 24.79, price below the EMA20 at 1288.50, and a volume ratio of 0.03. The 4H trend is weak, with RSI at 55.38, price below the EMA20 at 1284.75, support at 1159.00, and resistance at 1387.89. A sustained move above resistance at 1364.08 could signal continuation; a break below support at 1250.67 would weaken the structure. Review whether 1364.08 holds and 1250.67 is reclaimed; volume is only 0.03x. A low-volume hold or a breakdown without a subsequent reclaim invalidates the setup.
post-image
ZEC+1.16%
Crypto Market update
live-cover
LIVE22
#GateSocialAnnualStreamerAndCreatorAwards
🎁 5,000 USDT for grabs! Round 2️⃣ 6️⃣ of Growth Points Draw is ongoing!
Every draw wins! No trading volume required for new users! 🤩

💫 Stay active and earn points every day:
🔹 Square: Post, like, comment — up to 600 pts/day
🔹 Live: Watch, like, comment, share streams — up to 300 pts/day
🔹 Chat: Join discussions — up to 90 pts/day
🔹 Creators: Post designated token/trading card content — up to 300 pts/task

Unlock SPCX tokens, a Gate tri-fold keyboard, and exclusive vouchers!

$BTC $ETH $TSLA
post-image
SPCX+0.78%
BTC-0.67%
ETH-1.26%
TSLA+4.26%
  • 3
  • 1
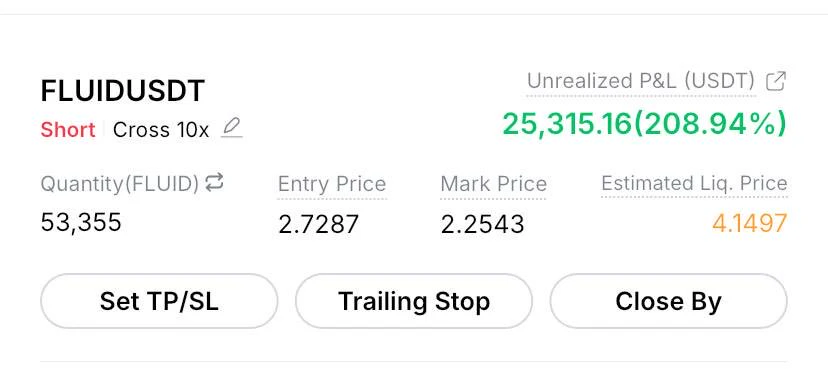
$FLUID approaching target now
Join our telegram channel for live trades
post-image
FLUID-1.92%
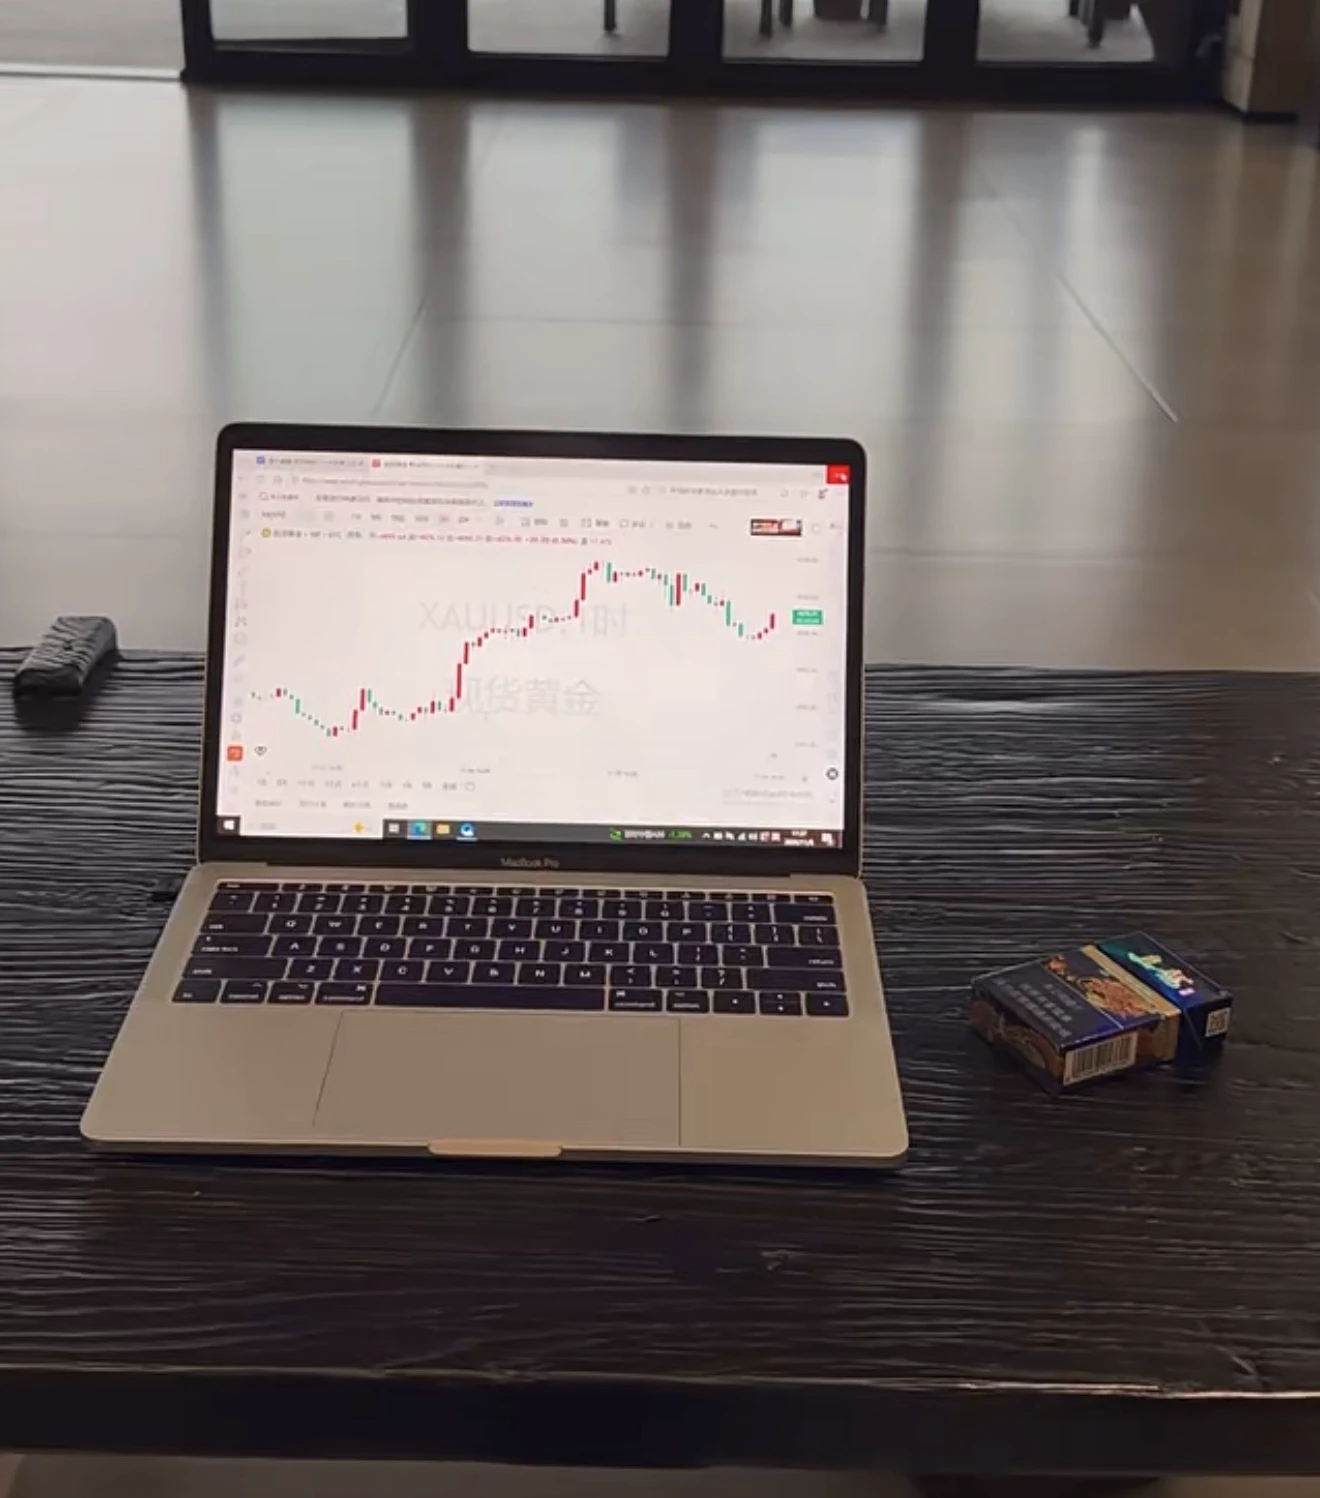
Naked candlestick trading is not “ignoring indicators”; it’s trusting price itself. 1. Naked candlestick trading looks at only four things: Structure: Are highs and lows moving higher (uptrend) or lower (downtrend)? Location: Is price at support or resistance? If it’s in the middle of a range, stay out. Momentum: Candle body size, wick length, and continuity. Confirmation: After a signal appears, does the next candle confirm it? 2. First, recognize three single-candle patterns. Large body (almost no wicks): one side has won decisively; trade in the direction of the move. Long lower wick (hamme
post-image
BTC-0.65%
ETH-1.23%
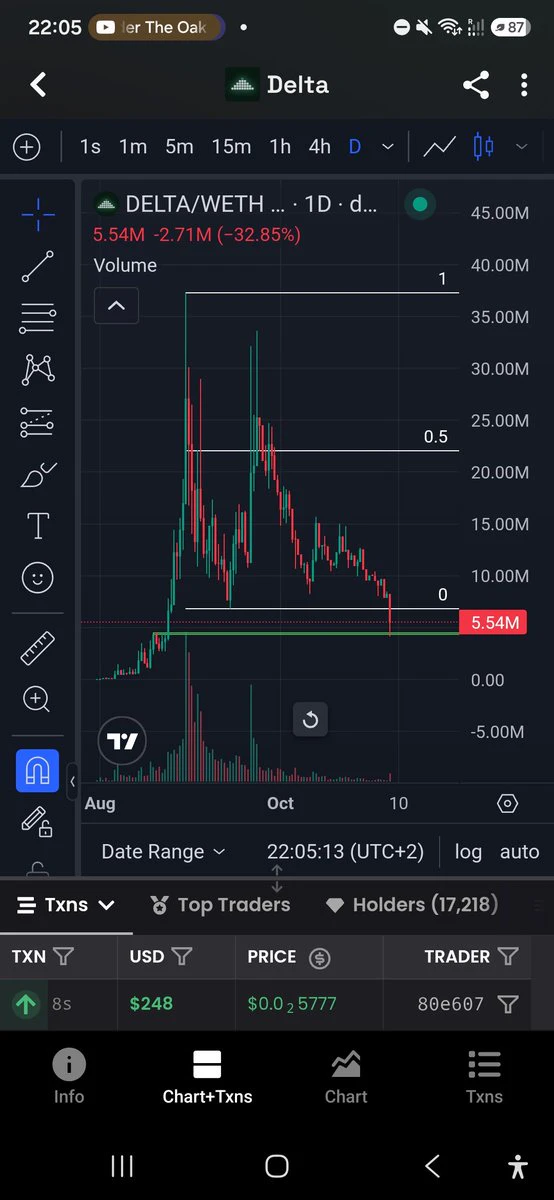
Bought $DELTA @deltaliquidity here on the capitulation/FUD
post-image
Axiym, which ran the rails for Hyundai Card's stablecoin pilot, moved a record $529M in stablecoin payments on Avalanche in Q3, 4.4 times a year earlier.
That is more than $5.7M a day.
@avax
AVAX-0.10%
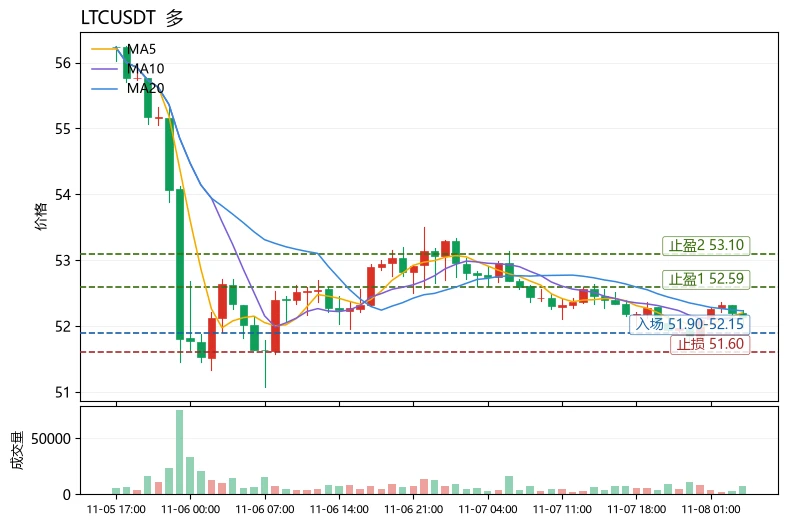
$LTC Current price: 52.14. The first resistance above is the Bollinger upper band at 52.59, and support below is the Bollinger lower band at 51.87. These two levels are where bulls and bears are currently locked in a short-term battle. Why give the price levels before explaining the logic? Because the first step in reading a chart is always to establish your bearings, not to predict.

Using LTC as an example, here's a reusable way to assess trend health: moving averages show direction, MACD shows momentum, and RSI shows positioning. A healthy trend requires all three to align. Currently, MA5=5
post-image
LTC-0.09%
PEPE+0.97%
The Nightmare of Every Trader!
post-image
  • 2
$ONE Now at 0.0024, up 44.64% in 24 hours, touching a high of 0.0025 and a low of 0.0016—from the bottom, it surged directly over 50%, with trading volume hitting $575 million. Retail investors couldn’t have driven this kind of volume; clearly, money is sweeping up tokens. Looking at the chart, there’s support on pullbacks in the 0.0021–0.0022 range, while 0.0025 is short-term resistance; a breakout needs to be backed by volume. As for trading, chasing at the current price is risky. Wait for a pullback near 0.0021 to try a small long position, set a stop-loss below 0.0019, and take profit at t
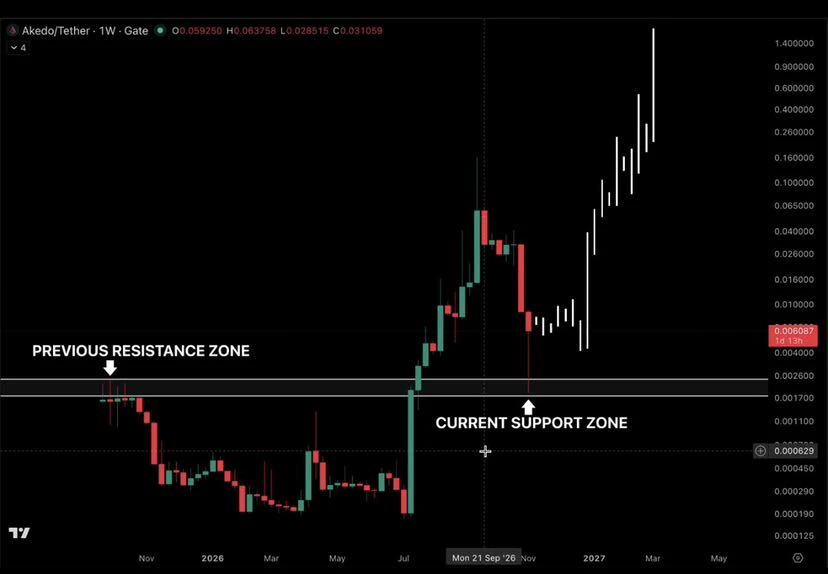
$AKE went from sitting in the basement to making a serious move

Now it's testing the same zone that previously capped its upside

This is where the chart gets interesting

Either the breakout gets validated, or the market reminds everyone that not every green candle deserves a victory lap

Waiting for some green candles here
post-image
AKE+6.07%
Load More

Join 40 M users in our growing community

⚡️ Join 40 M users in the crypto craze discussion

💬 Engage with your favorite top creators

👍 See what interests you

Trending Topics

USAIStocksHitHard

21.24k Views3.67k Discussing

U.S. stocks sold off sharply on Thursday, November 5 (UTC). The Nasdaq closed down around 5.5%, entering correction territory, while the Philadelphia Semiconductor Index plunged roughly 12%, with chip stocks including $NVDA and $AMD posting steep losses. Beyond profit-taking, investors are growing concerned about the pace of AI data center construction, capital spending, and future returns on investment. The key question now is whether the AI sector’s lofty growth expectations need to be repriced. Where do you think the next opportunities will emerge: chip stocks, tech giants, or other sectors?

USNonfarmPayrolls

34.98k Views4.34k Discussing

StakeOnLaunchpoolToShare450KVLX

10.25k Views828 Discussing

View More