Square
Following
Hot
News
Notifications
Profile
Share your thoughts
placeholder
Article
$NVDA ‌
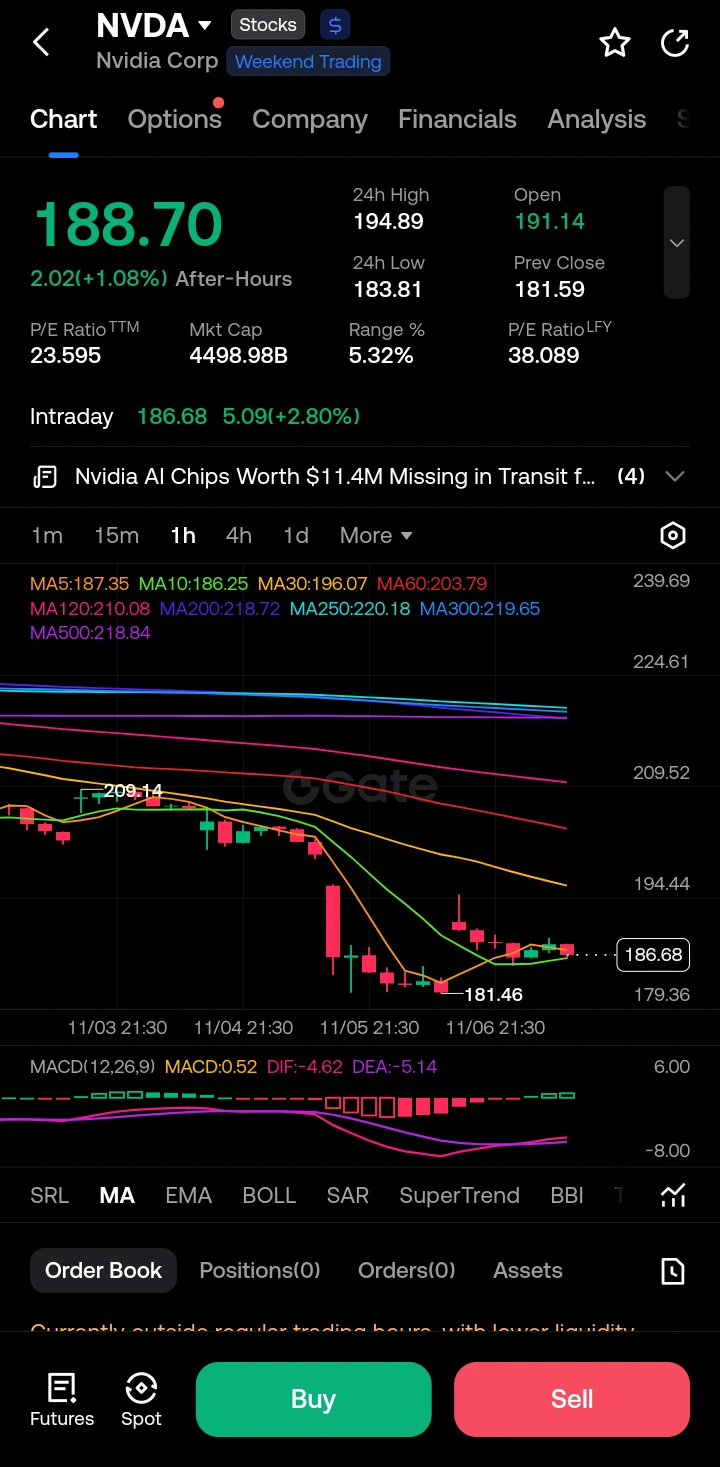
Looking at the 1-hour chart, NVDA has just recovered from a sharp drop down to the 181.46 level, forming a short-term rounded bottom. Price is currently consolidating near 186.68 (Intraday), but it remains capped below key moving averages (MA30 at 196.07, MA60 at 203.79). The MACD is showing a bullish convergence, with the MACD line crossing above the signal line and the histogram turning green, suggesting short-term upward momentum is building, though the overall trend remains weak.

Trading Plan:

I am looking for a quick momentum continuation trade to the upside. My entry point is
post-image
NVDA+2.80%
Although it was overcast yesterday, Jiuzhaigou was still beautiful. It snowed there after we got back, so we were pretty lucky.
post-image
Trenches
ZIG
Z
bade
b
ZIG
0x8c...1145
Market Cap
$.
Change
.
24h Vol
$.
Holders
.
STONK
S
bade
b
STONK
6GmA...UNgx
Market Cap
$.
Change
.
24h Vol
$.
Holders
.
IDOL
I
bade
b
IDOL
0x3b...ab07
Market Cap
$.
Change
.
24h Vol
$.
Holders
.
CLAUDIA
C
bade
b
CLAUDIA
2j5S...W2ZM
Market Cap
$.
Change
.
24h Vol
$.
Holders
.
MAGGIE
M
bade
b
MAGGIE
8rHo...PmZV
Market Cap
$.
Change
.
24h Vol
$.
Holders
.
Is your GPT okay?

$OPENAI ‌
OPENAI-0.03%
Tornado Cash-Funded Wallet Builds $26M Bitcoin-Ether Trade
A wallet converted 3,100 ETH into roughly 6.92 million USDC before pairing a Bitcoin long with an Ether short on Hyperliquid.
⚠️ Personal market analysis only. NFA — manage risk and DYOR.
Educational content, not investment advice or a recommendation to buy, sell, deposit, or withdraw any asset. No paid promotion or referral/affiliate links.
post-image
BTC-0.65%
ETH-1.26%
USDC+0.01%
$AVAX Bullish outlook: On the 4-hour chart, the price is stuck in the 8.130–8.139 range, and I’d wait here for buyers to step in.

The key pivot is 8.13—as long as this level isn’t decisively broken, watch 8.19 and 8.23 as the next targets; if the price falls below 8.08, the entire long thesis is invalidated, and there’s no reason to stay in the trade.
A few supporting reasons: - The 1-hour RSI has fallen to 37, with short-term momentum largely spent, leaving room for a technical bounce; - BTC is leaning toward a short-term rebound, and sentiment could provide correlated support for AVAX; - Th
post-image
AVAX-0.10%
BTC-0.67%
GM Phantoms 👻
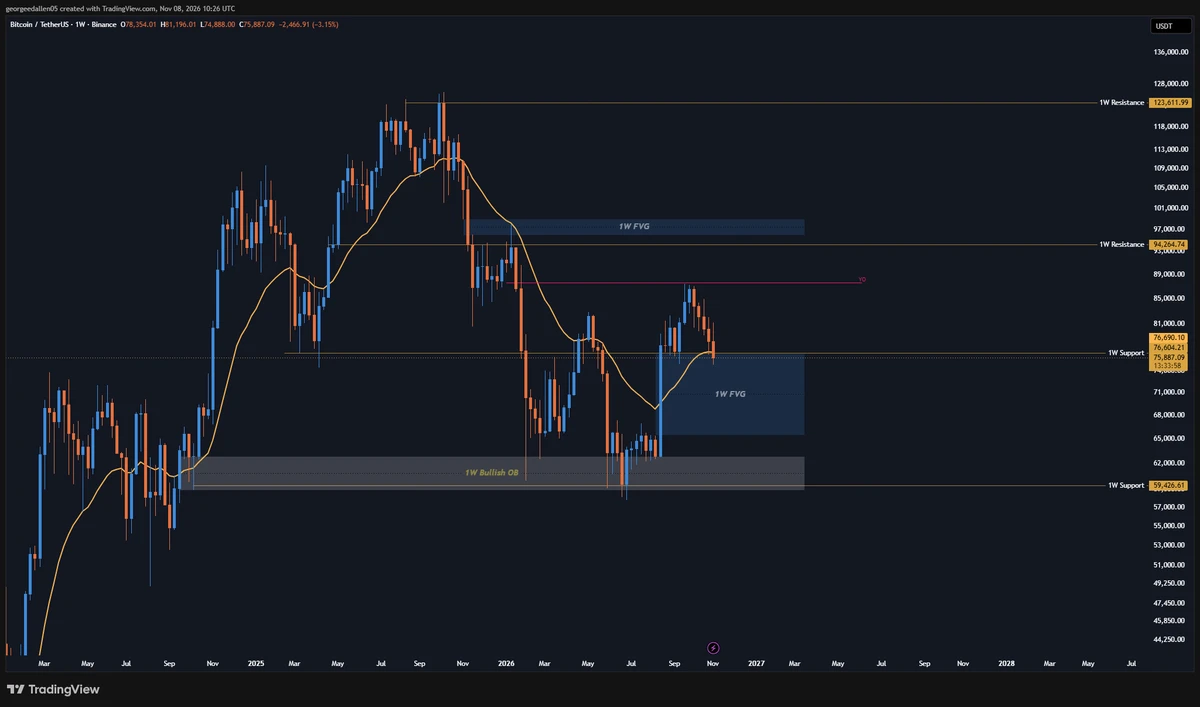
Weekly Close is today.
Will bitcoin:native cook and hold the 76.7k 1W 21ema/ Support zone?
If we can close above 76.7k I believe the mega bearish sentiment going around CT isn't necessary yet but, a close below will skew that prediction.
Keep your eyes peeled tonight! 👀
post-image
BTC-0.67%
Bitcoin peaked over 13 months ago.
The 2017 bear market took roughly 12 months to bottom. The 2021 bear market followed a similar timeline. Yet Bitcoin is currently only around ~39% below its previous high, compared with 77%+ declines in those cycles.
Are we seeing a maturing market or simply delaying the inevitable?
post-image
BTC-0.67%
Last Tuesday, I bet on 74.5K, but it missed by 400
This week’s low was only 74.9K
I said I’d sell NEAR at 4.1, but it only got as high as 4.076
Both just barely missed
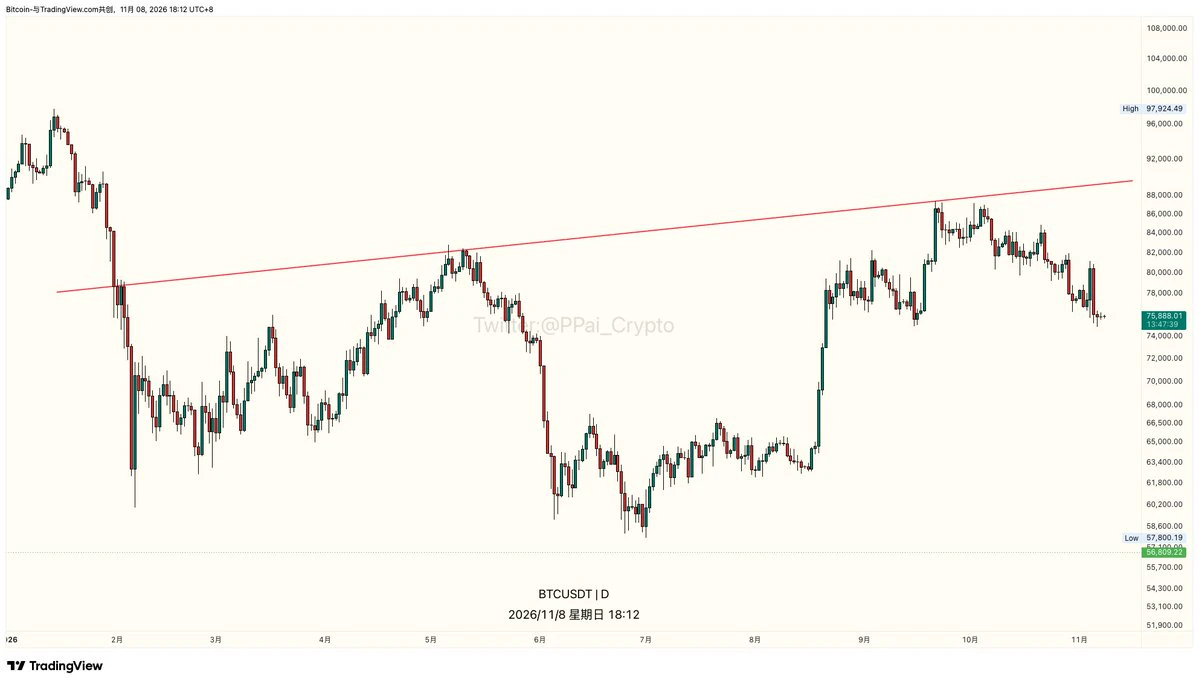
BTC closed red again this week—the fifth red candle in a row
It slid all the way from 81.2K to 74.9K, then closed at 75.9K
The batch I bought at 4.0 is now at 3.71
I haven’t sold a single coin
Of the 40 trading pairs with over 5 million in volume, 22 are still falling
ZEC fell 4.6 yesterday
It’s flat today
On days like this, nobody wants to make the first move
If it drops below 74.5K next week, I’ll sell it all there.
post-image
BTC-0.67%
ZEC+1.16%
$UNI In my view, setting aside $ZEC and $HYPE , among major coins, it definitely ranks near the top in terms of explosive potential and upside. No fluff today; let's go straight into UNI's medium-term wave structure and upside targets.
First, looking at this move that began on June 5, I personally lean toward it being a five-wave impulse structure:
- Wave 1: June 5 to July 31, price rose from 2.32 to 4.58; - Wave 2: July 31 to August 14, price retraced from 4.58 to 3.17; - Wave 3: August 14 to September 23, price surged from 3.17 to 10.94; - Wave 4: began on September 23 and appears to be nea
post-image
ZEC+1.16%
HYPE+0.24%
$UAI — Short Entry: 0.08170 Take Profit 1: 0.07700 Take Profit 2: 0.07200 Stop Loss: 0.08750 The sharp drop on the daily timeframe has already damaged the bullish structure. Even if a temporary rebound occurs, it may be difficult to reverse the pressure.
post-image
UAI-7.58%
Spend with Gate Card and unlock 11 USDT in cash voucher https://www.gate.com/campaigns/6828?ref=VLARBF1YAG&ref_type=132
post-image
1 January 8 Comprehensive Market Analysis
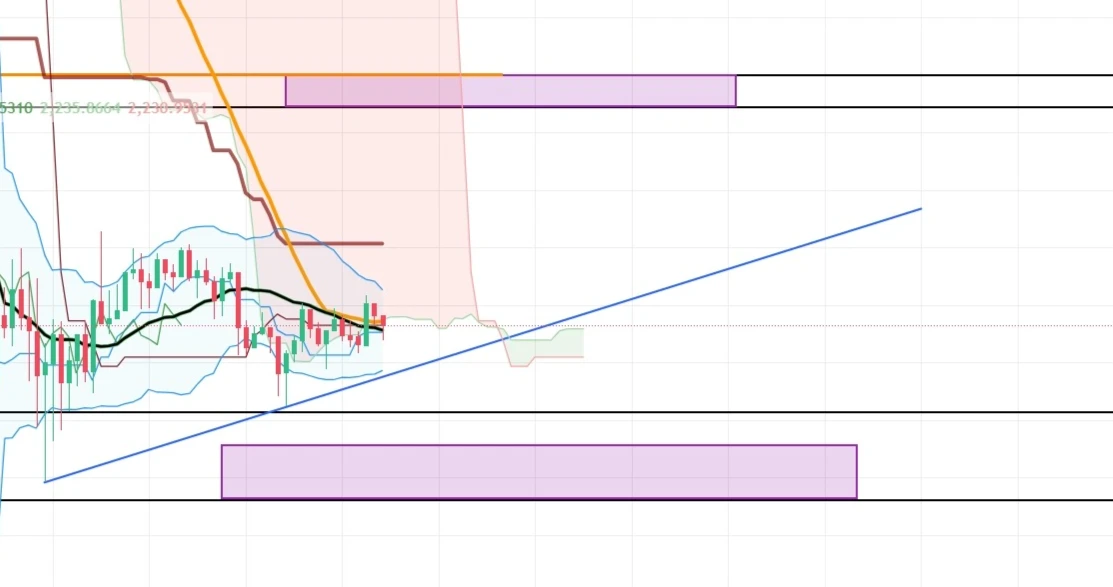
The daily bearish structure remains intact. After a decline, the market is currently in a weak, range-bound recovery, with no confirmed signals of a trend reversal. The medium- and long-term resistance levels overhead are far away and unlikely to be reached in the short term.
The 4-hour chart has formed a converging range, with the Bollinger Bands gradually narrowing and downward momentum easing. The market is entering a phase of consolidation as bulls and bears prepare to choose a direction. The first key resistance zone for this rebound is 2274-2279,
post-image
USDC market update
live-cover
LIVE2,303
🔹 Bitcoin ETFs See $412 Million in Net Outflows, with BlackRock IBIT Seeing $403 Million in Net Out
live-cover
LIVE1,546
Tesla’s 248x P/E: JPMorgan says the earnings inflection won’t come until 2028—are you willing to run the numbers?

Tesla is one of the most discussed stocks on Gate Square, but much of the conversation stays at the level of “Are the cars any good?” or “What did Musk post this time?” Today, let’s look at it from a different angle and run the numbers using an investment bank’s valuation framework.

Even with Tesla delivering 486,500 vehicles in the third quarter, about 5% above market consensus, JPMorgan maintained its Neutral rating and $415 price target. The reason is straightforward: strong d
TSLA+4.26%
Why do many people still lose even more after setting a stop-loss?
In BTC futures trading, many people know the importance of stop-losses and set stop orders after opening a position. But strangely, some traders keep losing even though they have set a stop-loss: the price rebounds right after they exit at a loss; after they re-enter, the price starts falling again. After several rounds of this, not only does their capital dwindle, but their trading mindset also deteriorates.
What exactly is going wrong?
First, the stop-loss is set at an unreasonable level. Some people habitually place it at a
post-image
BTC-0.65%
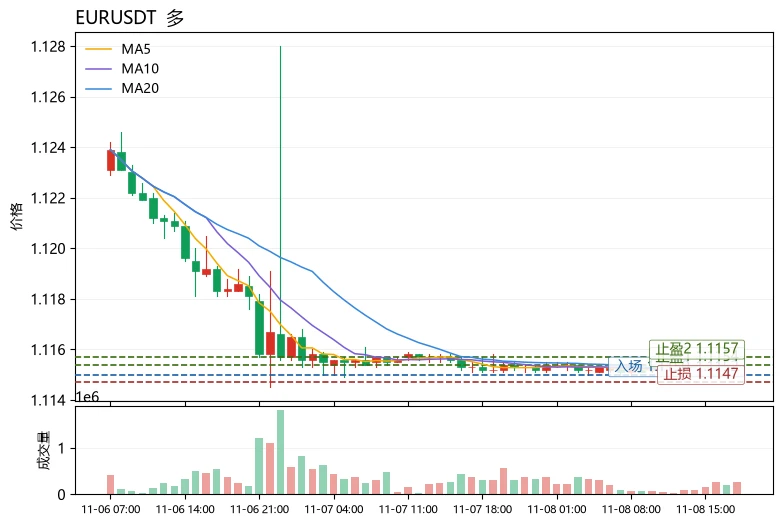
$EUR Current price 1.1152, with resistance at the upper Bollinger Band at 1.11541 and support at the lower Bollinger Band at 1.11506. The 30-candle range is only about 0.07%, compressing price into an extremely narrow band, while funds are clearly sitting on the sidelines ahead of a directional move. In terms of moving averages, MA5=1.11522 is slightly below MA20=1.11523, with the two nearly converged. RSI is just 39, in the relatively weak zone, indicating insufficient bullish momentum; however, the MACD histogram has turned positive (+8.897e-05), while bearish momentum is also fading, leavin
post-image
eur
eureur
Gate.Fun
MC:$5.55KHolders:3
0.06%
ZEC+1.16%
Load More

Join 40 M users in our growing community

⚡️ Join 40 M users in the crypto craze discussion

💬 Engage with your favorite top creators

👍 See what interests you

Trending Topics

USCPIDataIncoming

6.27k Views1.55k Discussing

The U.S. October CPI report will be released on November 10 at 8:30 a.m. ET. September CPI came in at 3.7% year over year, and markets will be watching closely for signs that inflation is cooling, especially in core CPI. A softer-than-expected reading could strengthen rate-cut expectations, while hotter inflation may pressure risk assets through higher Treasury yields and a stronger dollar. How do you think this CPI print will move $BTC, U.S. stocks and gold?

USAIStocksHitHard

26.03k Views3.72k Discussing

USNonfarmPayrolls

47.71k Views4.45k Discussing

View More