Share your thoughts
placeholder
Article
Attributing yesterday’s rally to a news-driven pump? That’s too simplistic. Two weeks beforehand, we had already analyzed this top structure and level, and after Ethereum hit yesterday’s high of 2666, we updated our strategy: short into rallies! Follow and subscribe for more insights into future market movements. #以太坊
ETH+2.44%
  • 1
Since Bitcoin surged to $80,000 in just a few days, the market has actually been moving in a broad range. Today, I’ll summarize the following serious mistakes on gate to ensure I don’t continue making them in future market conditions.
1. Before the consolidation cycle is complete, I always fantasize about low-probability events happening. I fail to distinguish between “probability events” and “random events.” (Even though the high-probability scenario is clearly repeated oscillation between support and resistance, whenever a position I hold has an unrealized profit or loss, I always fantasize
post-image
BTC+0.61%
That 12% bullish candle $MITO almost shook me out again.
Let me review this trade. The night before last, while watching the chart, $MITO had been moving sideways around 0.0124 for nearly two days. The 4-hour MACD bullish divergence had already emerged, and the DIF line had started turning upward. I placed an order at 0.0126 and entered my first position, using 20% of my capital. During the day yesterday, it rose to 0.0132, so I sold half, thinking I could buy back on a pullback. But last night it broke straight through the previous high at 0.0135 on heavy volume, with 24-hour trading volume
MITO+11.18%
$ETH 2510 Go long. Take-profit: 2545–2570. Stop-loss: 2495. Follow me for precise strategies shared daily.
post-image
ETH+2.44%
Time will prove everything I said. I don't want too much gossip.
post-image
10x Leverage vs Spot - Best for Beginners
live-cover
LIVE76
$RIVER Signal】1H bullish continuation + resistance from the 4H Bollinger upper band, buy on pullback
$RIVER The 4H Bollinger upper band at 1.3803 is overhead, while the current price of 1.375 is running along the outer edge of the band. 1H RSI is 73.31, and 4H RSI is 70.54. The 4H MACD histogram at 0.0362 continues to expand, with no sign of bullish momentum exhaustion. The 1H histogram at 0.0188 has begun to contract, indicating slowing upward momentum. The order book buy/sell ratio is 0.86, with depth imbalance at -7.81%, and relatively heavy sell orders above. The funding rate is 0.0050%,
post-image
RIVER+25.97%
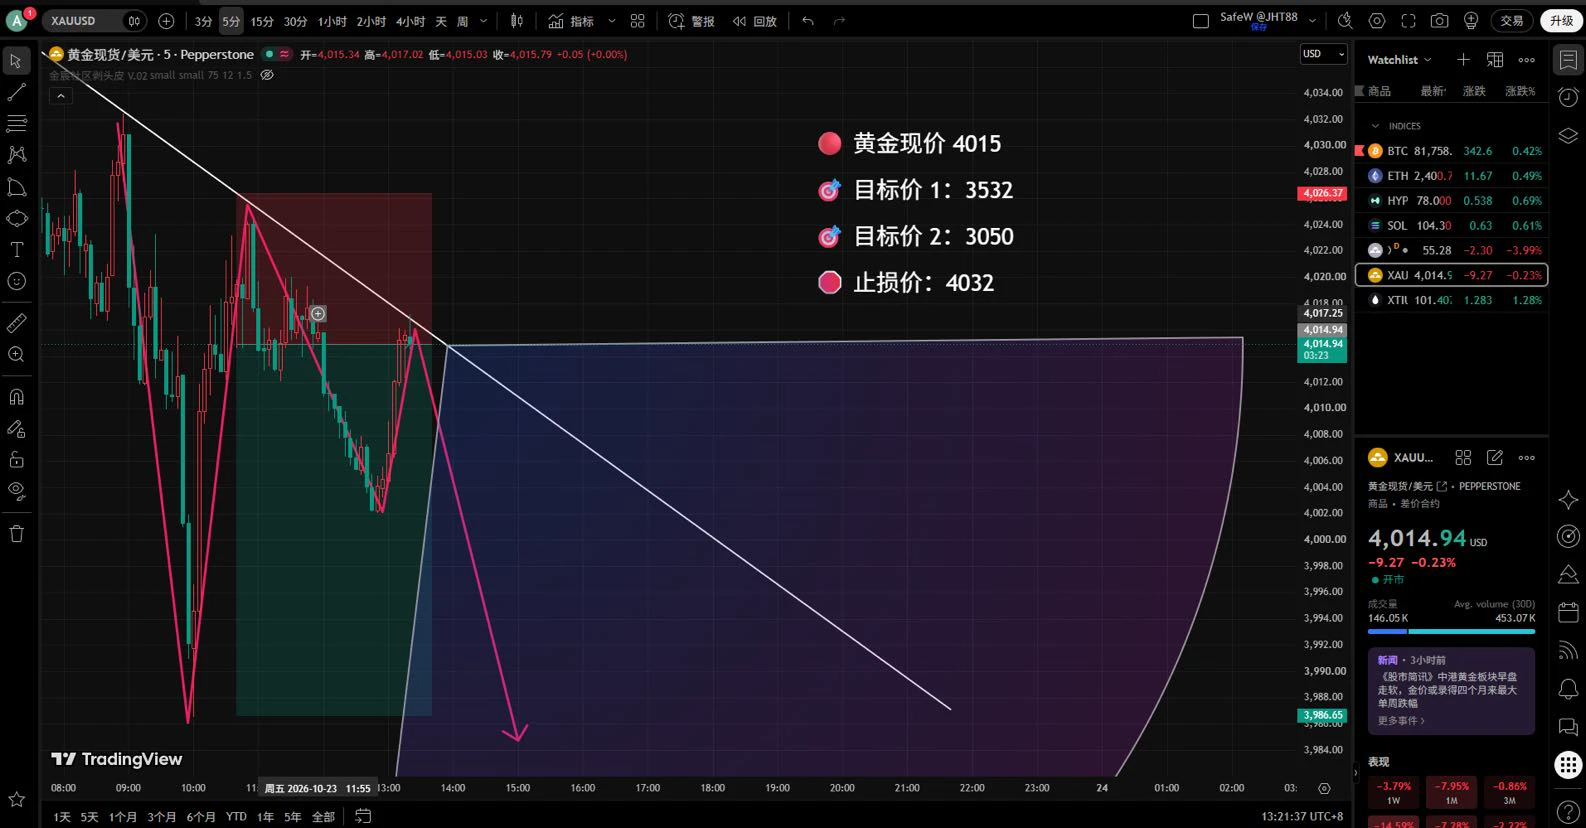
JUST IN: Goldman Sachs sticks with a year-end 2026 gold price forecast of $4,900/oz, citing strong central-bank demand and potential ETF inflows; hedging mechanics could amplify moves, with risks from Fed rate expectations. $XAU USD
post-image
XAU+0.37%
#AugustCoreCPIBeatsExpectations #每周来晒 #8月CPI数据出炉
Where Do I See the Best Trading Opportunities After August CPI?
The latest U.S. CPI report has created a high-volatility environment across crypto, commodities and U.S. equities.
Headline CPI increased 0.4% month over month, while annual inflation remained at 3.4%. Core CPI increased 0.3% month over month and 2.4% year over year. While the annual core trend has improved, the stronger monthly reading has increased uncertainty around the Federal Reserve’s next policy decision.
For me, this is not a market where I want to chase the biggest price m
post-image
Happy weekend. Black Friday was somewhat extreme; on positive data, Dogecoin surged nearly 200 points, rebounding sharply from around 2430 and reaching a high near 2670. It has currently stabilized above 2500 and is moving near the middle band on the hourly chart.
Around 77000–76500, upside; reference: around 77900–78600
Around 2500–2480, upside; reference: around 2530–2560
The above is solely my personal sharing and does not constitute any investment advice.$BTC $ETH
post-image
BTC+0.61%
ETH+2.44%
[Price Trend Analysis]
1. Candlestick Patterns:
- On the 4-hour chart, the candlestick at 20:00 on September 11 was a small-bodied bullish candle, with the closing price near the high, indicating that upward momentum is continuing, although the gains have narrowed.
- On the 1-day chart, the candlestick for September 11 was a huge-volume bullish candle that almost entirely erased the losses from the previous few days, reaching a high of 2666, showing extremely optimistic market sentiment, while the long upper shadow also indicates resistance above.
2. Technical Indicators:
- MACD: On the 4-hour
BTC+0.61%
ETH+2.44%
  • 7
Juts chilling stacking my BTC $pleb
post-image
BTC+0.61%
Everyone is sleeping on LINK while this 95-confidence long quietly cooks.

$LINK /USDT - LONG

Trade Plan:
Entry: 11.482 – 11.560
SL: 11.148
TP1: 11.801
TP2: 11.987
TP3: 12.267

Why this setup?


Debate:
Are we grinding toward TP2 at 11.987 or is 11.765 going to trap us?

⚠️ Personal market analysis only. NFA — manage risk and DYOR.
Educational content, not investment advice or a recommendation to buy, sell, deposit, or withdraw any asset. No paid promotion or referral/affiliate links.
LINK+0.50%
Saturday Weekend Market Analysis📊
Over the past week, we experienced the most news-packed week
1️⃣ Nonfarm payrolls came in far below expectations (9/5)
2️⃣ Liquid Network was hacked (9/7)
3️⃣ PPI exceeded expectations (9/10)
4️⃣ CPI was released (9/11)
5️⃣ Three consecutive SEC announcements + the CLARITY Act (9/11)
6️⃣ Ceasefire signal in the Middle East (the night of 9/11)
7️⃣ An 85% rate hike is now clearly priced in: CME’s probability of a 25bp rate hike in September rose from 69%→85%, with two hikes by year-end fully priced in
‼️This week, when the market started at 81,000 and everyo
  • 1
Nobody is talking about this quiet short setup forming on $WLD /USDT right now.

$WLD /USDT - SHORT

Trade Plan:
Entry: 0.4002 – 0.4042
SL: 0.4217
TP1: 0.3876
TP2: 0.3779
TP3: 0.3632

Why this setup?
Why now? The daily trend is range, which often precedes a sharp directional move once a breakout occurs, and the 1h price sitting at 0.4022 gives a precise reference for a short entry. The 15m RSI at 53.56 shows neutral momentum, meaning the market is not yet overbought and leaves room for a downside push. The 1h ATR of 0.008116 confirms enough volatility to reach the first target of 0.3876 and
WLD+1.12%
Shared from the Gold Medal Training Camp: Mindset Six Lessons, Lesson Four
“Emotional Management and Antifragility”
This week’s market saw explosive pumps and dumps with consecutive V-shaped reversals.
Guess who lost the most?
Not the permabulls or the permabears,
but those who kept chasing back and forth.
Every time, someone thought they were smarter than the market,
and every time, the market taught them a lesson.
“The biggest difference between retail traders and professional traders: retail traders ask, ‘Will it go up tomorrow?’ while professional traders ask, ‘What will I do if it drops?’
Both accounts doubled this week, which is great. We’ll continue next week. Wishing everyone prosperity.
post-image
Have a good day ☀️🌊
post-image
A few days ago I was still thinking about how to exit gracefully, but this morning it sent me straight into short-position profits. When the early-session dump started, $AAOI failed to rebound, with heavy overhead pressure, so I called for a short at 152.22.

Selling pressure was strong, but volume failed to follow through. No one was taking the price higher, so this short trade went smoothly.

Money earned is the monetization of your understanding; money lost is the flaw in your understanding. Have a strategy before the session, discipline during the session, and reflection after the sessi
post-image
AAOI+2.05%
ADA+0.24%
LAB+69.60%
Morning market
live-cover
LIVE66
Load More

Join 40 M users in our growing community

⚡️ Join 40 M users in the crypto craze discussion

💬 Engage with your favorite top creators

👍 See what interests you

View More