Share your thoughts
placeholder
Article
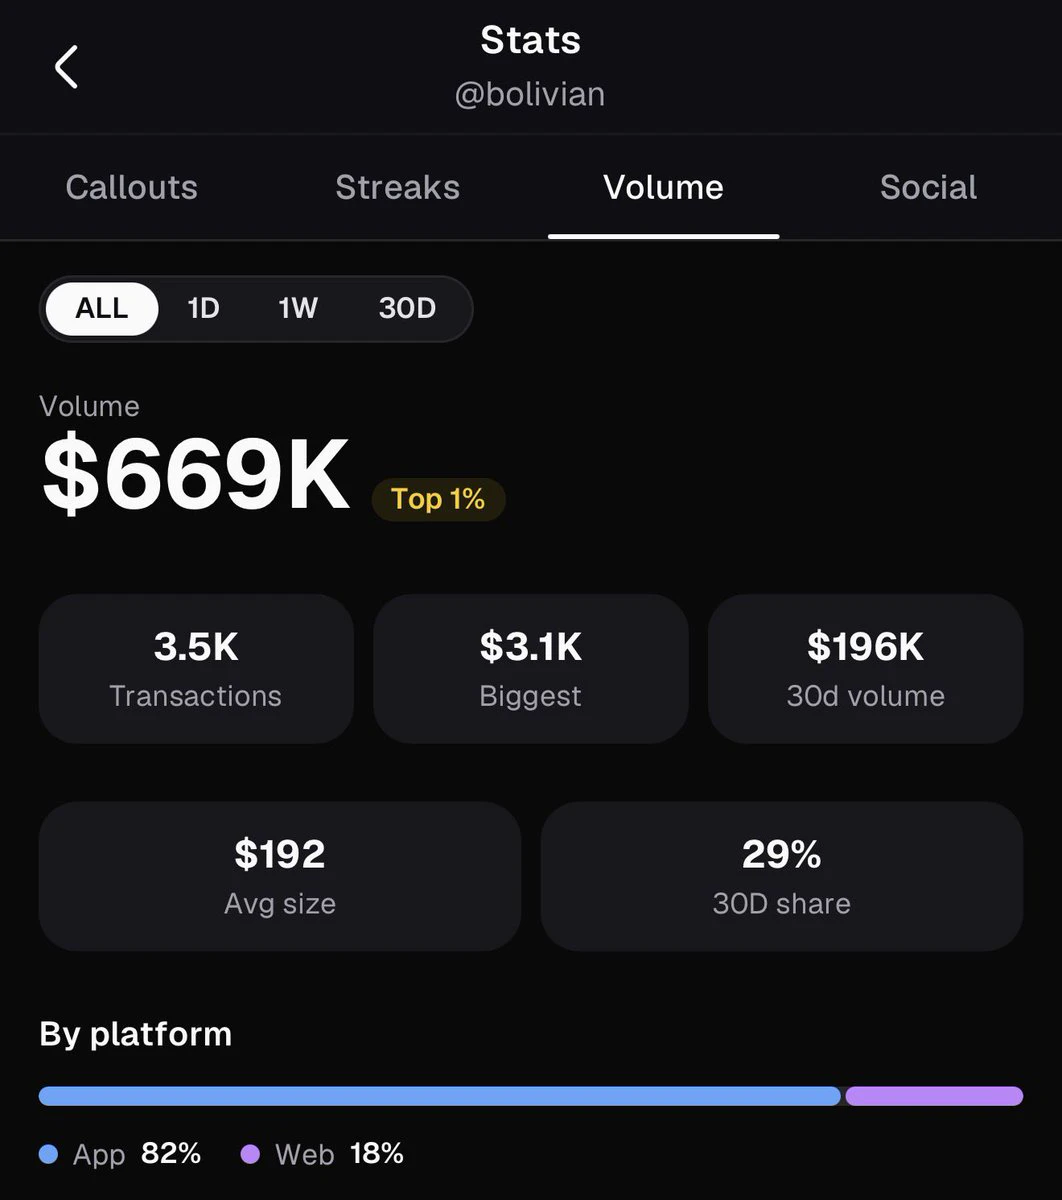
Did a little experiment and made a 2nd @fomo account to see if trading in public as "me" vs "not me" had a difference
Result?
5k to 15k challenge done with basically 1 trade
Time to run it up to 100k then 1m
post-image
GN CT ☀️
I’m celebrating 🤣🤣
Most traders are sleeping on a setup that is about to break $NEAR /USDT wide open.

$NEAR /USDT - LONG

Trade Plan:
Entry: 2.3415 – 2.3603
SL: 2.2606
TP1: 2.4186
TP2: 2.4638
TP3: 2.5316

Why this setup?
Why now? The daily trend is bullish, which means the macro structure is already stacked in favor of buyers. The 1h ATR sits at 0.037636, confirming that volatility is active enough to fuel a clean move rather than a slow grind. The 15m RSI at 44.39 shows the short term is not overbought, leaving room for continuation instead of an immediate reversal. The entry zone of 2.3415 to 2.3603 around
NEAR-2.46%
#SenateReleasesNewCLARITYAct Senate Releases New CLARITY Act: A Major Moment for Crypto Regulation
The U.S. crypto market is entering another important regulatory phase as Senate Republicans have released a revised version of the Digital Asset Market CLARITY Act ahead of a key Senate procedural vote. The latest draft is around 630 pages and introduces additional rules aimed at defining how different digital-asset activities should be regulated.
Why Is the CLARITY Act Important?
The CLARITY Act is designed to create a clearer regulatory framework for digital assets in the United States. One of
BTC+0.12%
  • 3
$KOMA It’s up 30% in 24 hours and is now at 0.0186. Anyone chasing in at this level will most likely end up as exit liquidity.
I’m a disciplined buy-low-sell-high trader. No fluff—here’s the plan.
Current status: 24h low 0.0141, high 0.0190, trading volume 13.6M. After a volume-driven surge, it’s moving sideways at high levels—a typical bullish sentiment-driven market. I’ve seen this pattern too many times: after a sharp pump, it either consolidates before moving higher or wicks down to shake people out. $KOMA It’s currently stuck at 0.0186, just one step away from the previous high of 0.0190,
KOMA+30.28%
$Lobster is striking it rich—doubling in two days.
龙虾+126.22%
Crypto Market Pulls Back Slightly
live-cover
LIVE24
#BonkGuyBullishOnUSELESS Bonk Guy Turns Bullish on USELESS: Is Another Meme Coin Move Coming?
The meme coin market is once again attracting attention as Bonk Guy has reportedly taken a bullish view on USELESS. In a market where sentiment can change rapidly, endorsements from well-known meme-coin personalities can create significant interest and trading activity.
But the bigger question is whether this bullish sentiment can translate into sustained momentum for USELESS.
Why Is USELESS Getting Attention?
Meme coins often move differently from traditional crypto assets. Community engagement, soc
post-image
USELESS+7.28%
  • 3
$FLOCK Signal】Long + 1H pullback order-book support
$FLOCK After touching a high of 0.08619 on 1H, the price pulled back and is currently at 0.0783, sitting at the upper boundary of the entry zone. The 4H MACD histogram at 0.0019 continues to expand, while the 1H histogram at 0.0015 is contracting. RSI: 70.85 on 4H / 67.74 on 1H; order-book bid/ask depth ratio: 1.48; depth imbalance: 19.44%.
🎯 Direction: Long
⚡ Entry/limit order: 0.078065 - 0.078300
🛑 Stop-loss: 0.077517
🚀 Target 1: 0.079475
🚀 Target 2: 0.080062
🛡️Trade management:
- Execution strategy: Reduce the position by 50% upon
post-image
FLOCK+30.18%
BTC+0.12%
ETH+0.20%
SOL-0.30%
#BonkGuyBullishOnUSELESS Bonk Guy Bullish on USELESS
Crypto trader Unipcs, widely known as “Bonk Guy,” remains strongly bullish on Solana-based memecoin USELESS. He recently compared its current market structure with PEPE before its major 2023 rally, pointing to similar trading patterns, early relative strength, expanding open interest and strong market timing.
Bonk Guy has also reportedly accumulated USELESS through a dollar-cost-averaging strategy. Lookonchain reported that he held around 15.9 million tokens, previously valued at about $2.52 million, with an unrealized profit of roughly $1.6
USELESS+7.28%
Which one has the best community?
#memecoins
I switched to the background to reply to a message, and when I came back, it had already finished the job.
While everyone was still watching, $CYS lacked buying support, the rebound was weak, and heavy resistance held overhead. I judged it was time to short from the highs, so I placed the short order first.
Shorted from 1.3889 to 0.1393, +1771.22%—that feels amazing. I can afford a good meal now. Staying alive is the prerequisite for compounding; the shortcut to getting rich is often going to zero.
Take 80% off first, +1771.22%, with the cost basis protected. Let profits run if it continues f
post-image
CYS-11.40%
BNB+0.28%
LAB-15.07%
I did nothing—just went to the restroom, and when I came back, the candlesticks had already done the work for me. While everyone else was running, I actually laughed as I watched the chart. A sell-off on no volume, while buying support was becoming increasingly obvious and capital was quietly entering—the rhythm was all too familiar to me. $ETH pulled back to 2473.40, and I immediately shouted: Go long, don’t hesitate. Now at 2523, +348.75%—I timed this move so well I almost want to applaud myself. Those who got on board should have woken up smiling; the sleepless nights were worth it. Don’t
post-image
ETH+0.24%
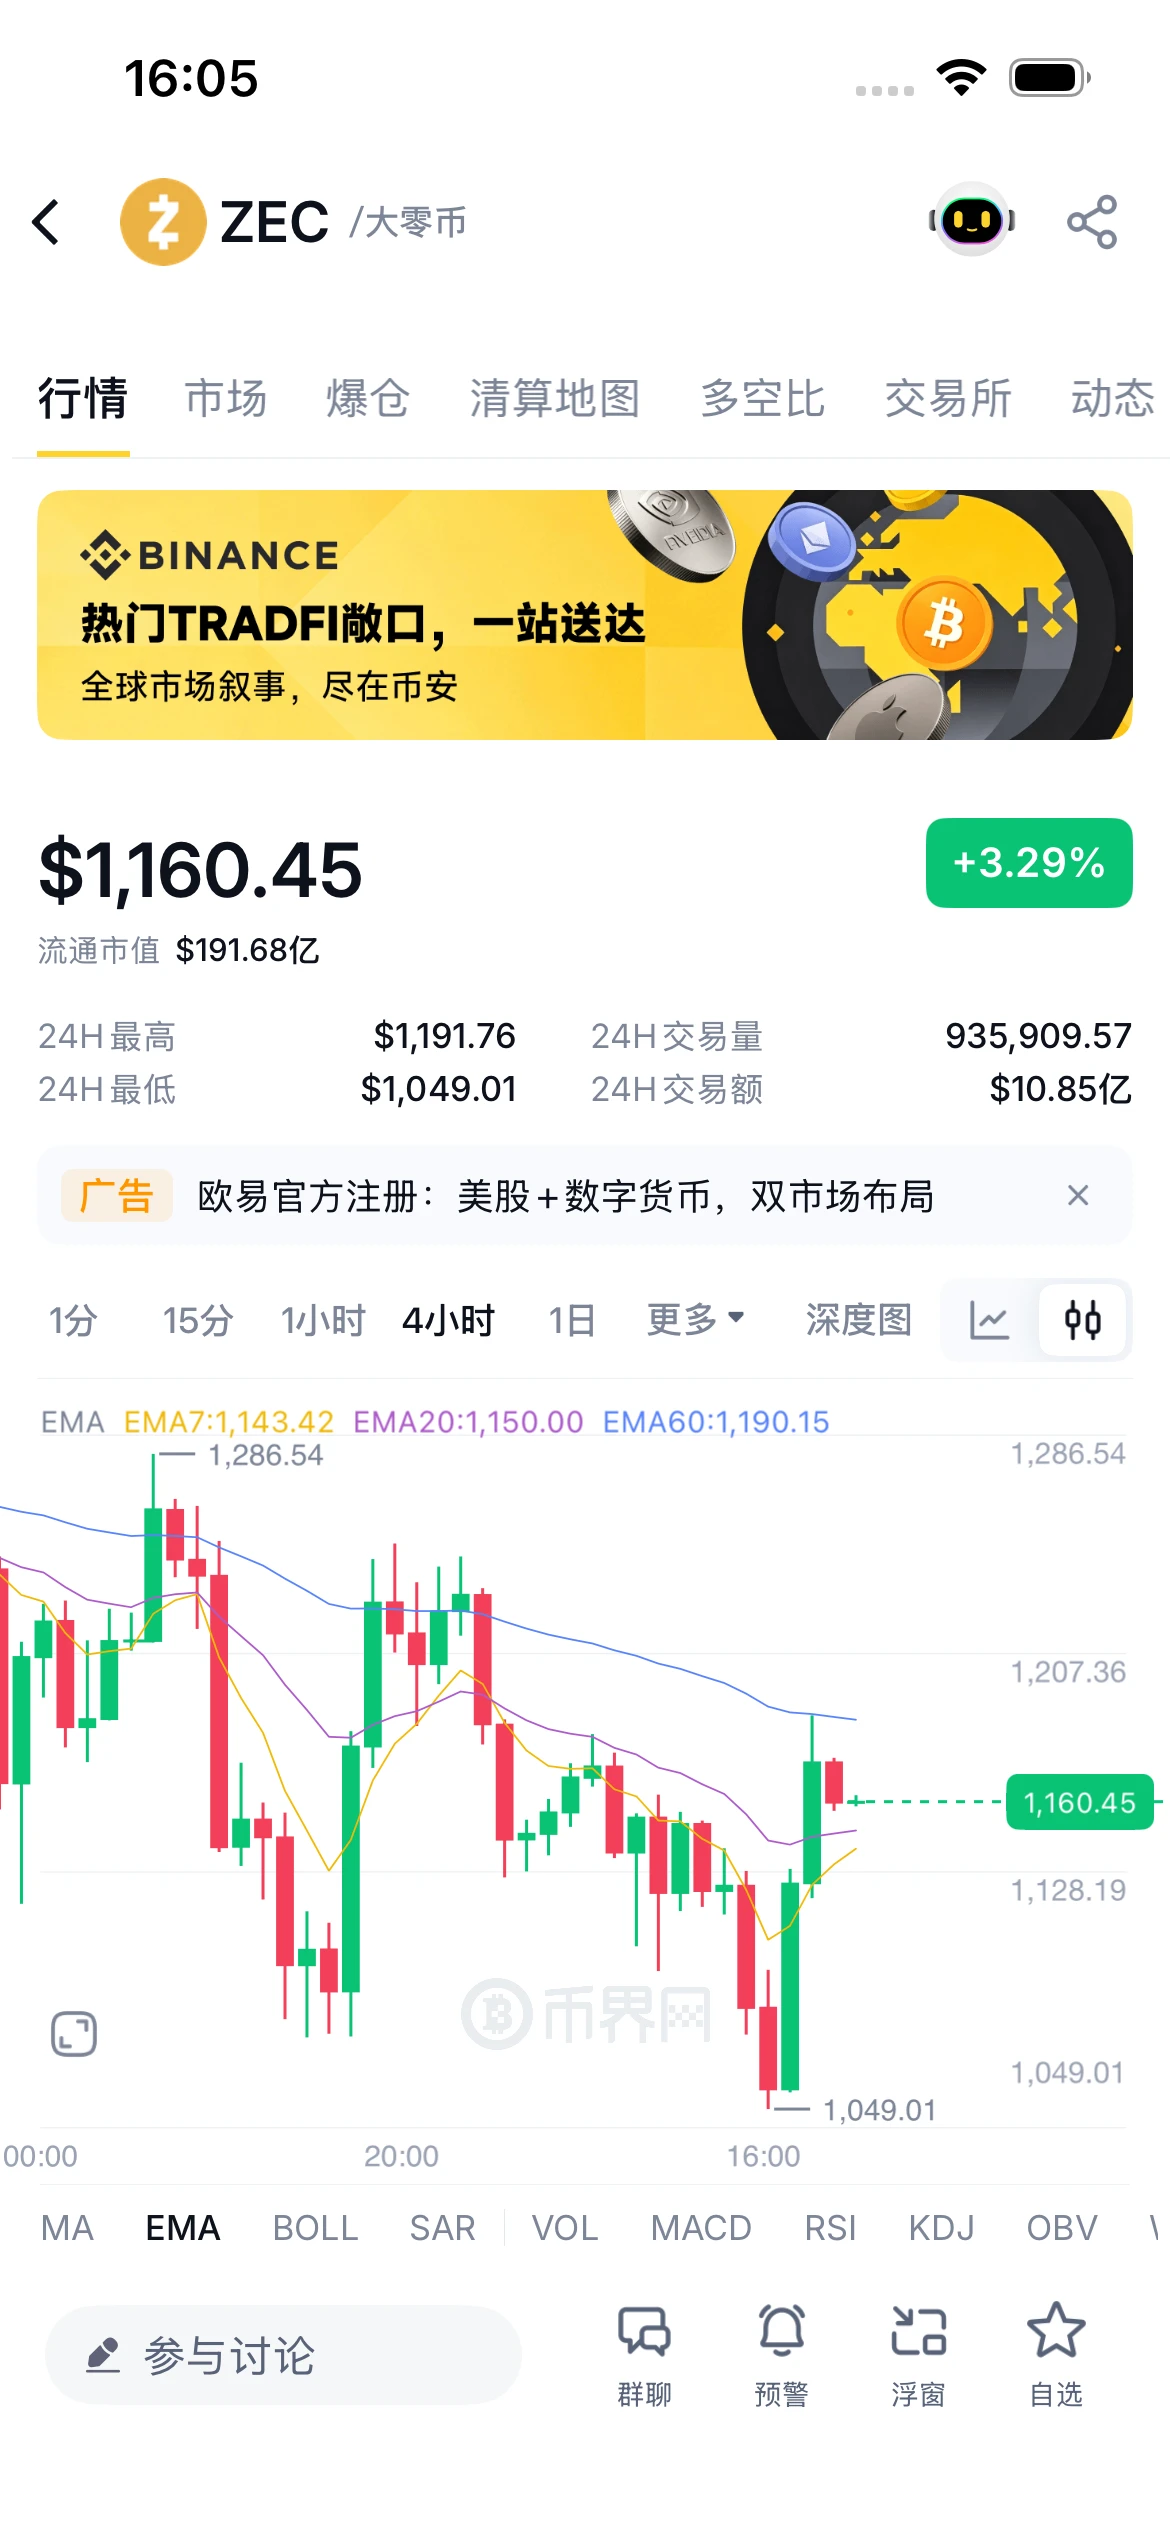
ZEC-3.17%
BNB+0.28%
CRYPTO THINGS YOU MAY HAVE MISSED — LAST 24 HOURS | 12 SEPTEMBER 2026
Institutions just rotated sharply from $BTC into $ETH—and the weekly totals expose a much bigger divergence.
🧵👇
1/2 — $ETH ETF DEMAND SURGED
Friday’s completed US session recorded:
🟢 Spot $ETH ETFs: $216.4M inflow
🔻 Spot $BTC ETFs: $13.2M outflow
BlackRock’s ETHA attracted $148.8M alone.
One session does not confirm a lasting rotation—but the weekly totals strengthen the signal. Bitcoin flows | Ethereum flows
2/2 — THE WEEKLY DIVERGENCE IS EVEN BIGGER
Across the shortened trading week:
🔻 $BTC ETFs: approximately $462.7M
post-image
BTC+0.22%
ETH+3.17%
BLK+1.62%
HBAR+0.68%
XLM+1.27%
Most traders will miss this setup hiding in plain sight on HYPE.

$HYPE /USDT - LONG

Trade Plan:
Entry: 79.451 – 79.777
SL: 78.054
TP1: 80.784
TP2: 81.565
TP3: 82.735

Why this setup?
Why now? The daily trend is bullish and the 1h price sits at 79.614, which is the exact entry_ref we are watching. The 15m RSI at 41.51 shows room to run before overbought, while the 1h ATR of 0.650167 tells us volatility is tight enough for a clean move. The entry zone between 79.451 and 79.777 aligns with that low RSI, giving us a defined risk window before targeting TP1 at 80.784 and TP2 at 81.565. The lin
HYPE+0.64%
I only went to the restroom, and by the time I came back, the candlestick chart had already wiped out my losses for me. A few days ago in the afternoon.

I saw $SCRT being pushed up without the volume following, with heavy resistance overhead. Each rebound was weaker than the last, so I warned at the time that it was under pressure at the highs and not to rush into the trade.

Opened a short at 0.02694 and pressed it all the way down to 0.00867, locking in +1663%. That was a satisfying bite.

The market is won by waiting, and profits are made by holding. Close 80% first, and protect the re
post-image
SCRT+1.05%
ADA+0.98%
SNDK-0.22%
Everyone is missing the obvious short setup forming right now in SYMBOL

$XRP /USDT - SHORT

Trade Plan:
Entry: 1.3618 – 1.3654
SL: 1.3812
TP1: 1.3504
TP2: 1.3416
TP3: 1.3285

Why this setup?
Why now? The 1h price is sitting at 1.3637 inside a tight range on the daily trend, and the 15m RSI at 45.73 signals bearish momentum without being overbought. The 1h ATR of 0.007322 confirms the market is active enough to move but not so volatile that entries get wipped out. The entry zone between 1.3618 and 1.3654 gives a precise trigger, with TP1 at 1.3504 and TP2 at 1.3416 offering stacked targets
XRP+0.86%
$我踏马来了 Signal】Long + 1H support/4H bullish histogram contraction
$我踏马来了 4H MACD bullish histogram contracting, 1H bearish histogram expanding; after spiking to 0.01556 and retreating, the price settled at 0.01493. Order-book depth imbalance -9.53%, buy/sell ratio 0.83, with heavier selling pressure; 1H RSI 56, 4H RSI 67.75, momentum remains intact, but room to chase is limited. OI is stable, funding rate 0.0050%, with no obvious signs of excessive leverage. Catch the wick around 0.0148952-0.0149400; the structure remains above the 4H EMA20 at 0.0131, and 0.0147906 is the short-term defense li
post-image
BTC+0.12%
ETH+0.20%
SOL-0.30%
Why is everyone still sleeping on a short setup that just refused to break 96.01?

$CL /USDT - SHORT

Trade Plan:
Entry: 95.81 – 96.01
SL: 96.86
TP1: 95.19
TP2: 94.72
TP3: 94.00

Why this setup?
Why now? The 1h price is parked at 95.91 inside a tight entry zone between 95.81 and 96.01, and the 1h ATR of 0.397866 tells us volatility is compressed enough for a clean move. The 15m RSI at 57.38 shows the market is neither overbought nor oversold, giving us room to run toward TP1 at 95.19 before extending to TP2 at 94.72. Because the daily trend is a range, mean reversion favors the short side,
CL-0.60%
Gate.io 60M Users - Why Its Growing
live-cover
LIVE22
Load More

Join 40 M users in our growing community

⚡️ Join 40 M users in the crypto craze discussion

💬 Engage with your favorite top creators

👍 See what interests you