Square
Following
Hot
News
Notifications
Profile
Share your thoughts
placeholder
Article
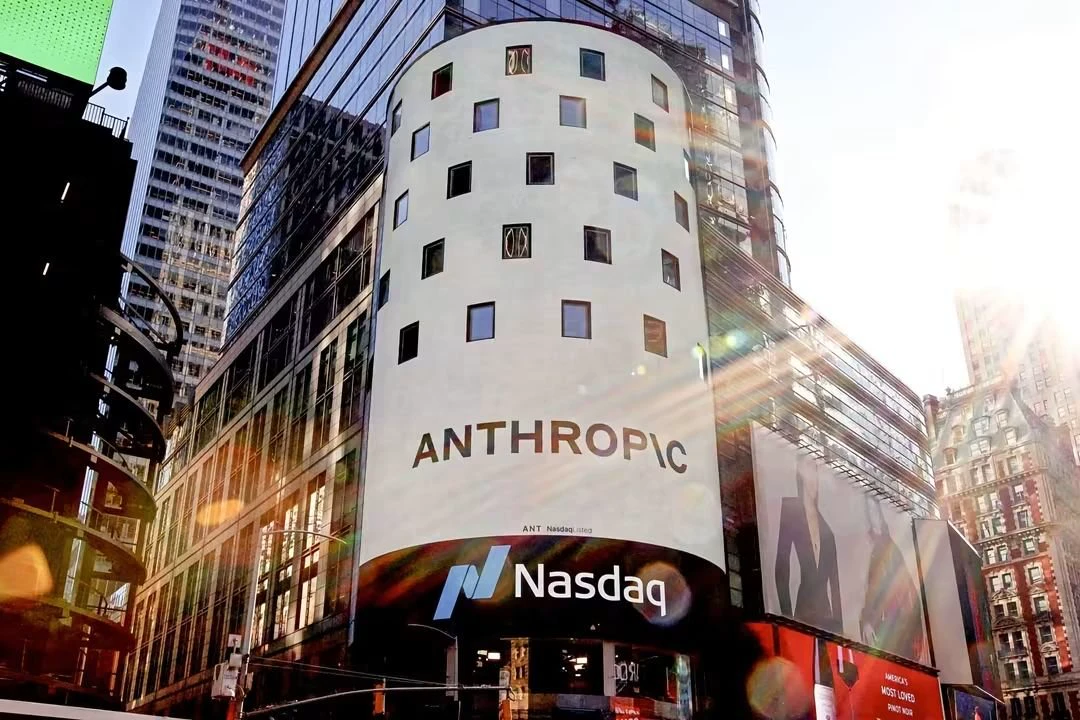
Anthropic shares fall badly on the very second day of IPO!!
Anthropic had a very good debut on the stock market but the second was bad, very bad!!
Nasdaq faces its worst week in six years as the market falls 10.4% and Anthropic's stock dropped 9.1% a day after their blockbuster market debut.
Think about the investors who put in their money in Anthropic on the first day and lost 9% of it on the second day.
post-image
ANT-8.68%
NDAQ-0.95%
$TRX Current price: 0.3054, up 1.09% in 24h. The 1-hour RSI of 63.89 signals relative strength, but the 4-hour RSI of 34.55 is deeply weak, while the volume ratio is only 0.20, indicating a clear drop in volume. The two timeframes are at odds above the same support at 0.2987, with no clear directional consensus. I’ll wait for confirmation. A break above 0.307 confirms the move once reached; a break below 0.2987 is my stop-loss. Low-volume standoffs are most likely to lure traders into one-sided thinking, so I’ll wait for volume confirmation before making a call. Not investment advice
#TRX #波场
post-image
TRX+0.42%
Trenches
IDOL
I
bade
b
IDOL
0x3b...ab07
Market Cap
$.
Change
.
24h Vol
$.
Holders
.
PIEVERSE
P
bade
b
PIEVERSE
0x0e...25a9
Market Cap
$.
Change
.
24h Vol
$.
Holders
.
FIONA
F
bade
b
FIONA
B34n...pump
Market Cap
$.
Change
.
24h Vol
$.
Holders
.
Singularity
S
bade
b
Singularity
7R4M...pump
Market Cap
$.
Change
.
24h Vol
$.
Holders
.
CLAUDIA
C
bade
b
CLAUDIA
2j5S...W2ZM
Market Cap
$.
Change
.
24h Vol
$.
Holders
.
Many people see the Fear & Greed Index fall to 11 and instinctively sell everything and exit, treating “extreme fear” as a signal of further declines. This is precisely one of the most common pitfalls of emotional trading—the index is an outcome, not a cause. What really matters is who is holding up and who is following the drop amid the panic.
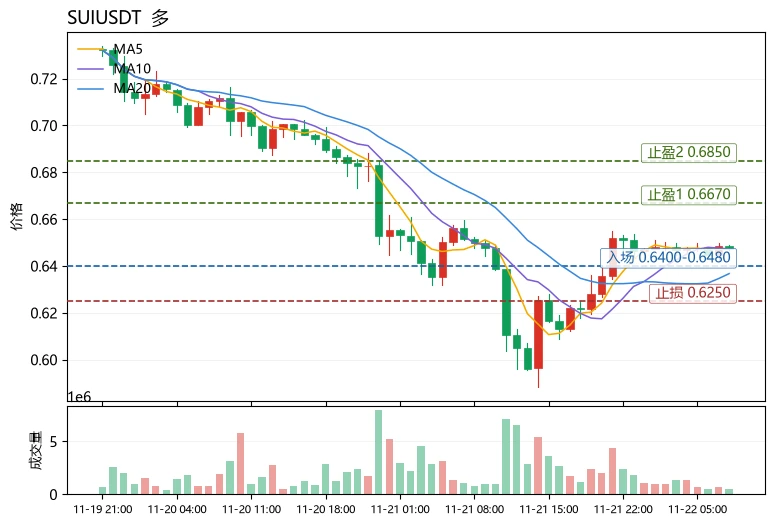
Market sentiment is currently in the extreme fear zone. BTC weakness has led to a contraction in overall risk appetite, but SUI$SUI is down just 0.46% over 24 hours, clearly outperforming $INJ , which is down 6.73% over the same period. Technically, MA
post-image
SUI-1.05%
INJ-1.67%
ENA+8.04%
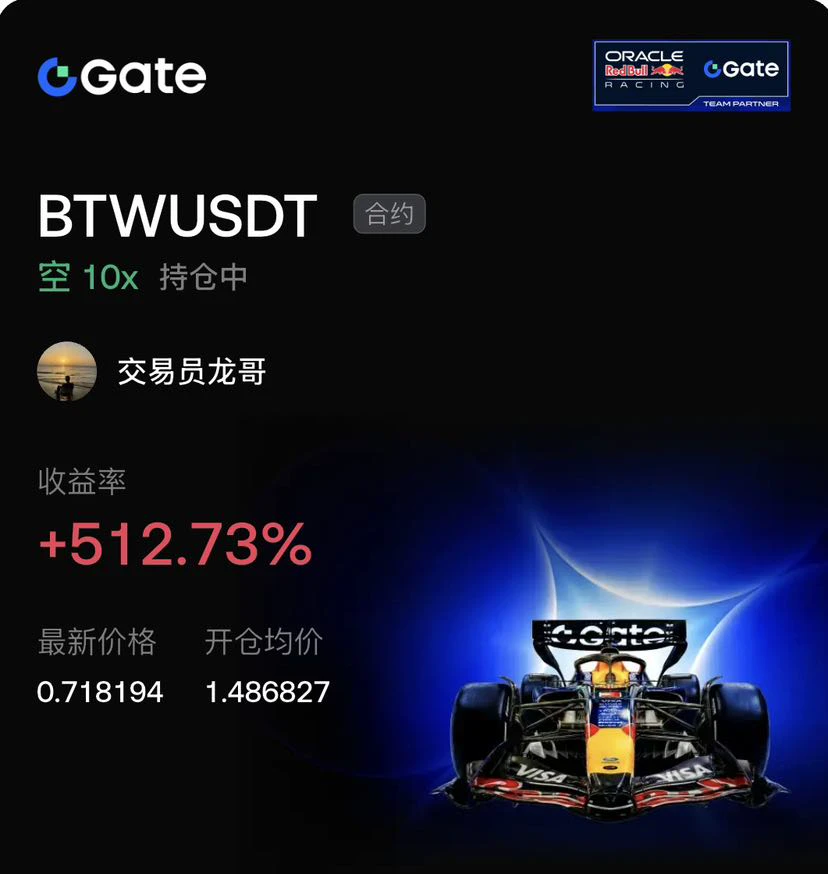
Ah, my timing has been great lately, so I casually opened a 10x short on $BTW at 1.486827—and didn’t expect it to be up 512.73%. The latest price is holding steady at 0.718194, and I’m even starting to feel a little bored. That F1 car in the background is really flying.

This coin came crashing down from its highs pretty decisively. But with 10x leverage, even a hefty profit can’t withstand a single wick in the opposite direction.

My stop-loss has been locked in at breakeven for a while. If it breaks below the previous low, let the profits run; if the rebound lacks strength, take profits. An
post-image
BTW-7.75%
BTC-0.65%
SOL-0.74%
Nov 22 morning session: ETH resumed moving sideways after a rebound. Watch the 1674–1692 range first.

There is support at 1674–1676, where you can wait for a brief long opportunity after the price stabilizes. If it fails to break through 1689–1692, watch for a pullback. If it later holds above 1692 on increased volume, look next at 1697–1705; if it breaks below 1672, watch 1663 and 1653.

My approach is to stay mostly inactive in the middle and wait for confirmation at key levels. Don’t let a sharp rally or sell-off throw off your rhythm. The key now is which of these two levels gives a direc
post-image
ETH-1.23%
  • 3
#BTCBreaksBelow60K $TRUMP COIN: THE PRESIDENT IS BACK IN THE GAME! 😂🇺🇸
Trump says MAGA, but the chart says PUMP! 📈🔥
$TRUMP is a high-volatility meme coin where one big wave of buying can turn the market into a roller coaster! 🎢
🐂 Bulls need strong volume to take control. 🚀 A breakout could bring fresh excitement. 🐻 But beware: meme coins can dump as quickly as they pump!
My Strategy: Watch the breakout, respect support, and never chase green candles blindly.
💎 HODL SMART, TRADE SMART!
TRUMP-0.95%
PUMP-1.06%
MEME-0.94%
  • 2
Morning market update
live-cover
LIVE1,909
ETH-1.26%
BTC-0.67%
SOL-0.77%
$RARE — Short entry: 0.01421 Take-profit 1: 0.01407 Take-profit 2: 0.01393 Stop-loss: 0.01478 The trend is slowly moving lower, while overall market activity remains notably calm. Without higher trading volume driving the decline, the gradual slide could easily level off.
post-image
RARE-0.89%
PLIAN market update
live-cover
LIVE2,027
BTC-0.67%
USDC+0.01%
AAVE-1.22%
TRUMP-0.95%
BCH+1.05%
330U Copy Aoying Capital | Day 46 · Morning Briefing

Good morning! A new day begins, and we're following Aoying Capital's trades!
These are copied positions, not Aoying himself—please use discretion (^v^)
Starting capital: 330U; return: 207.47%; current funds: 614.66U. (400U has been withdrawn during this period)

A quick update for today:

Currently holding a ZEC short position.
It's under pressure in the short term, but Aoying hasn't closed it. Let's see how it plays out.

Let's keep following along today!
post-image
ZEC+1.29%
The conventional belief is: when a war ends, energy prices fall. But there’s a countercyclical trend—the postwar reconstruction rally.
When conflicts end and geopolitical risks materialize, crude oil, copper, and coal can instead surge.
The clearest example is the end of the Iraq War in 2003, when oil prices climbed from $25 to $147 in 2008.
There are two reasons: reconstruction drives huge demand for raw materials, while oil production capacity is hampered during the war, leaving supply unable to keep up. This supply-demand mismatch pushes prices higher.
$COP #黄金逼近3500美元关口
COP+0.85%
#BTCBreaksBelow60K Bitcoin briefly slipped below the $60,000 mark on November 20, marking its lowest levels since the summer and testing a psychological floor that many market participants had been watching closely. The move came amid broader pressure on risk assets, with technology stocks facing significant selling and sentiment turning more cautious across markets. What began as a sharp intraday decline raised immediate questions about whether this level would hold or whether further downside was still ahead.
By Friday’s session, Bitcoin had dropped from levels near $61,400 earlier in the da
BTC-0.67%
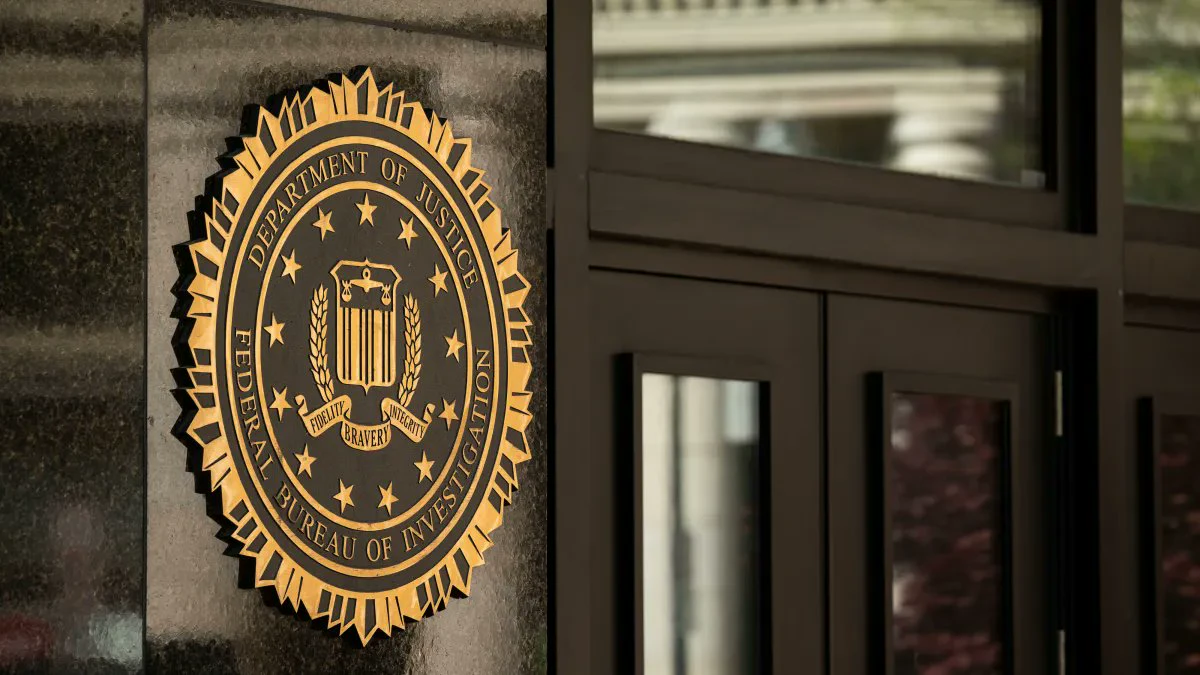
The FBI’s own criminal database may have been hacked—talk about irony!
The NCIC, used by law enforcement agencies across the U.S., has also reportedly been breached. It contains fugitives, missing persons, criminal records, and stolen property—if that data leaked, who would take responsibility?
Both AP and NBC got word from people familiar with the matter that the FBI is investigating, but on Saturday the FBI flat-out declined to comment, not even bothering to give the public a “we’re investigating”
Axios said the scope remains unclear and there’s no proof the attackers took the entire databas
post-image
$CRCLB Diverges Across Short- and Longer-Term Timeframes: Short-Term Strength, Mid-Term Weakness

$CRCLB is currently at 49.39, up 0.714% over the past 24 hours. Its intraday high is 49.88, and its low is 45.23. On the 1-hour timeframe, $CRCLB is showing strength, with the price breaking above EMA20 at 48.9513. RSI14 is 71.82, approaching overbought territory, indicating active short-term buying. The 1-hour support is at 45.23 and resistance is at 49.88. The price is above support, suggesting that short-term bulls are in control. However, the volume ratio is only 0.16, meaning hourly volume is
post-image
$UNI 4.737, 24H +5.71%. 1h RSI at 77 is overbought, and volume is only 0.28x the average. Resistance at 4.789 remains unbroken. I’m watching this level closely: I’d only look higher if it holds above 4.789; if it pulls back, I’ll wait and see. Not investment advice
#UNI #Uniswap
post-image
UNI+3.05%
$HYPE Is Strong on the 1-Hour Chart but Weak on the 4-Hour Chart; Direction Remains Unclear
$HYPE is currently at 61.54, up 1.652% over 24 hours, with an intraday range of 55.8‑61.9. The 1-hour chart shows strength, with the price above the EMA20 at 60.8225. RSI14 is at 76.8, entering overbought territory, but the volume ratio is only 0.29, far below average, indicating limited short-term buying participation. The 4-hour chart remains weak, with the price still trading below the EMA20 at 62.93. RSI14 is at 30.86, near the lower end of its range, while resistance is well above at 70.3. Both tim
post-image
HYPE+0.24%
$TRADOOR The market has stabilized and is starting to rally hard and turn a profit. Keep holding until we’re driving a Lexus LX570, brothers 🚘🚘$VVV $SKYAI
post-image
TRADOOR-1.11%
VVV+0.37%
SKYAI-7.58%
Load More

Join 40 M users in our growing community

⚡️ Join 40 M users in the crypto craze discussion

💬 Engage with your favorite top creators

👍 See what interests you

Trending Topics

BTCBreaksBelow60K

2.1M Views30.1K Discussing

BTC fell below $60,000 on November 20 for the first time since July, alongside a tech stock selloff and broader pressure on risk assets. Will $60K become resistance, or can BTC quickly reclaim it? What price or volume signals would convince you that selling pressure is easing?

GateDirectIPOPhase3ANTAllocates92100Shares

802.9K Views4.9K Discussing

NvidiaDropsNearly14Percent

336.1K Views7.6K Discussing

View More