
Share your thoughts
placeholder
Article
I just switched the app to the background, and it shot right back up—are you playing hide-and-seek with me?

When I checked the chart after lunch, it was still grinding along the bottom, but the K-line had already printed several long lower wicks in a row. When I opened it again in the afternoon, I happened to catch the high-volume breakout. This kind of upward move clearly isn't something retail traders can lift, so I went with the trend and opened a long at 13.489, starting with a small position to test the waters.

Now at 17.821, $SNXX the rally has been very clean, and the return on my p
post-image
SNXX+3.93%
SNDK+2.04%
LAB-0.12%
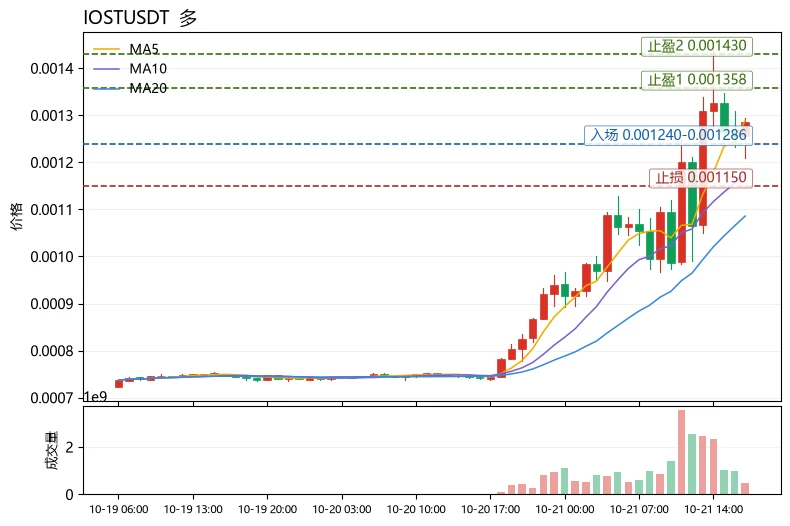
【$1000CAT Signal】Go long on pullback support
$1000CAT Pullback support, buying volume near 0.00255 is 1.58 times selling volume. 4H MACD bullish momentum is contracting, the 1H histogram has returned to zero, and 1H RSI is 61.84. The current quote is 0.002558, right within the recommended range.
🎯Direction: Go long
⚡Entry/Limit order: 0.00255033 - 0.00255800
🛑Stop-loss: 0.00253242
🚀Target 1: 0.00259637
🚀Target 2: 0.00261555
🛡️Trade management:
- Execution strategy: After reaching Target 1, reduce the position by 50% and move the stop-loss up to the breakeven level. If the price falls back
post-image
BTC+0.08%
ETH+1.02%
SOL+1.25%
I originally only wanted to mooch a breakfast, but the market ended up serving me dumplings for half a year.
A few days ago, when that late-night pullback hit, to be honest, many people were shouting that the level had broken. I kept staring at the $PONS /PONS chart, and the key level hadn't broken at all; instead, volume kept tightening and stabilizing. I posted one sentence at the time: Bottom consolidation isn't weakness—it's funds quietly accumulating. I entered a long position at 0.4156 and ground my way up to 0.9197, with paper profits surging straight to +2385.29%. I'm not going to brag
post-image
PONS+31.05%
ADA+3.89%
ZEC-1.17%
My long position made a round trip, and today I finally saw the protective level do its job. The drop a few days ago came sharply; to be honest, I was somewhat panicked because a lot of the unrealized profit had already been given back. But since I had placed a stop-loss order in advance, I didn’t have to watch the market all night trying to guess the key level. Once the price climbed back above 0.0116, I first took profit on 30% of the position, while moving the protective level higher with the trend for the remaining 70%. This wasn’t about predicting how much further the price could rise; I
post-image
LAB-0.12%
SNDK+2.04%
Everyone’s watching SUI’s 0.80 level—but the 4h chart is whispering a different secret.

$SUI /USDT - SHORT

Trade Plan:
Entry: 0.7976 – 0.8028
SL: 0.8247
TP1: 0.7818
TP2: 0.7696
TP3: 0.7512

Why this setup?
- RSI on the 15m is at 51.8, not overbought, not oversold—just dead air before a move.
- ATR 1h at 0.0102 means volatility is compressed; breakouts here are violent.
- Entry at 0.8002 with TP1 at 0.7818 is a 2.3% scalp, but the real target is TP3 at 0.7512 if the range floor cracks.
- Why now? The 1D trend is “range”—but price is hugging the upper rail, and short setups from resis
SUI+5.68%
$FONE fully closed my short as price can't break a 1 hour resistance and large traders starting to build long positions while price is heavily oversold.
I expect at least a slight pullback from here, or even change of trend.
Slowly building my long positions too now.
#FONE
post-image
FONE-0.05%
Crypto Signals and Trding Insights
live-cover
LIVE35
$ETH Signal】Long + 1H MACD histogram widening / 4H golden cross
$ETH The 1H MACD histogram widened to 3.81, with the price holding just below the upper Bollinger Band. The 4H golden cross continues, and the previous 4H bullish candle had a volume of 464,000. The 1H RSI is 65.24, and the funding rate is 0.0078%, so longs are not overheated. The order book depth ratio is 0.20, with sell orders placed deeper, creating slippage costs for short-term chasing. The risk-reward ratio is 1.5, the direction is clear, and execution should follow the specified levels.
🎯Direction: Long
⚡Entry/Limit order:
post-image
ETH+1.02%
BTC+0.08%
SOL+1.25%
BREAKING: Algorand has signed over 1,000,000 post-quantum transactions on mainnet, more than any leading Layer 1.
post-image
ALGO+5.08%
Most traders will ignore this 95% confidence SHORT until it's too late.

$LAB /USDT - SHORT

Trade Plan:
Entry: 0.07452 – 0.07498
SL: 0.07695
TP1: 0.07310
TP2: 0.07200
TP3: 0.07036

Why this setup?
Why now? The 1D trend is bearish, and $LAB /USDT is stalling at 0.07475—just above the invalidation line at 0.07428. RSI on the 15m sits at 50.03, showing zero bullish momentum. The 4h setup targets 0.07310 first, then 0.07200. If we lose 0.07428, the thesis dies—but that's a 0.6% risk for a 3.7% move down to TP3.

Debate:
Is the dip to 0.07200 the real play, or do you think 0.07475 holds as fak
LAB-0.12%
Everyone’s watching 80K, but I’m watching the 4h chart bleed—$BTC /USDT is about to fake you out.

$BTC /USDT - SHORT

Trade Plan:
Entry: 79698.9 – 79816.3
SL: 80321.3
TP1: 79334.9
TP2: 79053.0
TP3: 78630.3

Why this setup?
Why now? The 1D is rangebound, yet the 4h structure is cracking. RSI on the 15m is at 43 and falling—no bounce fuel. ATR is tight (234), meaning the breakout is coming, not optional. Entry at 79,757 with TP2 at 79,053 is a 0.9% scalp, but the real edge is the invalidation at 79,079. If that breaks, the short thesis is dead. This is a low-confidence trap (55%), so size do
BTC+0.08%
Perhaps, a small amount of your capital, even just a few hundred U, can generate 10x or even 100x returns through my live trading. #美国8月非农超预期 #Gate用户突破6000万
High-frequency trading throughout, precise entry points, capturing big profits.
post-image
Seems like Christmas 🎁⛄🎄
$TROLL
post-image
TROLL-22.82%
  • 2
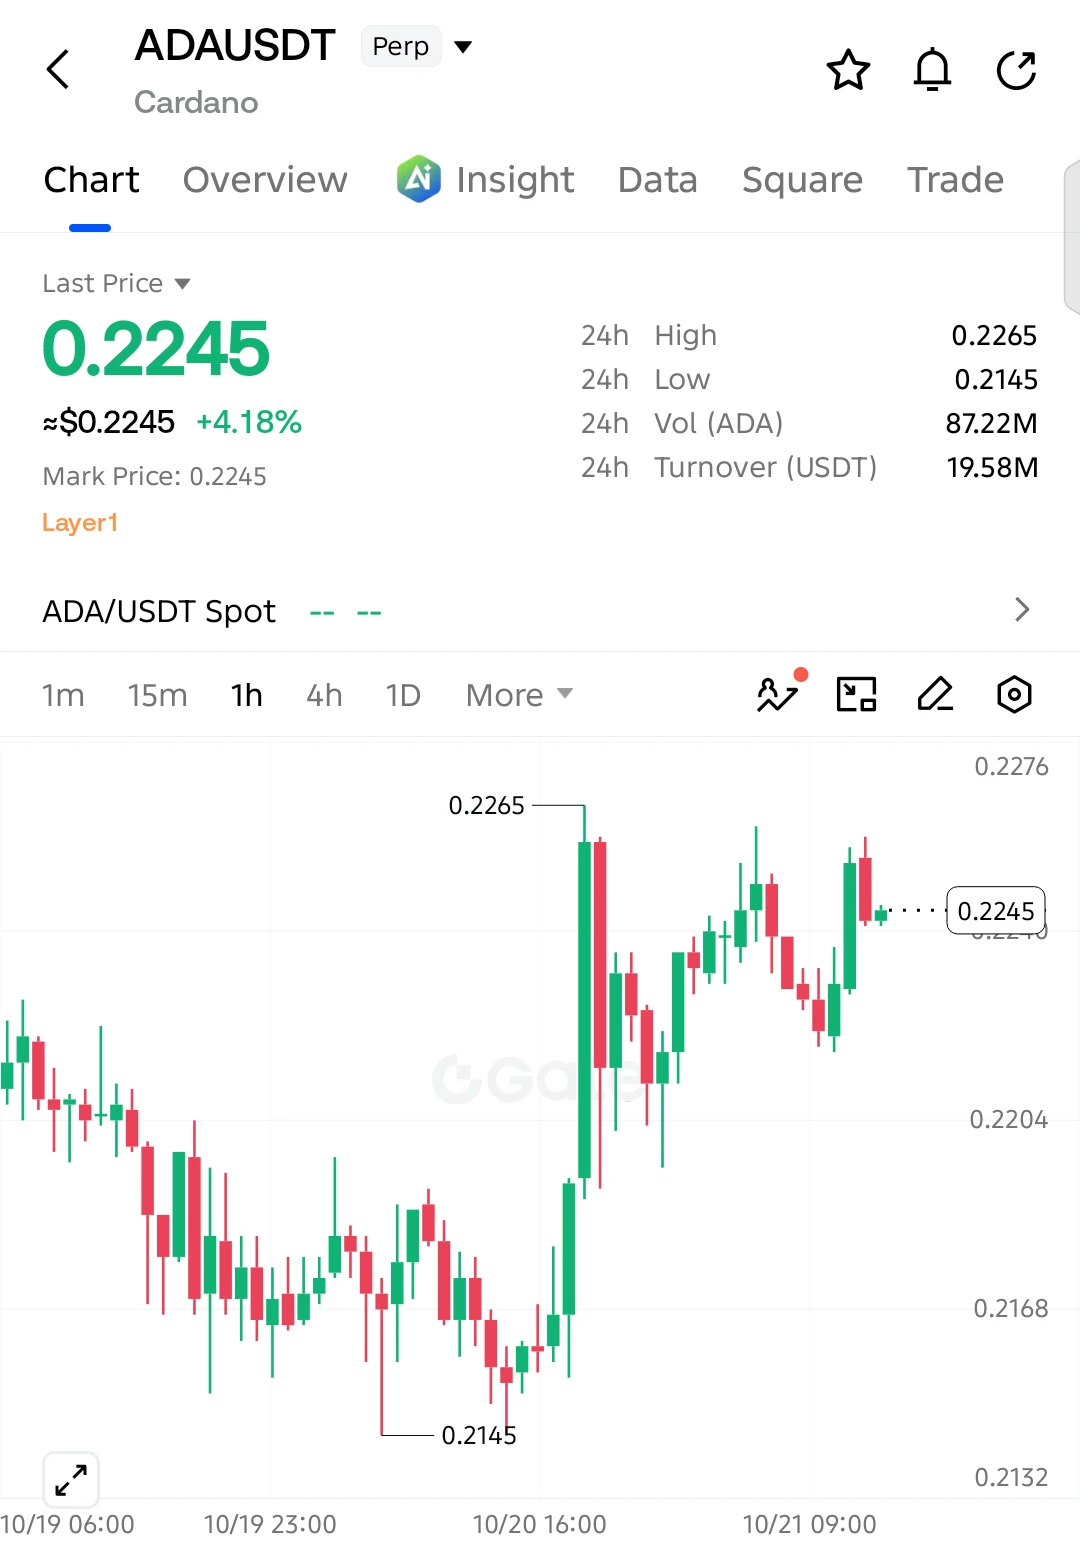
Everyone’s staring at Bitcoin, but ADA just flashed a quiet short signal that most will ignore until it’s too late.

$ADA /USDT - SHORT

Trade Plan:
Entry: 0.2196 – 0.2208
SL: 0.2258
TP1: 0.2160
TP2: 0.2131
TP3: 0.2089

Why this setup?
Why now? The 4h frame is rejecting 0.2202 with a 55% short bias, while the 1D stays range-bound—meaning no bullish escape. RSI on the 15m is cooling at 59, and ATR (0.00235) shows volatility is compressing for a squeeze. Targets are stacked: TP1 at 0.2160, TP2 at 0.2131, TP3 at 0.2089. Stop at 0.2258 is tight. This isn’t a gamble; it’s a measured fade against
post-image
ADA+3.89%
Everyone’s watching $MU /USDT for a breakout—but the 4H chart just whispered a secret the crowd missed.

$MU /USDT - SHORT

Trade Plan:
Entry: 1015.38 – 1017.00
SL: 1026.36
TP1: 1008.56
TP2: 1003.48
TP3: 995.86

Why this setup?
- RSI (15m) at 47.92—no momentum spike, just sideways exhaustion.
- ATR (1H) at 3.25 shows shrinking volatility, priming for a sharp squeeze lower.
- 1D trend is *range*—so we’re not chasing; we’re fading the top of the box at 1016.19.
- TP1 at 1008.56 is 0.75% away; TP2 at 1003.48 is the real magnet if 1015 support cracks.

Debate:
Is 1016 the fake ceiling be
MU+0.33%
Everyone’s staring at $H /USDT’s bounce, but the 95% short signal says they’re about to get run over.

$H /USDT - SHORT

Trade Plan:
Entry: 0.07620 – 0.07690
SL: 0.07991
TP1: 0.07403
TP2: 0.07236
TP3: 0.06984

Why this setup?
Why now?
- The 1D trend is still **bearish**, and the 4h setup is armed for a drop—not a reversal.
- RSI (15m: 41.4) shows weak momentum, no oversold snap-back fuel.
- Price sits at 0.07655, with immediate targets at 0.07403 and 0.07236—that’s a 5%+ slide before any real support.
- ATR (1h: 0.001398) means volatility is alive, but the path of least resistance i
H-5.69%
This trend is so obvious I don’t even need to think—the account is dancing by itself 😂 I had just finished reading the bearish news, and the market slid another notch, with the short side starting to perform on its own.
Before the market had fully kicked off, I already felt that the rebound was off. Several consecutive rebound attempts were all pushed back down, with what felt like an iron plate covering the upside; price and volume completely failed to keep up. This kind of low-volume rebound is the easiest way to trick people into taking the other side. I went short directly around 0.00787,
post-image
BTC+0.08%
XRP+1.13%
Everyone’s staring at NEAR’s 2.17 level—but the 95% confidence score says they’re looking at the wrong chart.

$NEAR /USDT - LONG

Trade Plan:
Entry: 2.1593 – 2.1835
SL: 2.0551
TP1: 2.2586
TP2: 2.3168
TP3: 2.4041

Why this setup?
- 1D trend is bullish, and 4h momentum is aligning for a breakout, not a breakdown.
- RSI on 15m is cooling at 40.42—this is the reset before the push, not exhaustion.
- Entry zone 2.1593–2.1835 is tight; TP1 at 2.2586 is only a 4% move away, but TP3 at 2.4041 is the real prize.
- Why now? The pullback is shallow (ATR 0.048), meaning sellers are weak—buyers a
NEAR+2.49%
Everyone’s staring at SLX, but the 4h chart is quietly screaming a warning that nobody wants to hear.

$SLX /USDT - SHORT

Trade Plan:
Entry: 0.0703 – 0.0706
SL: 0.0719
TP1: 0.0694
TP2: 0.0687
TP3: 0.0676

Why this setup?
- Range-bound 1D trend means breakouts are fake—mean reversion rules.
- RSI 15m at 59 shows a weak bounce, not a reversal; momentum is stalling below 0.0705.
- ATR 1h of 0.0006 gives tight stops—perfect for a controlled short.
- Why now? The entry zone (0.0703–0.0706) is the exact rejection area; with TP1 at 0.0694, the risk/reward is 2:1 before the daily range even
SLX+0.03%
Load More

Join 40 M users in our growing community

⚡️ Join 40 M users in the crypto craze discussion

💬 Engage with your favorite top creators

👍 See what interests you

View More