




Square
Following
Hot
News
Profile
Share your thoughts
placeholder
Article
BTC’s daily chart shows a V-shaped reversal after a sharp wick down, holding above the Bollinger middle band, with a bullish MACD and KDJ golden cross signaling a recovery in the broader trend.
Four-hour momentum is strong, breaking above the Bollinger upper band, but KDJ is extremely overbought and substantial profits have accumulated. A technical pullback is likely in the short term to absorb profit-taking and confirm the breakout.
Overall, the broader outlook is bullish, but avoid chasing prices in the short term; it’s better to go long after a pullback confirms support.
🉑Go long near 7980
post-image
BTC-0.67%
ETH-1.26%
  • 2
🟢 $ZEC — Short Squeeze Could Fuel Another Rally! 🚀 ZEC recorded $28.934K in short liquidations at $1,328.14, showing that bearish positions are getting caught under buying pressure. Support: $1,310–$1,290 | Resistance: $1,340–$1,360 | Target 🎯: $1,380 / $1,410 / $1,450. Next Move: Holding above support and breaking $1,360 could strengthen bullish momentum. A rejection may lead to a support retest. Pro Tip: Don't let excitement replace risk management; secure profits gradually and protect your capital. ⚡$MU ‌$AMD ‌
post-image
ZEC+1.16%
MU-6.98%
AMD+0.88%
Trenches
ZIG
Z
bade
b
ZIG
0x8c...1145
Market Cap
$.
Change
.
24h Vol
$.
Holders
.
BTC
B
bade
b
BTC
C5xp...pump
Market Cap
$.
Change
.
24h Vol
$.
Holders
.
HIGH
H
bade
b
HIGH
7ymF...high
Market Cap
$.
Change
.
24h Vol
$.
Holders
.
STONK
S
bade
b
STONK
6GmA...UNgx
Market Cap
$.
Change
.
24h Vol
$.
Holders
.
RAM
R
bade
b
RAM
6QUH...pump
Market Cap
$.
Change
.
24h Vol
$.
Holders
.
Bitcoin plunges and rebounds again, putting U.S. policy in the spotlight! Is $80,000 a starting point or a test?
BTC's recent moves have been like a roller coaster, first making bulls' hearts race, then leaving bears questioning their life choices. After briefly falling below a key price zone, it quickly rebounded and challenged $80,000 again, sending market sentiment through a 180-degree turn.
But behind this move, U.S. policy expectations deserve close attention. The U.S. midterm elections have changed the balance of power in Congress, potentially affecting future crypto market structure leg
PEPE+1.05%
AMD+0.88%
  • 1
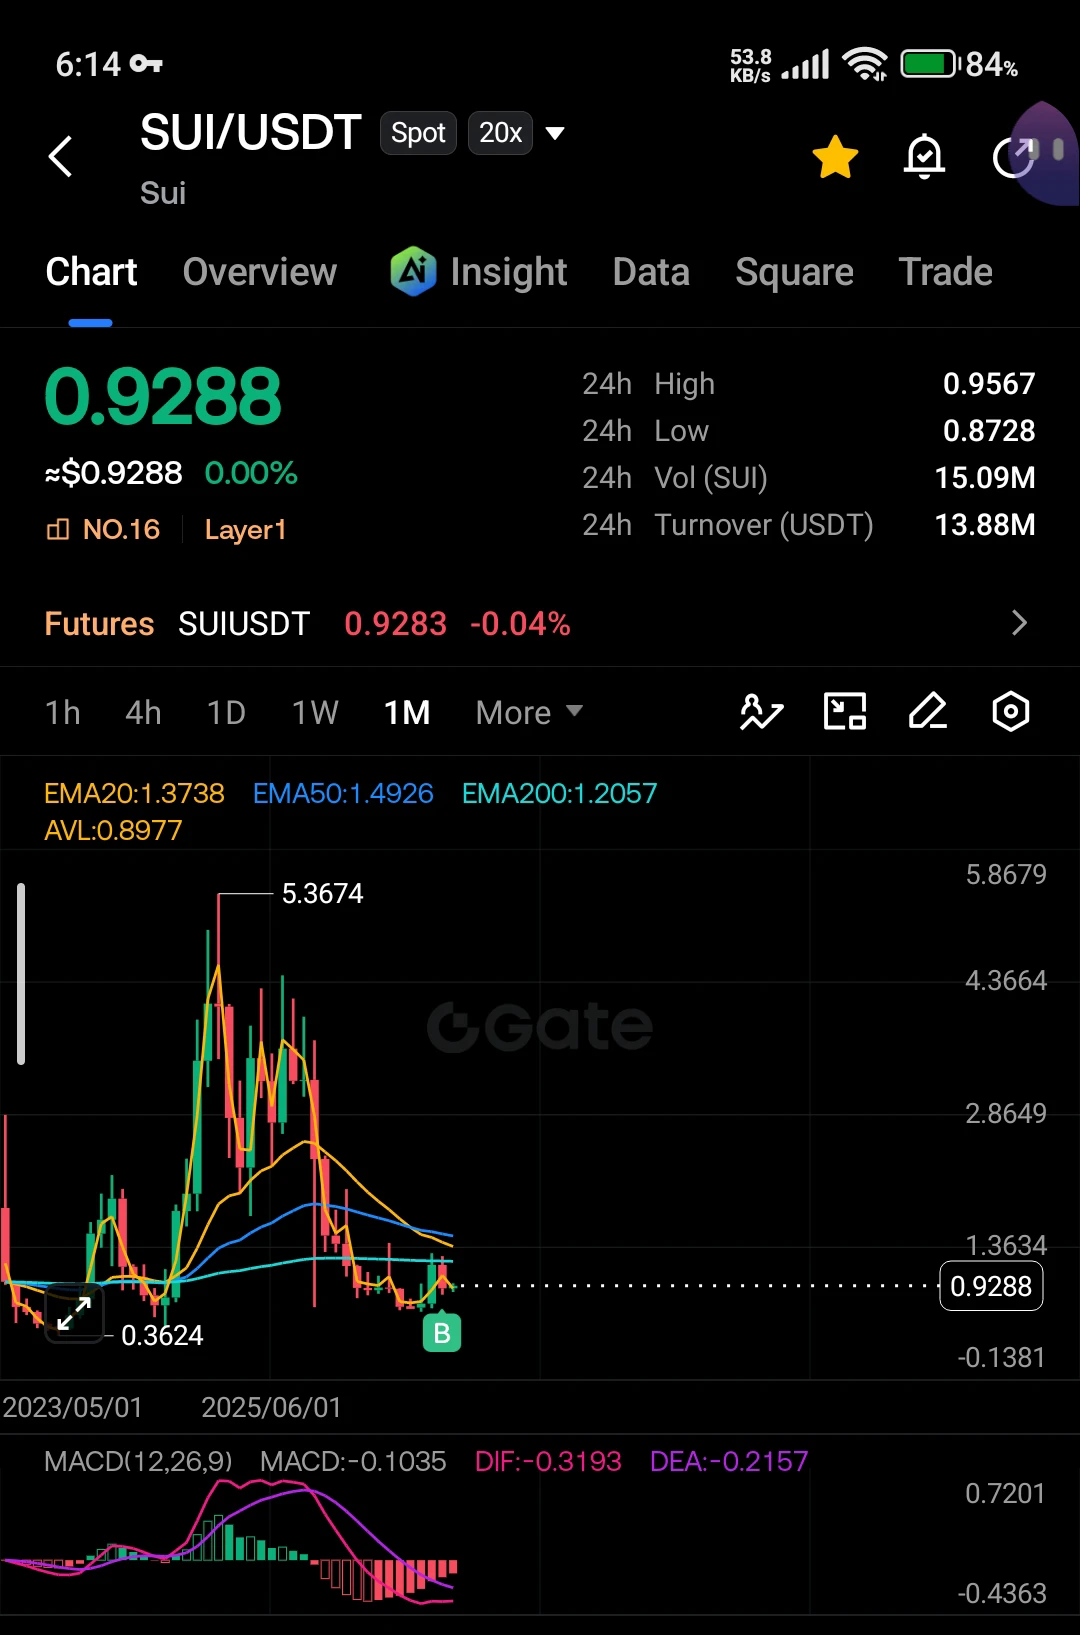
$SUI is a strong fundamental project.
Don't miss it.
Buy and hold, or put it in a bot until the market kicks off again.
NB: No more than 5% of your portfolio per coin.
Remember, patience pays off. ‌
post-image
SUI-1.05%
11.5 ZEC Public Trading Strategy
【Short Setup】$ZEC
  Entry range: around 1360-1400
  Stop-loss: 1420
Take-profit tiers
  First target: 1330
  Second target: 1280
Third target: around 1240
Fourth target: below 1180
Trading factors: The current price is near the upper Bollinger Band. In the short term, it has held above all moving averages, the red bars are expanding, and bullish momentum is steady. Order book depth suggests sellers have the upper hand.
Trading suggestion: The current price is consolidating near the top of the higher-timeframe range; a small-position sho
ZEC+1.29%
BTC-0.65%
Does a higher yield always mean a better investment opportunity?
In the crypto market, what really matters is not just the yield, but also where it comes from, whether you can withdraw your funds, and how much you could lose in the worst-case scenario.
Keep three questions in mind:
📈 How is the yield generated?
⚠️ What risks do I need to take on?
🔓 If things change, can I exit in time?
Don’t just chase higher numbers. Understanding the mechanisms behind the yield helps you make more rational decisions.
post-image
  • 1
#BTC重返8万 #每周来晒 #广场交易达人 #WCTCS9 BTC Market Analysis
BTC is currently around $80,650, up 4.9% in 24 hours, and has indeed reclaimed the $80,000 level. But this rebound has mainly been driven by short liquidations, while spot inflows have yet to catch up, so near-term price action is more likely to be choppy.
Here are the main things to watch
ETF flows: There have been cumulative net outflows of about $1.157 billion over the past three trading days, so this source of buying has yet to return.
U.S. stocks and macro factors: Falling Treasury yields and a rebound in U.S. stocks have supported this r
ThisIsTranslateContent:
#BTC重返8万 #广场交易达人 #WCTCS9 BTC Price Analysis
BTC is currently around $80,650, up 4.9% in 24 hours, and has indeed climbed back above $80,000[1]. But this rebound is mainly driven by forced short covering, while spot market inflows have yet to catch up, so near-term trading is more likely to be choppy.
Key factors to watch
ETF flows: Net outflows totaled around $1.157 billion over the past three trading days, so this source of buying has yet to kick in.
U.S. stocks and macro: Falling Treasury yields and a rebound in U.S. stocks have supported this recovery; U.S. employment data on November 6 will affect rate expectations.
· Leveraged positions: When the price quickly rebounded from $75,700, concentrated short liquidations amplified the gains. This type of buying often lasts only until the positions are closed.
Several key price levels
$81,000–$82,000: Near-term resistance; a move up to this level could easily be followed by a pullback.
$80,000: The key support level now. A daily close below it could lead to another test of around $77,600.
$85,000–$87,500: The area with the heaviest concentration of underwater holders and sell orders, making a near-term breakout difficult.
Two possible scenarios
If BTC holds above $80,000, ETFs see consecutive inflows, and trading volume expands: upside opens up, with $90,000 as the next target.
If BTC falls back below $80,000: Previous downward pressure will return, and the price could retest $77,600.
For now, trading within a range looks more suitable. Wait for ETF inflows to return and for the daily close to hold above $80,000 before deciding whether a new uptrend has begun.
Whether this rebound can last mainly depends on whether new money enters the market. A price rise accompanied by inflows into ETFs and stablecoins would indicate a more sustainable move.
On-chain data: See who holds the coins
Exchange balances: A decline means coins are being withdrawn and held, easing selling pressure; a rise suggests people are preparing to sell.
SOPR: Above 1 means most sellers are making a profit; below 1 means people are selling at a loss.
Long-term holder activity: Little movement in older coins suggests large holders are not selling.
Realized market cap: If it rises along with the price, that suggests new money is entering; if only the price rises, existing funds are probably just changing hands.
Market indicators: See whether money is flowing in
ETF net flows: Consecutive days of net inflows would show institutional buying has returned.
Total stablecoin market cap: A rise means money on the sidelines is still waiting to enter.
Trading volume: A rally on rising volume is much more solid than one on declining volume.
Funding rates: A return to neutral means leveraged chasing has cooled, making the market healthier.
Watch for these signals
Bullish: Consecutive ETF inflows, growth in the total stablecoin supply, and closes holding above $80,000.
Bearish: A fall below $80,000, a return to net ETF outflows, and a marked increase in exchange balances.
ETF outflows have yet to show a consistent slowdown, and the total stablecoin supply has not reached a new high, so this looks more like a short-term rebound; a trend reversal still needs confirmation from fund flows.$BTC

repost-content-media
BTC-0.67%
  • 6
not bad first future short!
post-image
NOT-1.11%
#BTCBackAbove80K
🌈 Gate Live Streaming Inspiration - Nov.5
Today's Topic Recommendations:
🔹Democrats Sweep Both Chambers of Congress as the Dow Surges Over 3%! But AI Stocks Fall Across the Board. Is a Major Sector Rotation Underway in U.S. Stocks?
🔹KOL View: Tom Lee Remains Bullish on the AI Trade! With Tech Stocks Facing Repeated Sell-Offs, Is This a Crisis or a Buying Opportunity?
🔹Chip Stocks Are Falling, but Demand Hasn't Weakened? With Democratic Regulatory Expectations Shaking Markets, Are Semiconductor Stocks Being Unfairly Punished?
🔹OpenAI Uncovers 948 Linux Vulnerabilities in
BTC-0.67%
GT-2.41%
ETH-1.26%
  • 4
I once knew someone who traded gold. He started with $5,000 and grew it to over $60k in less than three months. The most outrageous part was that in the end, he couldn't even protect his principal.
At first, he was pretty steady. He'd make $300 to $500 a day and then stop, and he knew to cut his losses when trades went against him. Later, after catching several big market moves in a row, he started getting carried away. He used to be happy for a whole day after making $500; later, even making $2,000 in a day felt like too little.
I urged him, “You've made so much already—take some money out fi
post-image
XAUT+0.30%
I checked the market around noon
BTC rebounded overnight from around 75.6k
It briefly touched 81k
The current price is still around 80.5k
Up about 4% in 24 hours
ETH is around 2,420
Up more than 6% in a day
Liquidation data is striking
The whole market saw about $970 million liquidated in 24 hours
Short positions accounted for about 60%
A strong short-squeeze feel
Over in U.S. stocks
The Dow rose about 3%
The S&P 500 rose about 1.6%
The Nasdaq rose about 1.4%
Oil prices also plunged
The midterm election results are in
Democrats won a majority in the Senate
Short-term political uncertainty has
post-image
BTC-0.65%
ETH-1.26%
SPX+0.33%
NAS100-0.07%
#BTC重返8万 #每周来晒 In the short term, U.S. policy and political expectations are the main drivers, leveraged liquidations are the amplifier, and geopolitical developments are a background variable—but the three are not on equal footing: “policy sets the direction, leverage sets the amplitude, and geopolitics sets the mood.”

① U.S. policy expectations: the main theme of this market move

The immediate trigger for this move above $80k was the U.S. midterm elections on November 4. When early vote counts indicated that Democrats might win control of both chambers, the crypto market fell; after Trum
BTC-0.67%
  • 7
#btc
Bitcoin Price Analysis: BTC Trades Near $80,560 as Market Faces Selling Pressure – Can Bulls Make a Strong Comeback?
Bitcoin continues to attract attention as the cryptocurrency market experiences another important period of price movement. According to the BTC/USDT chart, Bitcoin is trading around $80,560, while the market shows signs of short-term selling pressure and an attempt to establish a stronger recovery.
The latest chart presents an interesting situation for traders and long-term investors. Although Bitcoin has experienced several upward movements, sellers have repeatedly enter
BTC-0.67%
ETH-1.26%
Rewards are being distributed! Open your mystery box now and win up to 100 USDT worth of tokens!
  • 2
  • 1
I remember something an influencer once said: obesity, high blood pressure, high cholesterol, vascular plaque, and high uric acid—all of it stems from insulin resistance, meaning high carbohydrate intake. People think high-carb means milk tea, but rice and steamed buns are sugar too.
Adults must manage their blood sugar the way they manage their girlfriends
Gm ,grinders
May our day be productive 🤲
post-image
☀️ GM! The market has switched gears again—which direction are you watching today? 📺
The Nasdaq rose 1.4% last night, but semiconductor stocks weakened against the trend, while BTC rebounded to around $80K . 👀
📌 Today's featured topics: The market is moving in different directions—which one are you watching most closely?
₿ BTC: Can the rebound continue?
💻 U.S. tech stocks: The broader market is strong, so why are chip stocks lagging behind?
📊 U.S. nonfarm payrolls: The data comes out tomorrow night—how are you preparing?
The market is moving at different paces. What's your take?
🎁 Share
post-image
NAS100-0.07%
BTC-0.67%
  • 11
  • 7
Load More

Join 40 M users in our growing community

⚡️ Join 40 M users in the crypto craze discussion

💬 Engage with your favorite top creators

👍 See what interests you

Trending Topics

BTCBackAbove80K

22.7k Views41.13k Discussing

After a sharp dip, Bitcoin climbed back above $80,000 on May 9 and is currently trading around $80,200. Over 50,000 traders were liquidated in the past 24 hours amid fierce long-short battles. The recurring Iran-U.S. tensions remain the primary short-term variable. Following U.S. airstrikes, Iran\'s Revolutionary Guard claimed to have breached the Strait of Hormuz defense line, leaving the ceasefire outlook uncertain. On the technical side, the daily SMA20 ,$77,970 serves as key support, with the RSI recovering from oversold levels to 43. The $80,000 level is both a psychological barrier and a bull-bear dividing line.Holding above it could lead to a challenge at $85,000, while a break may trigger a retest of the $77,000 area.

DemocratsWinBothChambers

16.68k Views425 Discussing

GateLaunchesTaiwanStockTrading

14.33k Views284 Discussing

View More