Square
Following
Hot
News
Notifications
Profile
Share your thoughts
placeholder
Article
Analysis crypto coin
live-cover
LIVE2,061
ETH-1.26%
BTC-0.67%
GT-2.41%
U.S. stocks can really take a nosedive: down 34% in ’87, 49% in 2000, 56% in ’08, and 34% in 2020. If you’re dollar-cost averaging into the S&P 500 and ACWI through NISA, think carefully about whether you can handle your account being cut in half. My hands were shaking when I added to my position last week—the answer is in the details. Weekend trading volume is only 30% of weekday volume, so even a little volume can push prices up. It’s the same pattern everywhere.
post-image
SPX+0.33%
  • 2
  • 2
Trenches
IDOL
I
bade
b
IDOL
0x3b...ab07
Market Cap
$.
Change
.
24h Vol
$.
Holders
.
JAGENT
J
bade
b
JAGENT
0x8e...ae15
Market Cap
$.
Change
.
24h Vol
$.
Holders
.
PIEVERSE
P
bade
b
PIEVERSE
0x0e...25a9
Market Cap
$.
Change
.
24h Vol
$.
Holders
.
CLAUDIA
C
bade
b
CLAUDIA
2j5S...W2ZM
Market Cap
$.
Change
.
24h Vol
$.
Holders
.
FIONA
F
bade
b
FIONA
B34n...pump
Market Cap
$.
Change
.
24h Vol
$.
Holders
.
$PI This Youlong lost even his underwear. He's running around naked now. He used to be on Kuaishou livestreams. Crying and whining, unable to take a loss. This is the project he invested in
post-image
PI-0.60%
  • 3
Crypto analyst Axel Adler Jr. recently observed that the Bitcoin $BTC Cycle Extreme indicator (BTC Cycle Extreme), which he designed in 2023, has just triggered for the first time since May 2024. As Bitcoin’s price pulled back into the $60k range, anomalous on-chain readings increased significantly, prompting the indicator to signal. Notably, this signal has historically appeared both near market tops and during concentrated sell-offs, so this trigger alone is not enough to conclude that Bitcoin has bottomed. Price action will need to be monitored going forward. $ETH $SOL

Risk warning: The
post-image
BTC-0.67%
ETH-1.26%
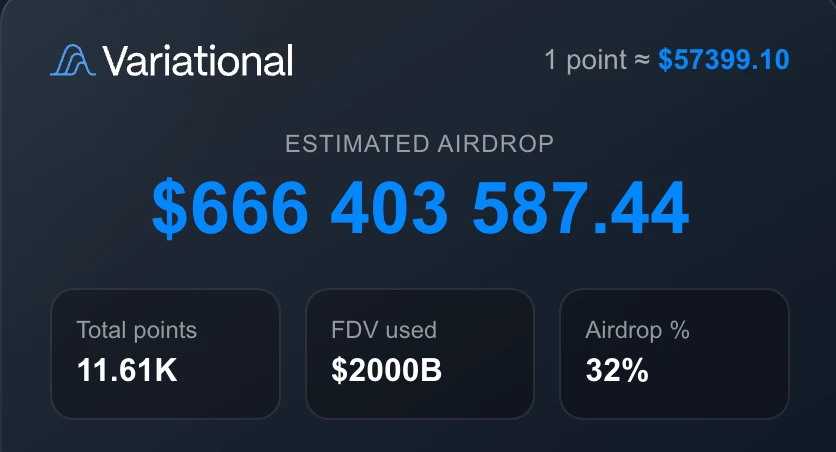
what if ?
can variational flip anthropic with $2T
1 point = $57399
needed for retirement 🙏🏻
post-image
ANT-8.68%
  • 2
In the 17:00 move, I noted that it rose from 60k to 60,410 before sliding back down; when I took a screenshot, it was around 59,762 and 59,660, and I thought that might be it for today
Then at 17:15, it climbed back up to 60k
By 17:55, the high on this side had reached 61,365 and the other side 61,238; this move also surpassed last night's highs in the 60,883–61,000 range
At 18:08, the current price was around 61,105 on one side and 61,007 on the other; it was still hovering near 61,000 without falling back below 60k
From today's low of 58,636 to 61,365, that's a recovery of about 4.7%; 55,000
post-image
4-4.10%
Observe PA around the 200dma and the SFPs.
If we retest 200dma from here bid the higher low
This is a project by Youlong Investment. They lost everything, down to their underwear, and are running around naked. On Kuaishou, crying and whining because they can’t take a loss.
post-image
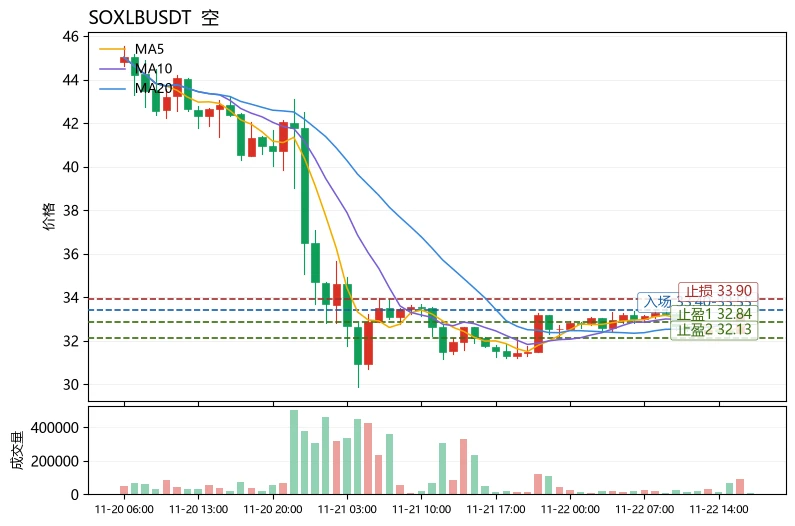
$SOXLB$SOXLB is currently at 33.44, up 5.76% in 24h, with a trading volume of 26.2M USDT; MA5=32.838 is slightly below MA20=32.841, RSI=51.9 is neutral, the MACD histogram at +0.2315 remains bullish, the Bollinger upper band at 33.5518 is close by, and the 30-candle range is about 8.4%; the Fear & Greed Index is only 11, indicating extreme fear. The data speaks for itself: the price is hugging the Bollinger upper band, the moving averages are converged and not spreading apart, and sentiment is at rock bottom. This is a typical “rebound into resistance, elevated volatility” setup. Chasing longs
post-image
NVDAB
NVDABNVDAB
Pump.Fun
MC:$3.5KHolders:1
4.36%
SUI-1.05%
BTC longs from 58,800 are in profit, and ETH longs from 1,650 are in profit. You can reduce your positions and keep buying the dip.
post-image
  • 6
$USD1 1.00085, 24H +0.05%. The 1h chart is weak, while the 4h chart is strong, showing a clear divergence between the two timeframes. The 1h RSI is neutral at 52, and volume is subdued, with buyers and sellers temporarily balanced. Resistance is at 1.0012; I’ll only turn bullish if price holds above it. I’m watching this level and will wait for confirmation from increased volume before deciding. Don’t mistake short-term volatility for a reversal; patiently wait for direction. Stay calm and don’t chase rallies or sell into drops. This is not investment advice.
#USD1
post-image
USD1+0.00%
ZECUSDT Rebound Watch: Liquidity Surge & Multi-Timeframe Structure

ZECUSDT is showing a sharp intraday bounce around the $794 mark (~+9.9% on perps and ~+9.7% on spot), backed by roughly $128.3M in 24h turnover and over 161K ZEC traded. After sweeping down toward $679.27 on lower timeframes, price action is attempting to stabilize following a steep multi-week pullback from higher highs.

Key Levels & Market Structure
Immediate Rebound Zone: Price is hovering near $793–$795, testing short-term moving averages on the 1H and 4H charts after lifting off the $679.27 swing low.

24h Range: Hi
ZEC+1.29%
  • 2
  • 1
$LUMIA
UPDATE
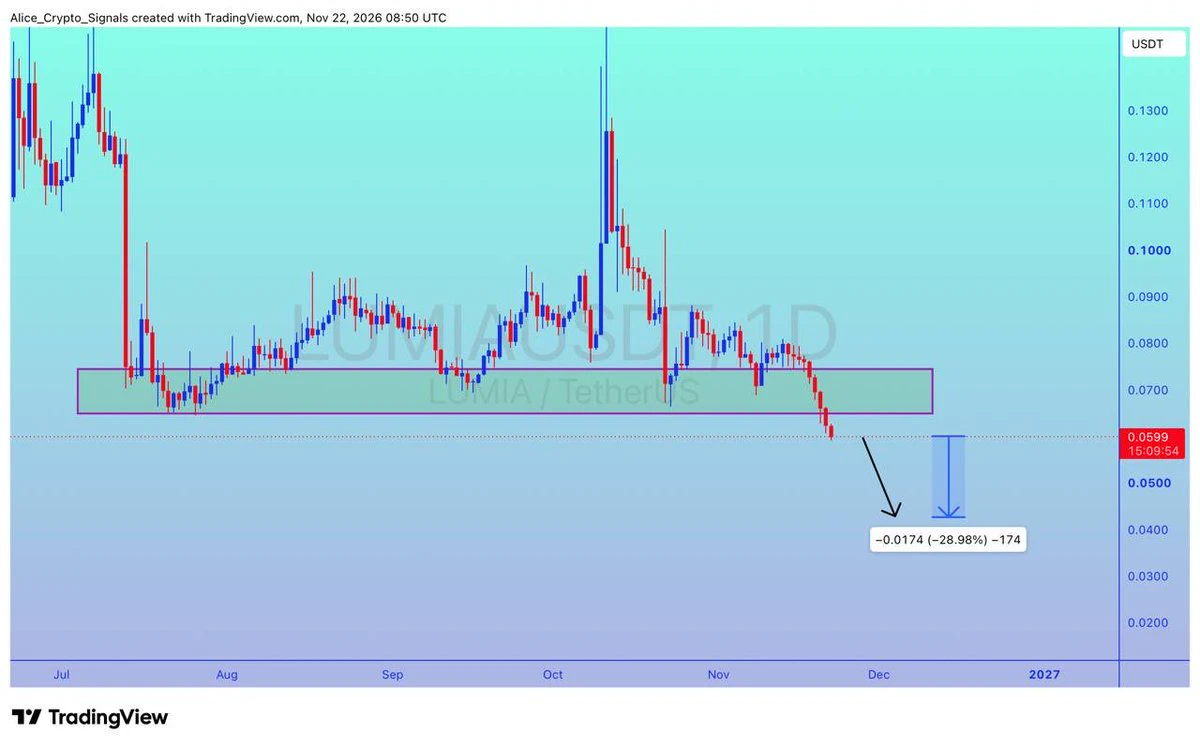
#LUMIA is dropping gradually. In this move we can see 20%+ drop here ✍🏻
post-image
LUMIA-1.71%
Someone I’m introducing to my brother-in-law for a blind date. What do you guys on X think?
post-image
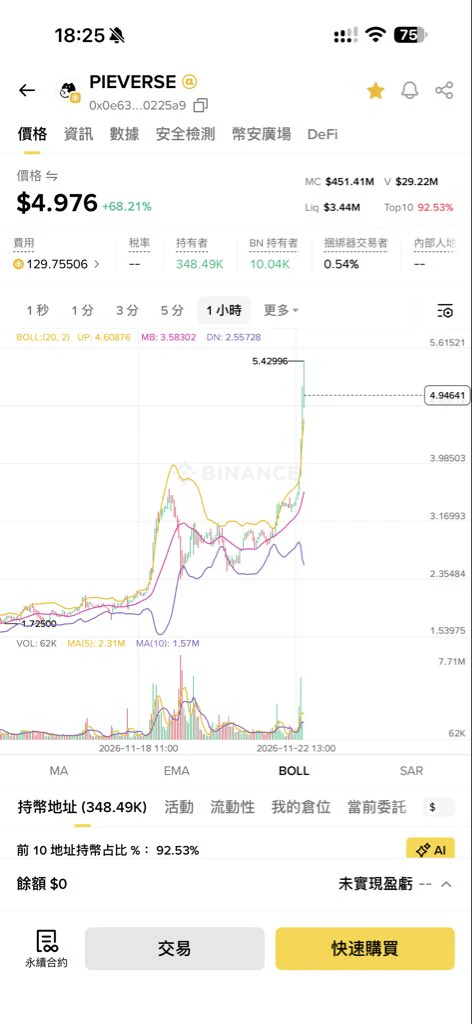
Is $PIEVERSE really going this hard?
It just keeps pumping and pumping on its own.
post-image
PIEVERSE+0.58%
#TRUMP
TRUMP TOKEN: Can Political Momentum Trigger the Next Major Rally?
OFFICIAL TRUMP (TRUMP) continues to attract attention in the cryptocurrency market because of its unique connection to political influence and the meme coin sector. Built on Solana, the token benefits from strong community recognition, social media visibility, and speculative trading interest.
However, TRUMP is also exposed to significant volatility. Political announcements, investor sentiment, whale transactions, and broader crypto market movements can quickly change its price direction.
Market Outlook: If bullish momen
TRUMP-0.95%
SOL-0.77%
  • 1
Don't Use SMS for Crypto 2FA!
#Crypto #CryptoSecurity
post-image
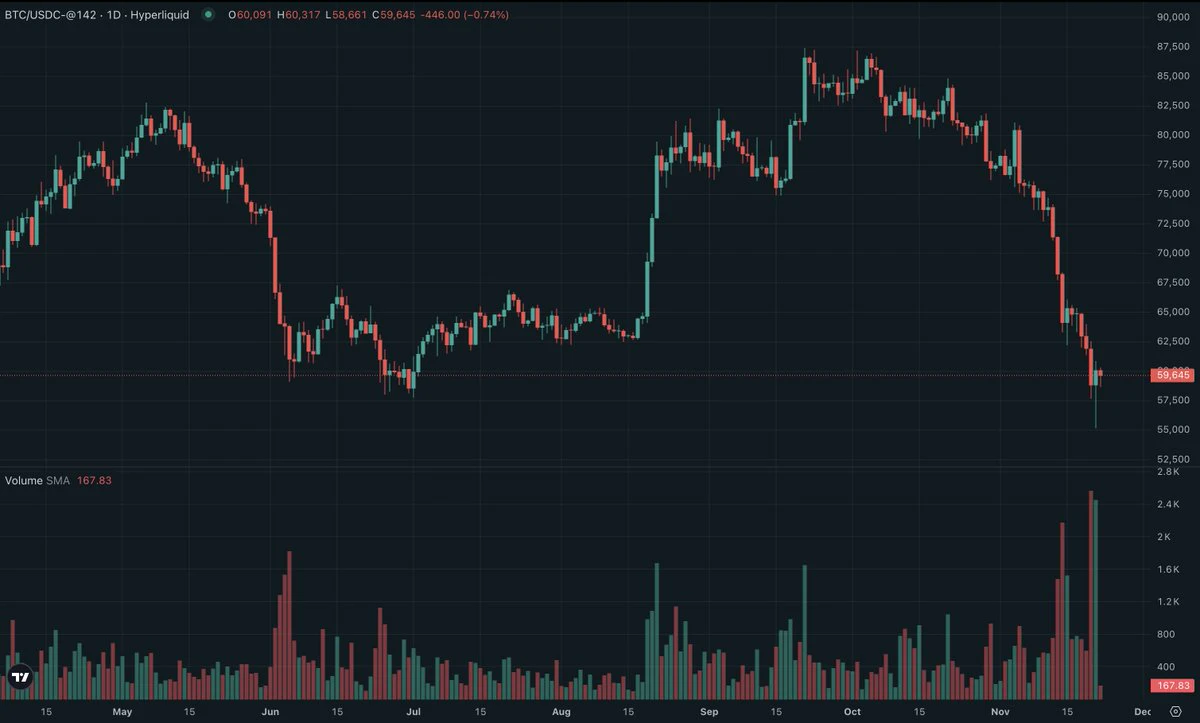
If you slept through the weekend, Bitcoin looks like it barely moved.
In between, it dropped to around $55K and took about $2B of longs with it, then bounced back near $60K and wiped out a few hundred million in shorts on the way up.
The chart looks calm now, which is funny considering what it did to everyone who was trading it.
post-image
BTC-0.65%
🔹 Trader Killa Says Bitcoin Is Near a Macro Bottom, With a Potential $40,000-$55,000 Range
live-cover
LIVE2,438
BTC-0.67%
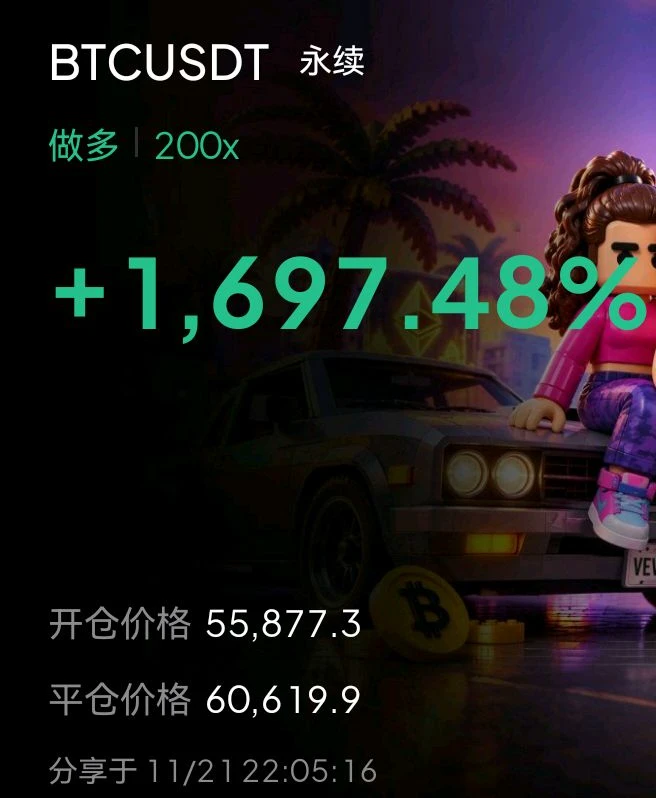
- What this trade earned wasn't profit, but nerve.
- With the trend on my side, profits are mine.
- Long position entered, returns on the leaderboard.
- 200x isn't gambling; it's decisive action after careful judgment.
- Read it right, hold on, close out beautifully.
- On this BTC move, the bulls have already turned in their papers.$BTC #BTC反弹后再争6万美元关口
post-image
BTC-0.67%
Load More

Join 40 M users in our growing community

⚡️ Join 40 M users in the crypto craze discussion

💬 Engage with your favorite top creators

👍 See what interests you

Trending Topics

BTCReboundFaces60KTest

2.1M Views30.1K Discussing

BTC rebounded from around $55,300 on November 21, briefly reclaiming $60,000 before pulling back to around $59,300. The $60K level is back in focus as traders assess whether the recovery can last. Is this rebound a sign of stabilization or a short-lived recovery? Would reclaiming and holding $60K be enough, or do you need confirmation from trading volume and fund flows?

PCEAndGDPDataNextWeek

259K Views2.6K Discussing

GateDirectIPOPhase3ANTAllocates92100Shares

829.2K Views5K Discussing

View More