Square
Following
Hot
News
Profile
Share your thoughts
placeholder
Article
After RSI became extremely oversold, successfully caught $BTC
’s strong rebound. 🟢 This countertrend trade delivered a 27% return on investment. 📈 Profit: $ 72 Today's focus: $SOL and $SAFE .
post-image
SAFE+8.09%
#GateWCTCS9全球交易赛 #辣妹儿李嘉欣
Today, just do one thing: wait for a target price with no take-profit level
  • 4
Yang Guang bit | October 13 $BTC Precise Strategy: The trend is fully under control — a high-level plunge broke support and moved lower; short on the rebound and capitalize on the trend
【Today's Strategy】
Entry timing: Set up short positions in the 82500–82800 range on a rebound
Stop-loss: Above 83100
Staggered take-profit:
First target: 81500–81300
Second target: 80300–80000
【Core Conclusion】
BTC plunged from yesterday's high of 84340 on heavy volume, hitting a low of 80985 before rebounding to around 82120. Moving averages across the 4-hour timeframe are fully bearishly aligned, making rebou
post-image
BTC-1.44%
Korean stocks hit the daily limit down again... What the hell are Koreans playing at~
#韩股大跌你会抄底吗
#ZEC Keep waiting; once it breaks below 1100 and drops to 800, it’ll be smooth
post-image
ZEC-6.89%
#交易机器人 I’m using Gate’s META NVDA TSLA Contract Combo Contract Combo bot, come copy-trade with me
post-image
NVDA-2.61%
TSLA-2.68%
Quick short trade, instrument $SHOP
Short at 179.00 or 181.00; first target 175.00, second target 170.00, third target 165.00, final target 160.00++ Set the stop-loss above 195.00
post-image
SHOP+4.09%
Insiders are quietly loading SYMHYNIX after a range break that most traders missed.

$SKHYNIX /USDT - LONG

Trade Plan:
Entry: 1096.28 – 1102.36
SL: 1061.44
TP1: 1127.73
TP2: 1146.67
TP3: 1175.08

Why this setup?
Why now? The daily trend is range, but the 4h bias flips LONG with 77.4 confidence, signaling a potential breakout. The 1h ATR of 12.14 confirms enough volatility to fuel a move, while the 15m RSI at 8.49 shows extreme oversold conditions that often precede reversals. The entry zone sits between 1096.28 and 1102.36, with the exact reference at 1099.32, offering a precise risk-defin
SKHYNIX-9.44%
Those who bought in anticipation of UNI launching on CME in six days are feeling the pain right now—the token broke through the $7 support level last night.
The catalyst is real—the CME’s UNI futures launch on October 19. But the price isn’t buying it: UNI surged to $10.94 on September 23 and is at $7 now; I checked the volume, and last night’s sell-off was less than half as heavy as the one on October 8.
The group I’m watching has been waiting for this level—whether the $6.85–$7 range can hold. To truly turn bullish, it first needs to reclaim $7.30–$7.50.
I did the math: six days remain until
post-image
UNI-8.20%
market updates on today $BTC & $XAU
live-cover
LIVE1,925
😂Before going to sleep, I was still thinking I could have pork trotter rice when I got up this morning.
The result was truly an “unexpected surprise”!
Not only was there no pork trotter rice to eat, even the whole pot was taken away…
$VVV #GateX红牛F1新加坡站夺冠
post-image
VVV-8.62%
  • 1
  • 1
Woke up to a waterfall washing my face!
Picked up some spot and will continue swing trading.
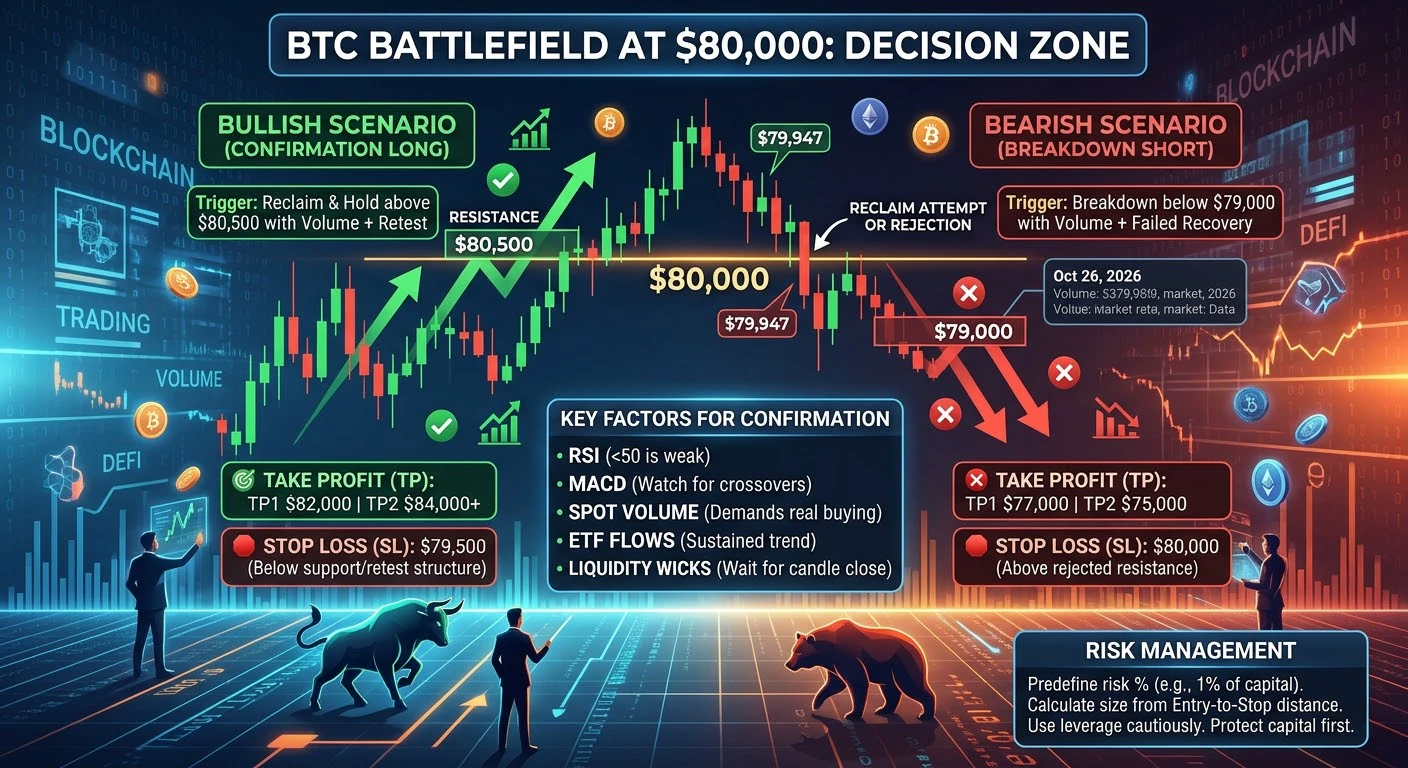
If BTC can't hold $80k, it's dangerous.
post-image
BTC-1.47%
Start exchanging currencies now; through 6.3, exchange once for every one-tick fluctuation, putting it into sgov as you go and fully allocating it,
Invest regularly in voo and q for 3–5 years, hold for 20 years, and retire outright. Thank you, everyone
VOO-0.06%
The Japanese Tokyo index whose trend most closely resembles Bitcoin has multiple similarities in the details. Even if a bull market may be ahead, false breakouts and major pullbacks will shake out the longs. #BTC
post-image
BTC-1.47%
In the current market environment, I believe BTC's pressure has not yet been relieved.
Let's objectively assess three macro indicators first.
First, oil prices.
Oil prices have approached around $110, and this level warrants caution.
The rise in oil prices is not merely an issue of energy costs. More importantly, it could reignite market concerns about inflation. If energy prices continue to rise, the Federal Reserve could become more constrained in its monetary policy, while market expectations for interest-rate cuts could also be suppressed.
Although rising oil prices do not necessarily mean
post-image
BTC-1.47%
USIDX-0.11%
  • 4
US Treasury yields remain high, putting pressure on non-yielding assets, but $BTC remains steady around 84K, with spot ETFs recording net inflows for eight consecutive days. Institutions have not fled; they are simply more sensitive to crude oil prices for the time being.
post-image
BTC+0.57%
When the moving averages are in a bearish alignment, should you chase an oversold rebound? My answer: It can be traded, but only as a “repair,” not a “reversal.”
Take $RA as an example: the current price is 2.1264, down 13.40% over 24h. First, assess trend health: MA5=2.14462 has fallen below MA20=2.24492, forming a standard bearish alignment, indicating that the medium-term trend remains dominated by sellers—an “unhealthy” signal. However, RSI=31.5 is nearing oversold territory, and the current price is close to the lower Bollinger Band at 2.05253, meaning short-term selling pressure has bee
post-image
GT-2.73%
RAY-15.00%
10.13 Morning $BTC
The overall BTC trend remains intact, and 80,000 has not been broken. Support below is very strong. Yesterday, prices surged rapidly on geopolitical news, then profit-taking positions exited in force, sending prices back down for a shakeout. The broader bullish structure remains intact, and the short-term pullback is an accumulation phase within the uptrend. After the retest stabilizes, there is still an opportunity for a second upward move.
Market review: Yesterday morning, amid rising tensions in the Middle East, BTC surged in tandem with risk assets. After reaching a key
post-image
BTC-1.44%
Morning Market Update BTC
live-cover
LIVE1,433
10.13 BTC intraday market
BTC's 3-day chart is showing a high open followed by a decline, closing with a death cross; the high-level shorts on the 2-day/daily timeframes have yet to materialize
The current market is a below-water rebound on the 4-hour timeframe; patiently wait for divergence
There is no pattern on the 15/30-minute charts; support below is at 81200-80800, with 80200 as the 80,000 structural level
If 80,000 breaks, support below is at 79200-78500; a rebound can be caught here
Intraday resistance above is at 81700 82400 83300 $BTC
post-image
BTC-1.44%
Load More

Join 40 M users in our growing community

⚡️ Join 40 M users in the crypto craze discussion

💬 Engage with your favorite top creators

👍 See what interests you

Trending Topics

GateWCTCS9GlobalTradingCompetition

35.75k Views5.58k Discussing

Gate WCTC S9 Global Trading Competition is officially live, crossing asset boundaries across crypto, stocks, and CFDs with an 8M USDT total prize pool. The Lucky Launchpad guarantees a win every time, new users get a 20 USDT futures voucher upon registration, and the Event Contract PK tournament features a prize pool of up to 400,000 USDT.[👉 Read announcement](https://www.gate.com/announcements/article/102133)

GateXRedBullWinsSingaporeGP

174.79k Views6.56k Discussing

WillYouBuyDipInKoreanStocks

62.03k Views1.79k Discussing

View More