
Square
Following
Hot
News
Notifications
Profile
Share your thoughts
placeholder
Article
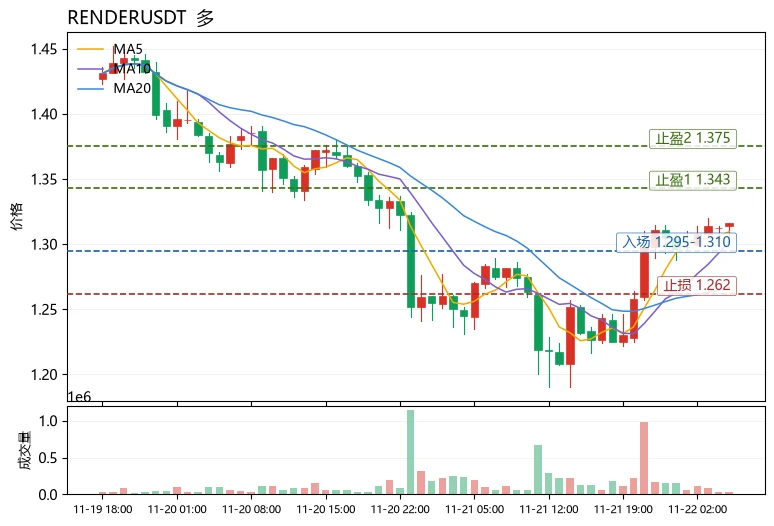
Fear and Greed Index is only 12, and the market is in the extreme fear zone, yet $RENDER bucked the trend and rose 3.62%—this divergence is the most unusual detail in today's market. Funds are not pulling out amid fear, suggesting bulls are quietly accumulating.
Technically, $RENDER is currently at 1.316, with MA5=1.3096 above MA20=1.2666, indicating a bullish short-term moving average alignment; RSI=59.0 is strong but not overbought, while the MACD histogram at +0.009781 maintains bullish momentum. The upper Bollinger Band at 1.34351 is the immediate resistance, and the price is trading near
post-image
RENDER+0.47%
DODO+11.43%
RARE-0.89%
GT is dropping like crazy, screaming, screaming, screaming aoaoj
post-image
GT-2.41%
  • 1
  • 1
Trenches
IDOL
I
bade
b
IDOL
0x3b...ab07
Market Cap
$.
Change
.
24h Vol
$.
Holders
.
PIEVERSE
P
bade
b
PIEVERSE
0x0e...25a9
Market Cap
$.
Change
.
24h Vol
$.
Holders
.
FIONA
F
bade
b
FIONA
B34n...pump
Market Cap
$.
Change
.
24h Vol
$.
Holders
.
CLAUDIA
C
bade
b
CLAUDIA
2j5S...W2ZM
Market Cap
$.
Change
.
24h Vol
$.
Holders
.
Singularity
S
bade
b
Singularity
7R4M...pump
Market Cap
$.
Change
.
24h Vol
$.
Holders
.
#CookBacksFurtherRateHikes
The Fed's Hawkish Warning Could Change the Entire Market Outlook: Bitcoin, Tech Stocks and Gold Face a New Challenge

The Federal Reserve's inflation battle is entering another critical phase, and the latest comments from Governor Lisa Cook have introduced a fresh source of uncertainty across global financial markets.

On November 20, Cook questioned whether September's 25-basis-point rate increase would be sufficient to bring inflation under control. Her warning was particularly important because she highlighted the potential consequences of delaying further action
post-image
BTC-0.65%
MU-13.88%
ANT-8.68%
  • 2
  • 1
#NvidiaDropsNearly14Percent #ShareWeekly
Nvidia has attracted significant attention across global financial markets following a nearly 14% decline in its share price. As one of the most influential companies in the artificial intelligence industry, Nvidia plays a central role in the development of advanced computing, data centers, and AI infrastructure. Its recent decline has raised important questions about investor confidence, technology stock valuations, and the sustainability of the AI investment boom. Because Nvidia is widely viewed as a leading indicator of the broader AI sector, weaknes
NVDA-13.84%
AMD-13.27%
NDAQ-0.95%
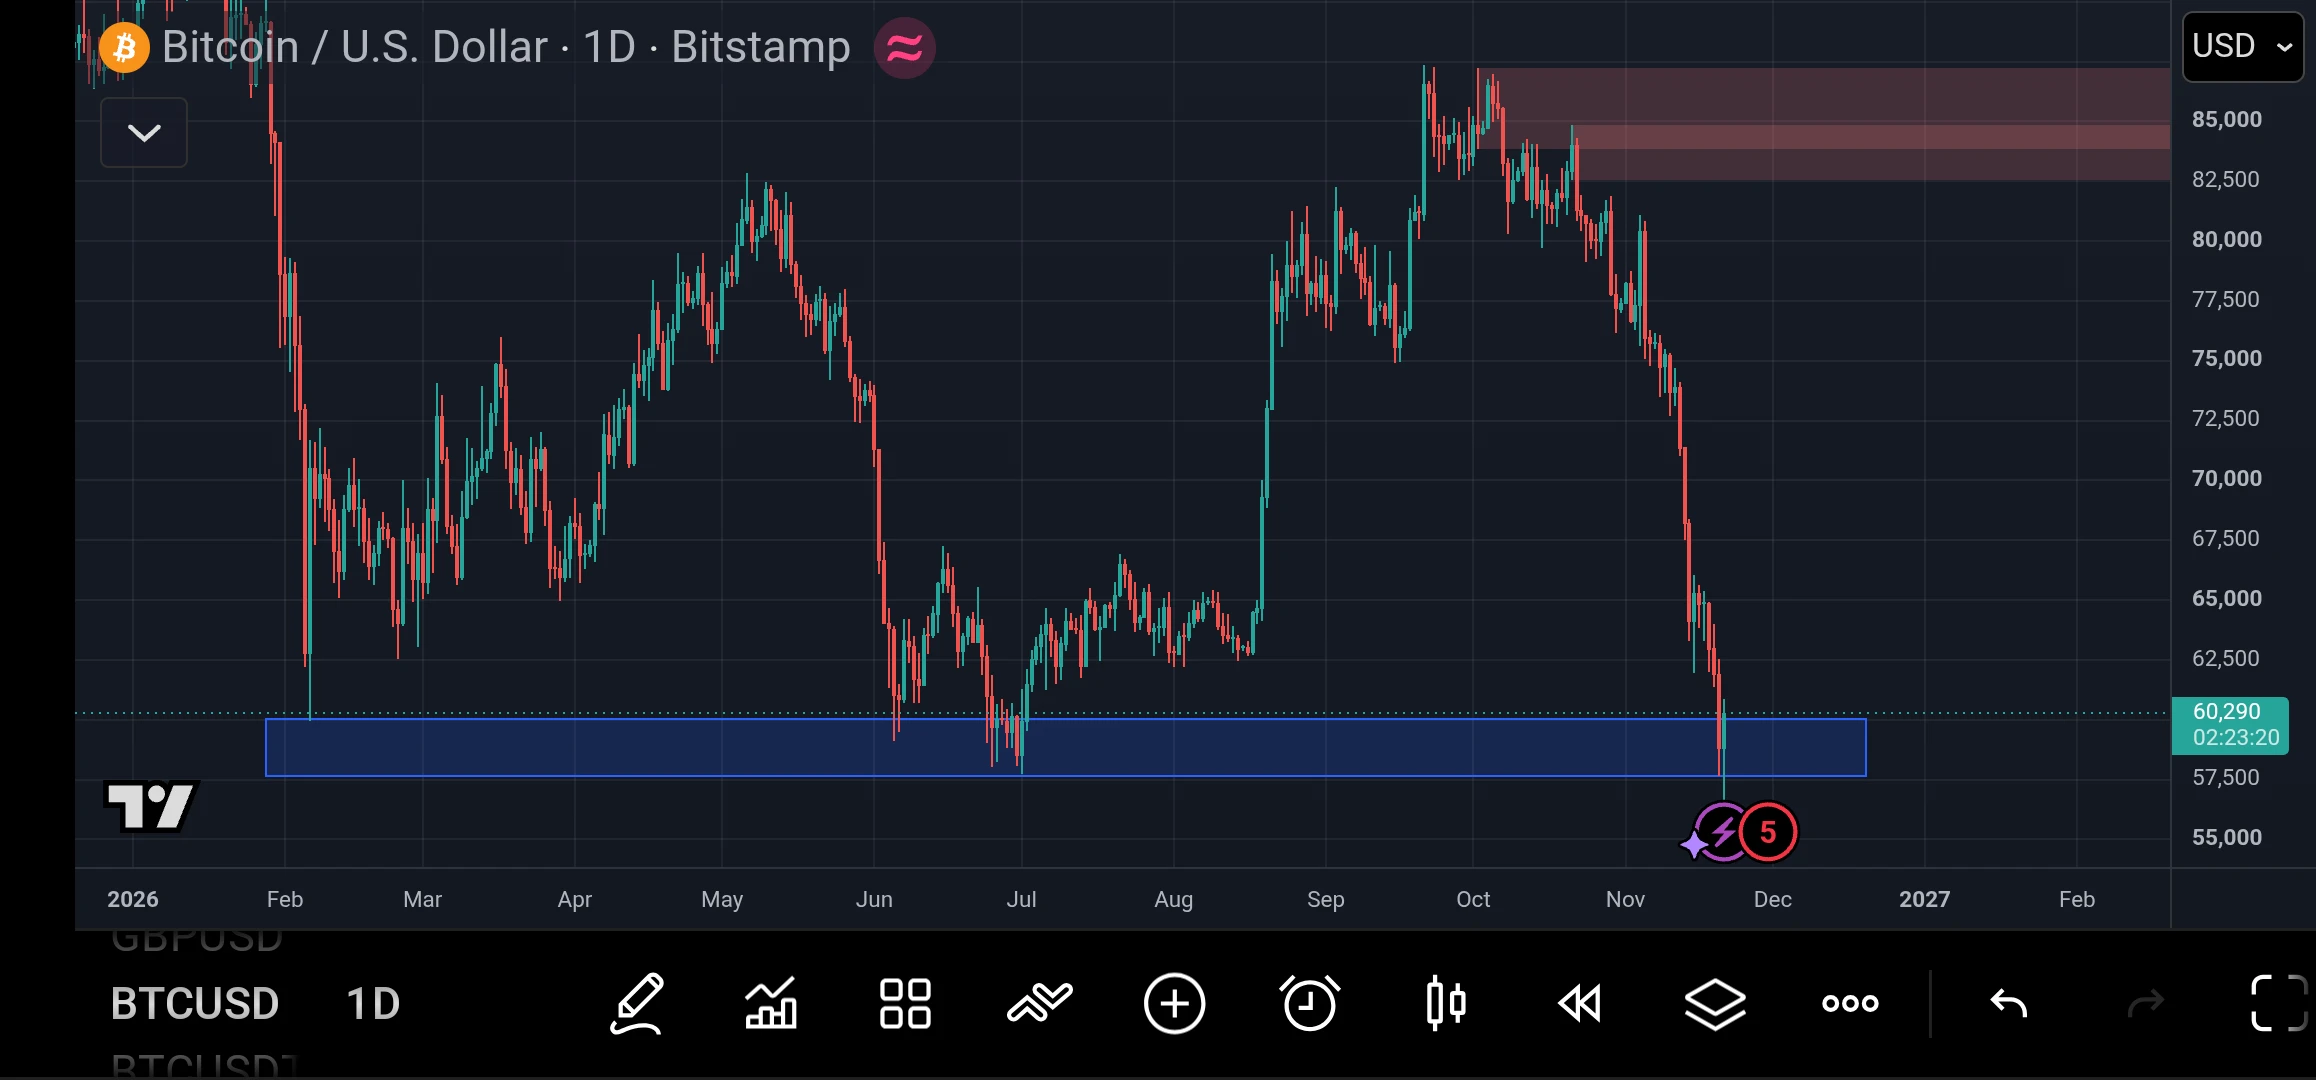
$BTC dipped below $57.5K and bounced to $60.3K. Buyers defended this zone in June and July, but the daily chart still shows lower highs.

I’m watching the daily close. Holding $60K would put $62.5K in play, while reclaiming $65K would give the recovery more weight. A close below $57.5K would leave $55K exposed.

#Bitcoin #BTCAnalysis
post-image
BTC-0.67%
  • 2
Even after a 12-point drop, I still made money—and not by buying the dip. I took this $IRYS trade last Thursday. The day after it came down from 0.0221, I opened a small position around 0.0208, sizing it at 20%, and set my stop-loss at 0.0192—that was a previous structural level, and if it broke, it would mean my read was wrong. The reason for entering was simple: 24-hour trading value was still 35.5M, and volume hadn’t dried up. The drop was part of the broader market sell-off, not because something had gone wrong with the token itself. During the move, it dipped again to 0.0201. I didn’t tou
IRYS-22.27%
  • 3
  • 2
Market Prediction
live-cover
LIVE2,026
BTC-0.67%
Damn, it moves like a Pixiu
post-image
$VVV I’ve noticed that many coins not listed on the spot market are holding up well. Nearly all the spot-listed coins that rallied a lot this round have fallen more than 60%. This one isn’t listed on the spot market and is only down a little over 30% from its high.
post-image
VVV+0.37%
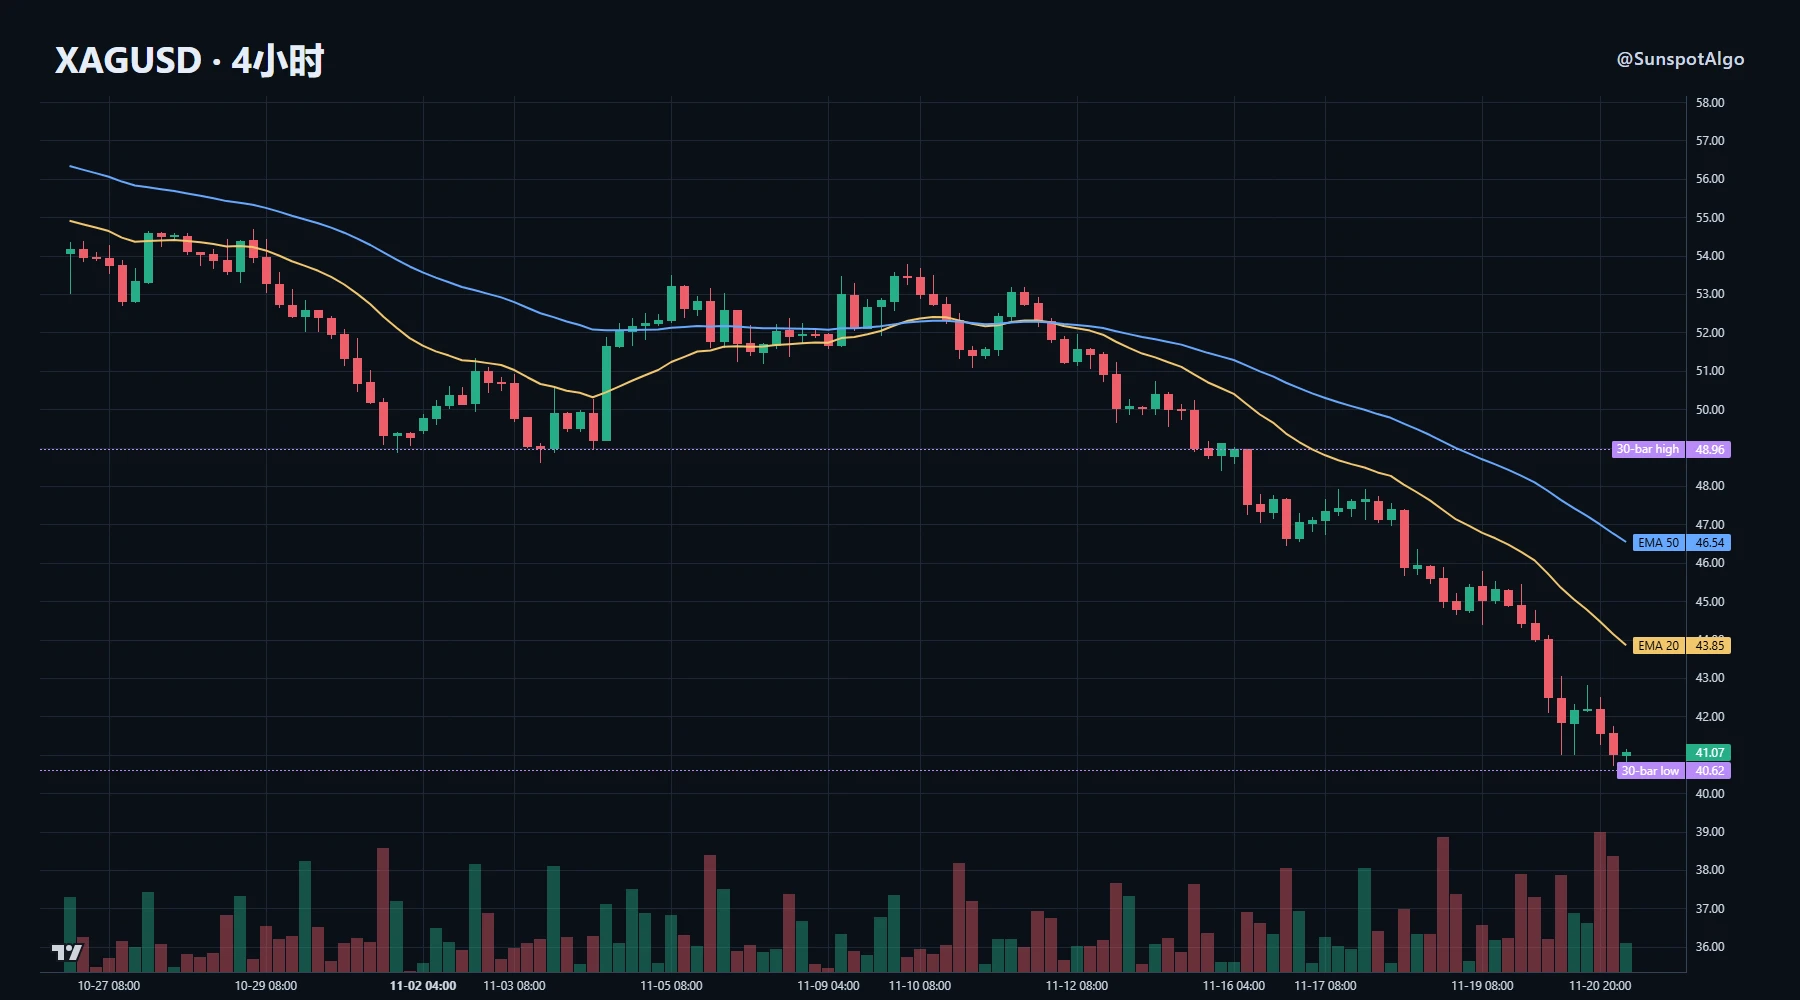
The rhythm of this silver sell-off is more noteworthy than its magnitude.

A roughly 16% drop over 5 days pushed silver to the bottom of its 30-day range at 40.9, while gold fell less than 10% over the same period. The chart’s rhythm has three notable details: the 4H 20-period moving average is at 43.9, while price is at 41.1, a deviation of over 6%; the volume ratio is 1.76, clearly indicating elevated volume; and ATR is at the 92nd percentile of the past 60 candles. The long lower wick around 40.6 was a classic stop-loss sweep: after breaking below that level, price failed to reclaim it, and
post-image
XAG+0.47%
XAU+0.38%
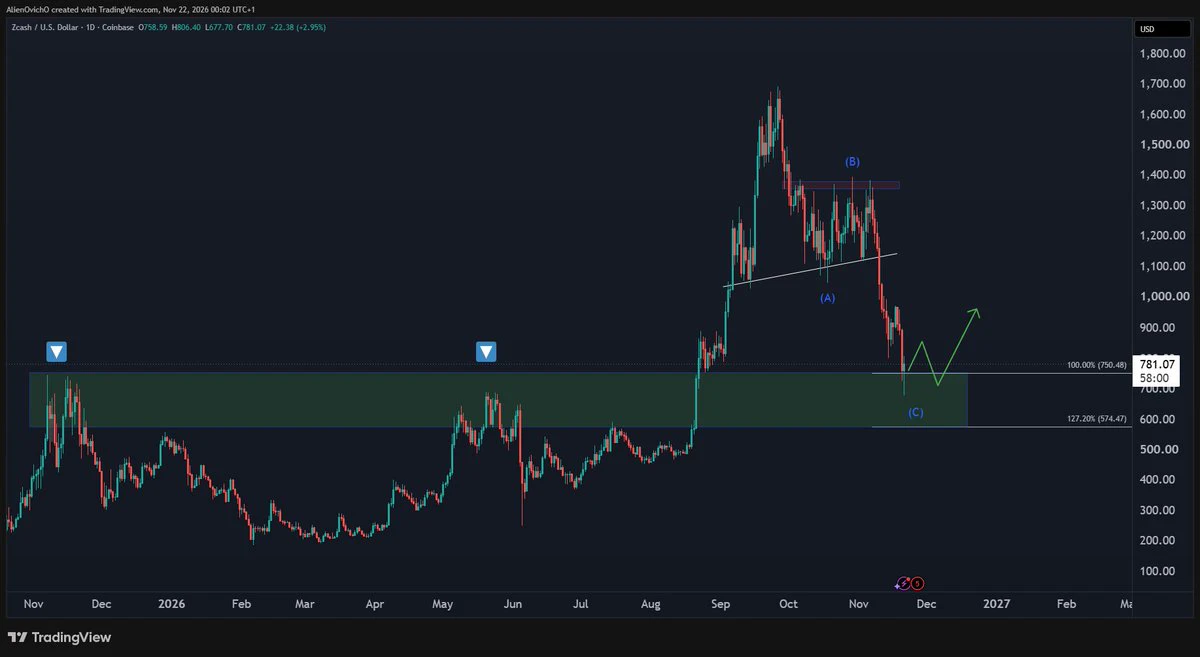
$ZEC is back inside the daily buying zone 🎯
750–575 retests both the 2025 highs and the May 2026 peak, and old resistance is now support.
I expect price to carve a bottom around this area before the 2027 rally.
Accumulating here or waiting lower?
post-image
ZEC+1.16%
$SOL 70.3, 24H +1.28%. The 1h chart is showing some strength, but RSI at 76 is overbought, and volume is only 0.23x the average. The 71.12 resistance overhead has yet to be broken. I’m keeping my eye on this level: I’ll only consider higher prices if it holds above 71.12; a break below 64.87 would turn the short-term outlook bearish. Short-term momentum is still finding its footing, so I’m mostly staying on the sidelines and waiting for a clear direction before making a move. The divergence between the two timeframes is still pronounced, so don’t mistake a short-term rebound for a trend. I’ll
post-image
SOL-0.77%
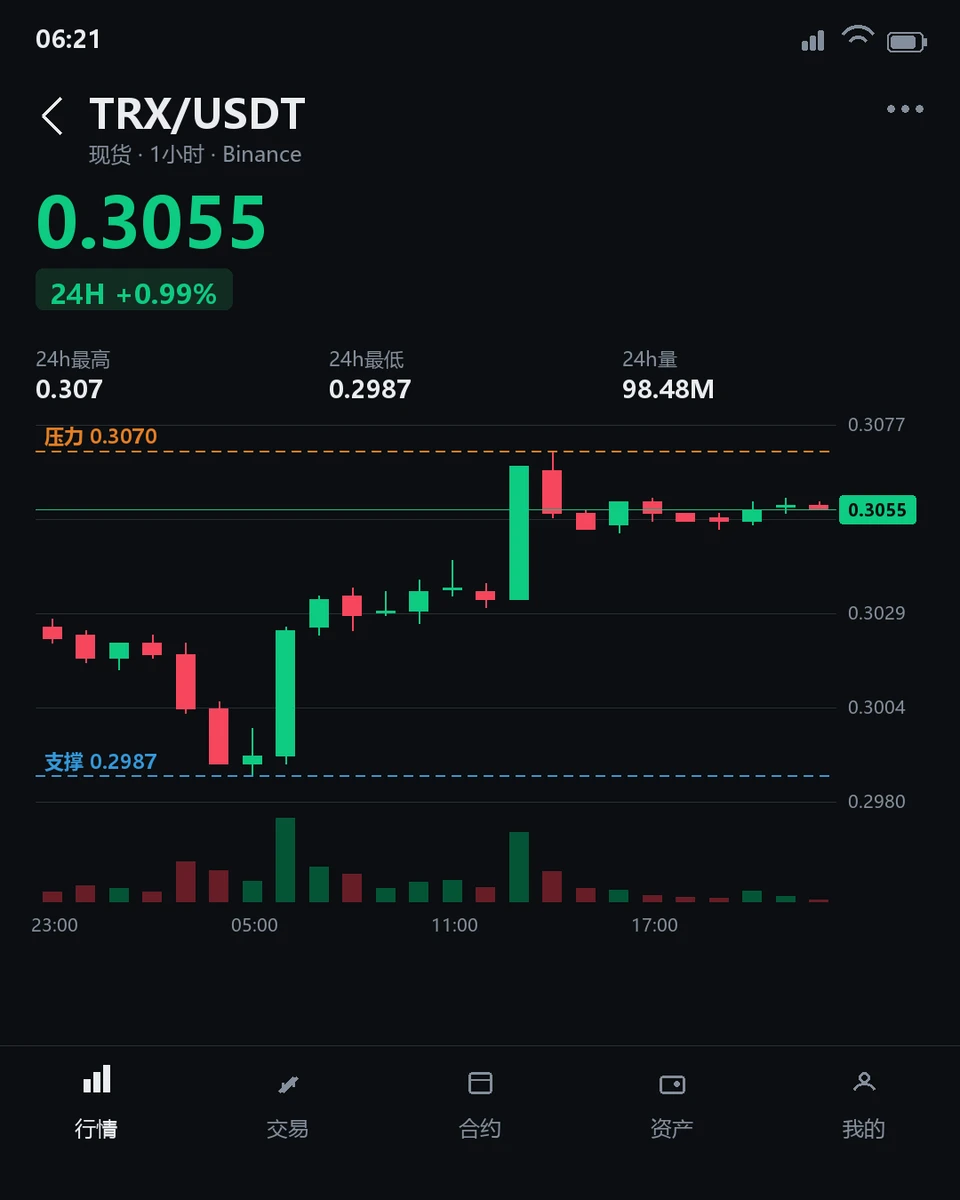
$TRX Is Strong in the Short Term but Weak on the 4-Hour Chart—Which Will Turn First?
$TRX is currently trading at 0.3055, up 0.958% over the past 24 hours, with an intraday range of 0.2987–0.307. The 1-hour chart shows strength, with the price above the EMA20 at 0.30456. The RSI14 is 67.53, in neutral-to-bullish territory, but the volume ratio is just 0.21, far below average, indicating limited participation from short-term buyers. The 4-hour chart remains weak: the price is still below the EMA20 at 0.30594, and the RSI14 at 37.21 has yet to recover from weak territory. Resistance is far above
post-image
TRX+0.42%
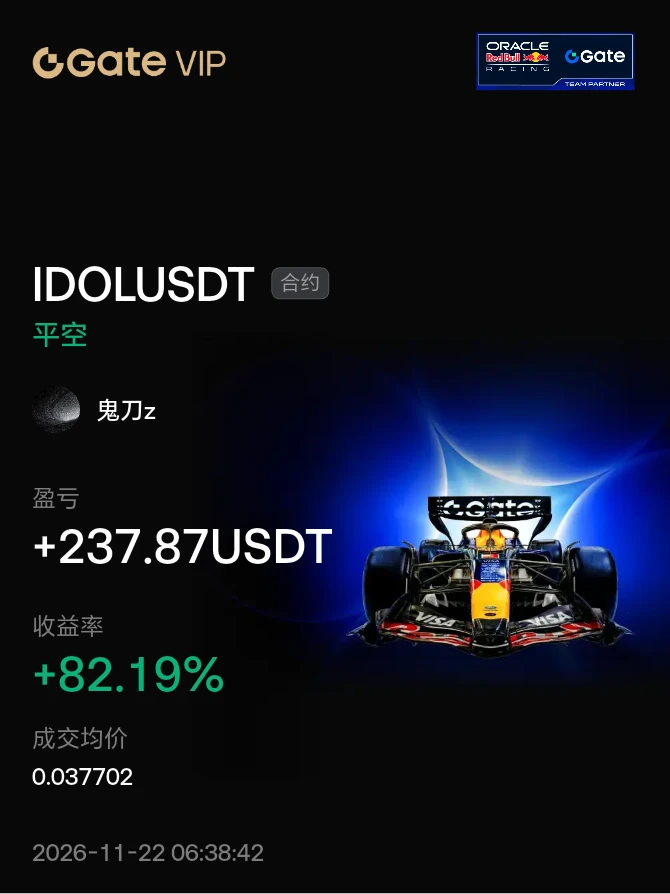
#晒出我的合约收益
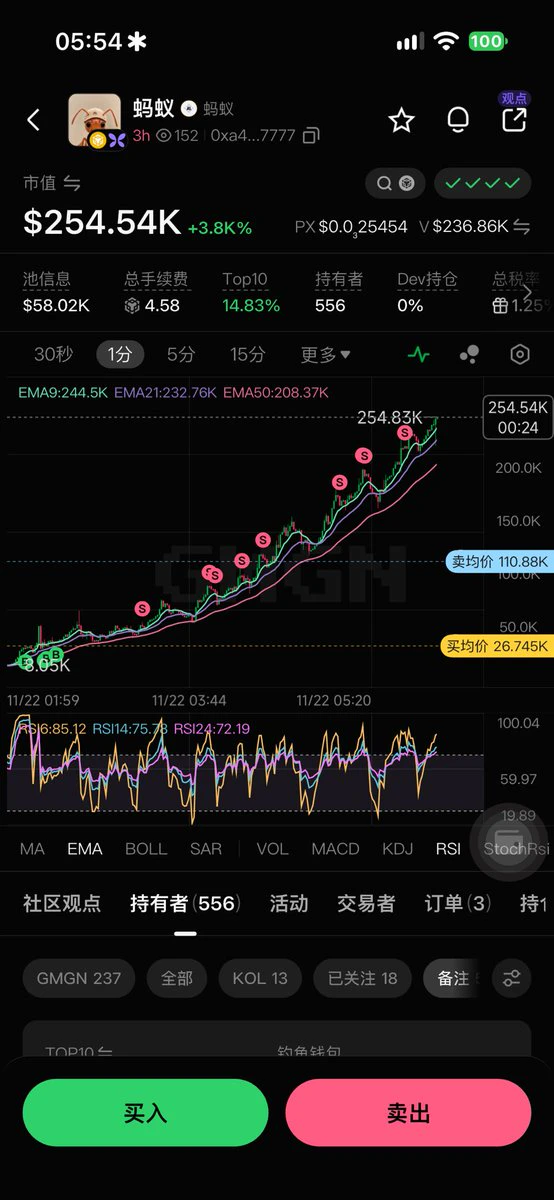
Take a small bite of IDOL
Seize the opportunity$ANT #IDOL
post-image
ANT-8.68%
  • 4
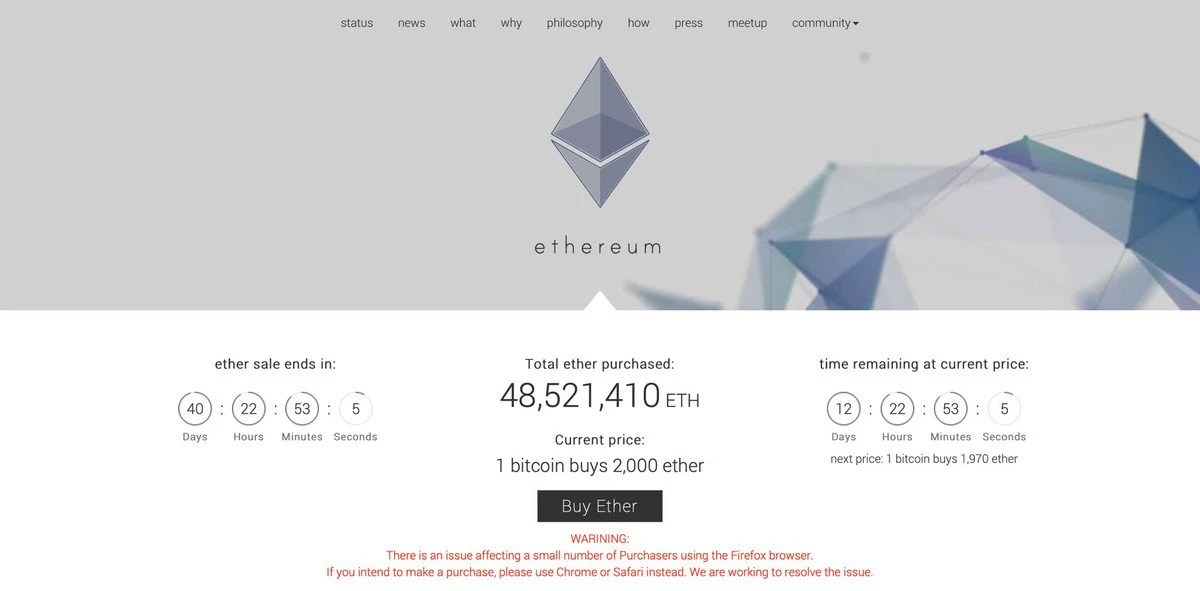
POV:
It’s 2014.
Ethereum is holding its ICO at $0.31 per ETH.
You can purchase up to 2,000 ETH.
post-image
ETH-1.26%
Price on MAGMA continues to edge upward on noticeably subdued turnover. Quiet advances like this often struggle to carry through once they test heavier overhead supply.$MAGMA — LONGEntry: 0.2543TP1: 0.2569TP2: 0.2594Stop: 0.2441
post-image
MAGMA-0.57%
  • 1
$SOL Under pressure—is $68 the next target???$SOL It has broken below the rising wedge, suggesting the price could fall further to $70.20; if selling pressure continues, it could even drop to $68. Will bulls defend these levels, or will the price continue to fall???
post-image
SOL-0.77%
🔹 BTC falls below 58,000 USDT, down 7.75 in 24 hours
live-cover
LIVE21
SPCX-7.38%
TSLA-7.56%
NVDA-13.84%
Madoff’s $65 billion on paper ultimately amounted to just $18 billion in actual money. He was sentenced to 150 years. A Wall Street legend and former Nasdaq chairman, he spent 30 years running a scam right in the middle of industry forums. The details hold the answer: the shinier the title, the less anyone checks the books. Next time someone cites “former chairman” as an endorsement, ask where their money is custodied. What do you think?
post-image
  • 2
  • 1
$BLESS ’s short opportunity is here—the 1-hour downtrend isn’t over yet, and the price has already fallen below MA25 on the 15-minute chart. It’s the right time to short with the trend. The breakdown was clean and decisive, delivering a 246% gain—profits secured.
The two assets to watch closely today: $DODOX and XRP.
$BLESS remains bearish, with a tighter stop-loss. Entry range: 0.012807–0.012905; take-profit targets: 0.01210–0.0115; stop-loss at 0.013292. This rebound is weak and is most likely a bull trap ahead of the next sell-off, so bears have reason to be optimistic.
But stay alert: if
post-image
314
314314
Pump.Fun
MC:$2.19KHolders:1
0%
BLESS-2.00%
Load More

Join 40 M users in our growing community

⚡️ Join 40 M users in the crypto craze discussion

💬 Engage with your favorite top creators

👍 See what interests you

Trending Topics

BTCBreaksBelow60K

2.1M Views30K Discussing

BTC fell below $60,000 on November 20 for the first time since July, alongside a tech stock selloff and broader pressure on risk assets. Will $60K become resistance, or can BTC quickly reclaim it? What price or volume signals would convince you that selling pressure is easing?

GateDirectIPOPhase3ANTAllocates92100Shares

794.1K Views4.9K Discussing

NvidiaDropsNearly14Percent

332.6K Views7.6K Discussing
View More