Square
Following
Hot
News
Notifications
Profile
Share your thoughts
placeholder
Article
In BTC trading, how can you develop a truly actionable trading plan?
Many BTC traders study the market every day, analyzing candlesticks, trading volume, and various technical indicators, and often discuss whether the market will rise or fall next. But when it comes time to trade, they often run into the same problem: no clear entry criteria, stop-loss decisions made on the fly, and no idea when to exit a profitable trade.
That’s why some people can study the market for a long time, yet their account performance remains inconsistent.
To build a truly actionable trading plan, you can start with
post-image
BTC-0.65%
Nov. 8 analysis: Bitcoin and Ethereum’s decline is nearing its end. Weekly candles have closed lower for six consecutive weeks. This decline is completely in line with my expectations and is also a pullback confirmation in the weekly bull market trend. Going forward, watch for a daily EMA golden cross, the price holding above the middle Bollinger Band, and a weekly candle closing higher. The bull market is about to start recovering. Current levels are all golden entry points, so cherish the opportunities. Ethereum’s resistance levels are 2500, 3000, 3800, and 4100; Bitcoin’s are 80k and 100k.
BTC-0.67%
ETH-1.26%
Trenches
ZIG
Z
bade
b
ZIG
0x8c...1145
Market Cap
$.
Change
.
24h Vol
$.
Holders
.
STONK
S
bade
b
STONK
6GmA...UNgx
Market Cap
$.
Change
.
24h Vol
$.
Holders
.
CLAUDIA
C
bade
b
CLAUDIA
2j5S...W2ZM
Market Cap
$.
Change
.
24h Vol
$.
Holders
.
IDOL
I
bade
b
IDOL
0x3b...ab07
Market Cap
$.
Change
.
24h Vol
$.
Holders
.
FLOAT
F
bade
b
FLOAT
Bv1a...BMmr
Market Cap
$.
Change
.
24h Vol
$.
Holders
.
The Central Bank of Russia: Starting November 17, ordinary people can buy Bitcoin
Limit: 300k rubles per person per year
I did the math—about $3,700, based on Bitcoin at $75,000 right now
0.049 BTC a year
Save for 20 years and you’ll have a whole one
The bros opening 20 brokerage accounts are already on their way
post-image
BTC-0.67%
  • 1
TIA turned on Fibre on mainnet in October, about 15x more data capacity for rollups.
Inflation was also cut by a third with the Lotus upgrade.
Every monthly close since December sits between $0.29 and $0.48. Almost a year of basing.
LT 💚
TIA-0.60%
Quite possibly the most undervalued token you could scoop up on this fine, sunny Sunday ☀️ 🚀
post-image
TOKEN-0.16%
  • 1
#PIEVERSE

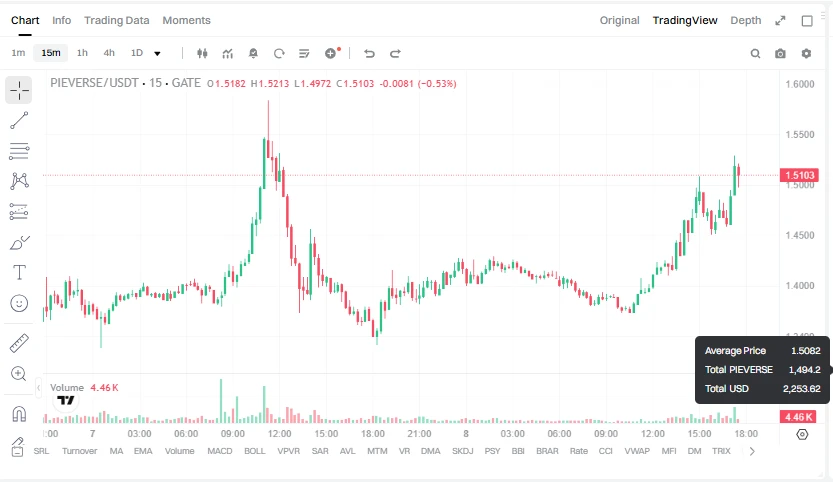
PIEVERSE at $1.4049: Is a Nearly Flat Market Hiding a Bigger Supply Risk?

Imagine watching PIEVERSE throughout the day. The price moves slightly higher, trading activity continues, but there is no strong breakout or sudden change in market direction. Should traders interpret this as strength, or is the market simply waiting for its next major catalyst? That is the important question behind PIEVERSE's latest price action.

What Is the Market Showing?

At 01:30 UTC on November 8, 2026, PIEVERSE/USDT was trading at $1.4049, recording a modest 0.1% increase over the previous 24 ho
post-image
PIEVERSE+0.50%
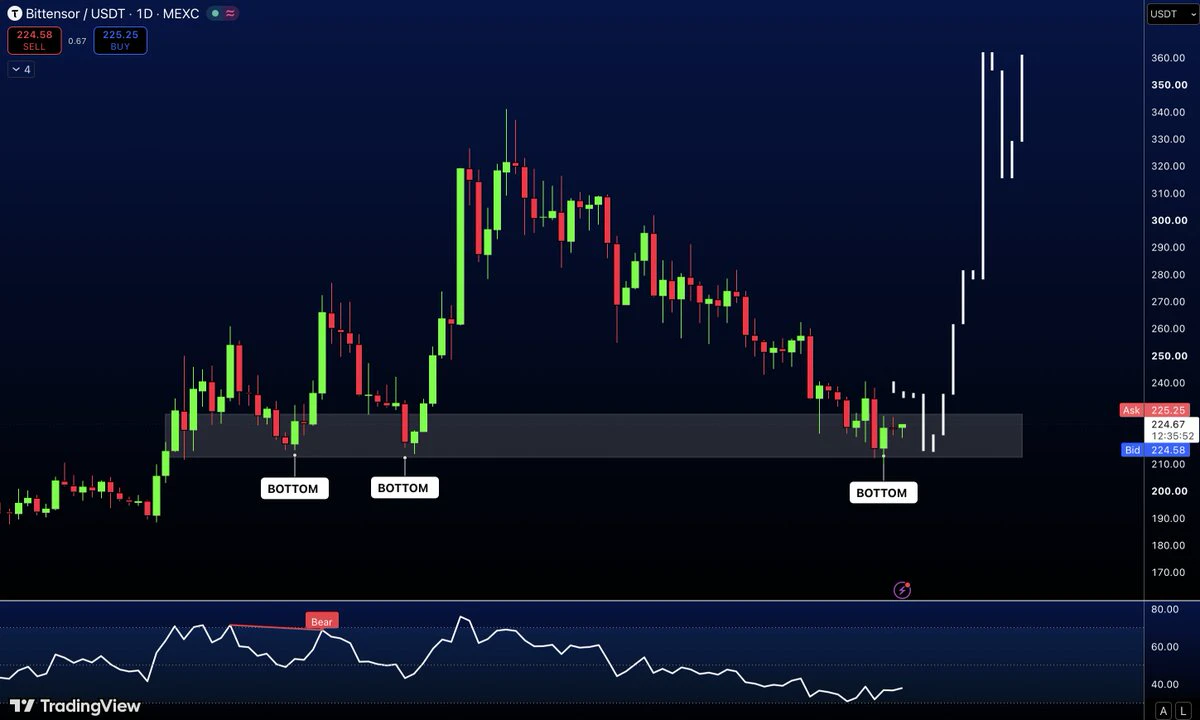
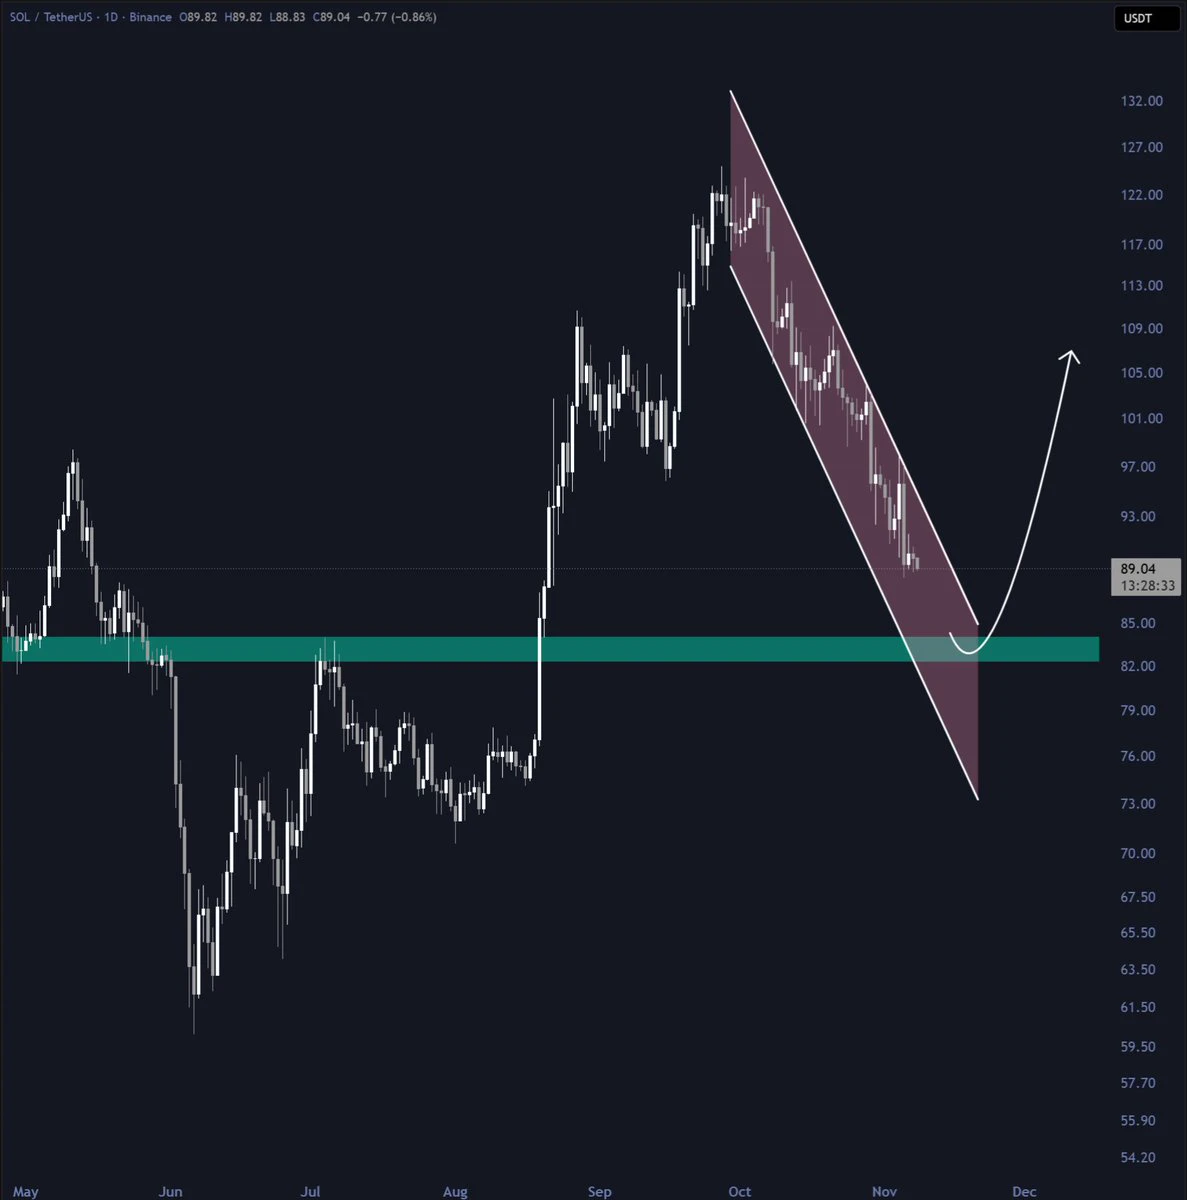
$SOL is approaching its July high
This is a level where we could see the strongest reversal
post-image
SOL-0.77%
#WCTCS9 #广场交易达人 Down 16% in one week! War premium collapses: three oil price scenarios for next week

WTI settled at $90.83 and Brent at $98.32—the daily gain last Friday was only 0.34%, but that doesn't mask the brutal week: WTI fell about 12.8% for the week, while Brent dropped about 16.4%, its biggest weekly decline since 2020.

One week ago, the market was still pricing in a premium for the situation in the Middle East; one week later, oil prices had shed a full $20.

【Why the collapse: three forces combine】

First, progress in U.S.-Iran talks caused the war premium to collapse instantly.
GAS-0.57%
  • 4
MARKET UPDATE
live-cover
LIVE1,419
$SOL The liquidation map for the past 7 days shows:
If SOL rises to $91.7, cumulative short liquidation intensity across major exchanges is $138 million.
If SOL rises to $94.2, cumulative short liquidation intensity across major exchanges is $295 million.
If SOL falls to $87.9, cumulative long liquidation intensity across major exchanges is $97.22 million.

Trading strategy:
Place a long order at $87.9, with a take-profit range of $91.7–$300. $SOL ‌
SOL-0.74%
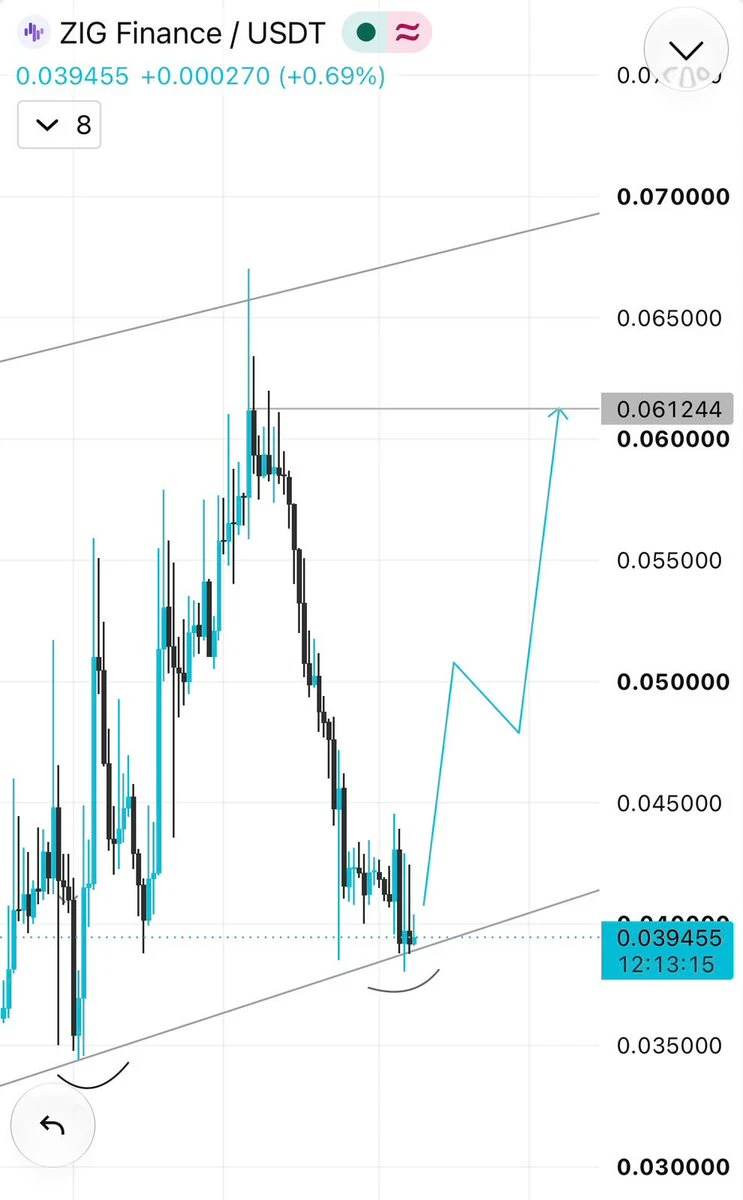
$ZIG holding key support at $0.039
→ Targets: $0.05–$0.061
→ EVM upgrade complete, buybacks ongoing
→ London summits spotlight tokenization, liquidity & institutional capital
Big developments for onchain finance.
post-image
ZIG-8.79%
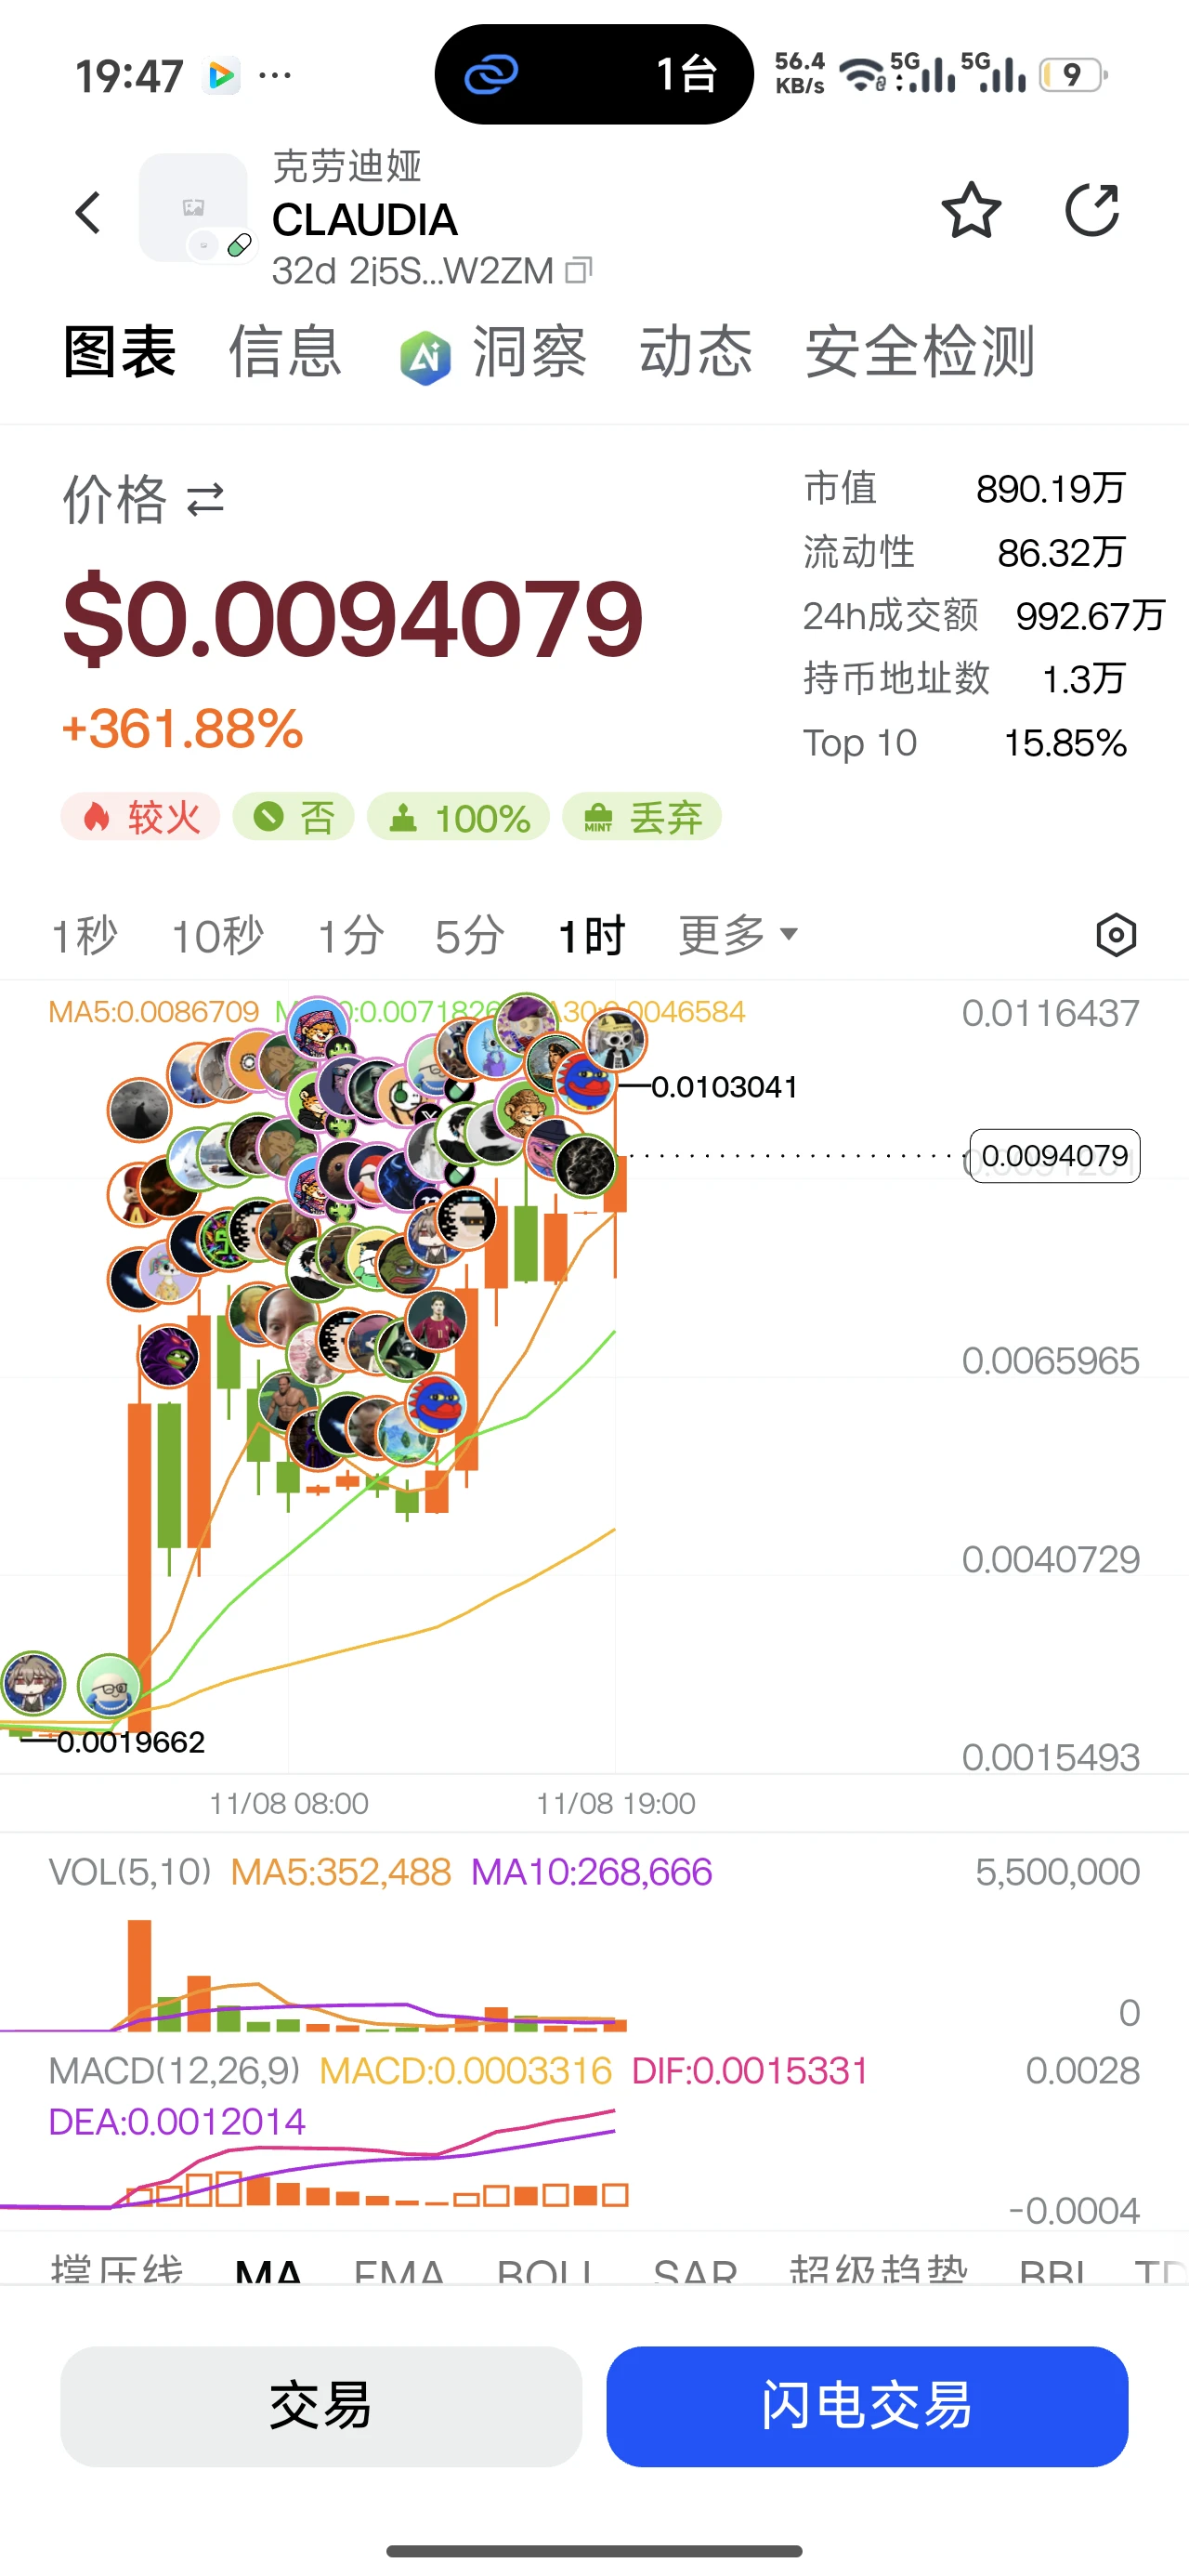
$CLAUDIA Aren’t you running yet
post-image
Every time you switch AI tools, you lose your context, preferences, and history.
Walrus Memory is changing that.
Built on $SUI , it lets you carry encrypted, user-controlled memory between AI agents.
The next AI revolution isn't just smarter models. It's memory you actually own.
WAL-0.80%
SUI-1.05%
Gate Square Stock Talk Season: Share Your Views, Win GT and Stock Rewards https://www.gate.com/campaigns/6898?ref=VLARBF1YAG&ref_type=132
post-image
GT-2.41%
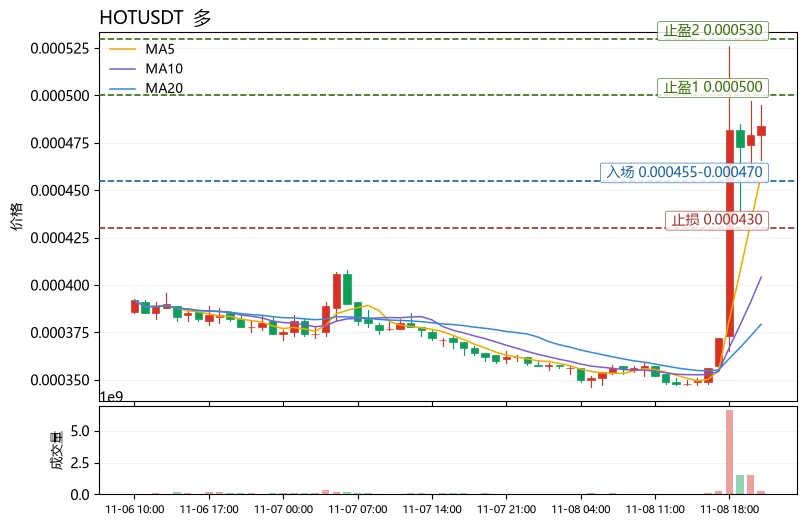
The most unusual detail in today's market isn't the top gainers themselves, but the funding rates: $HOT surged 32.97% in 24h, yet its funding rate is -1.1460%. The price is above the Bollinger upper band near 0.000480069, with RSI as high as 85.2, while shorts are still paying to short. Compared with other active coins in the same group, $HYPE is up just 0.31% in 24h, with RSI at 53.2; $WLD is down 3.45% in 24h, with RSI at 36.1 and MA5 below MA20. Of the three, only HOT has MA5>MA20, expanding bullish MACD bars, and a deeply negative funding rate, giving it a clear relative strength advant
post-image
HOT-1.97%
HYPE+0.24%
WLD-5.61%
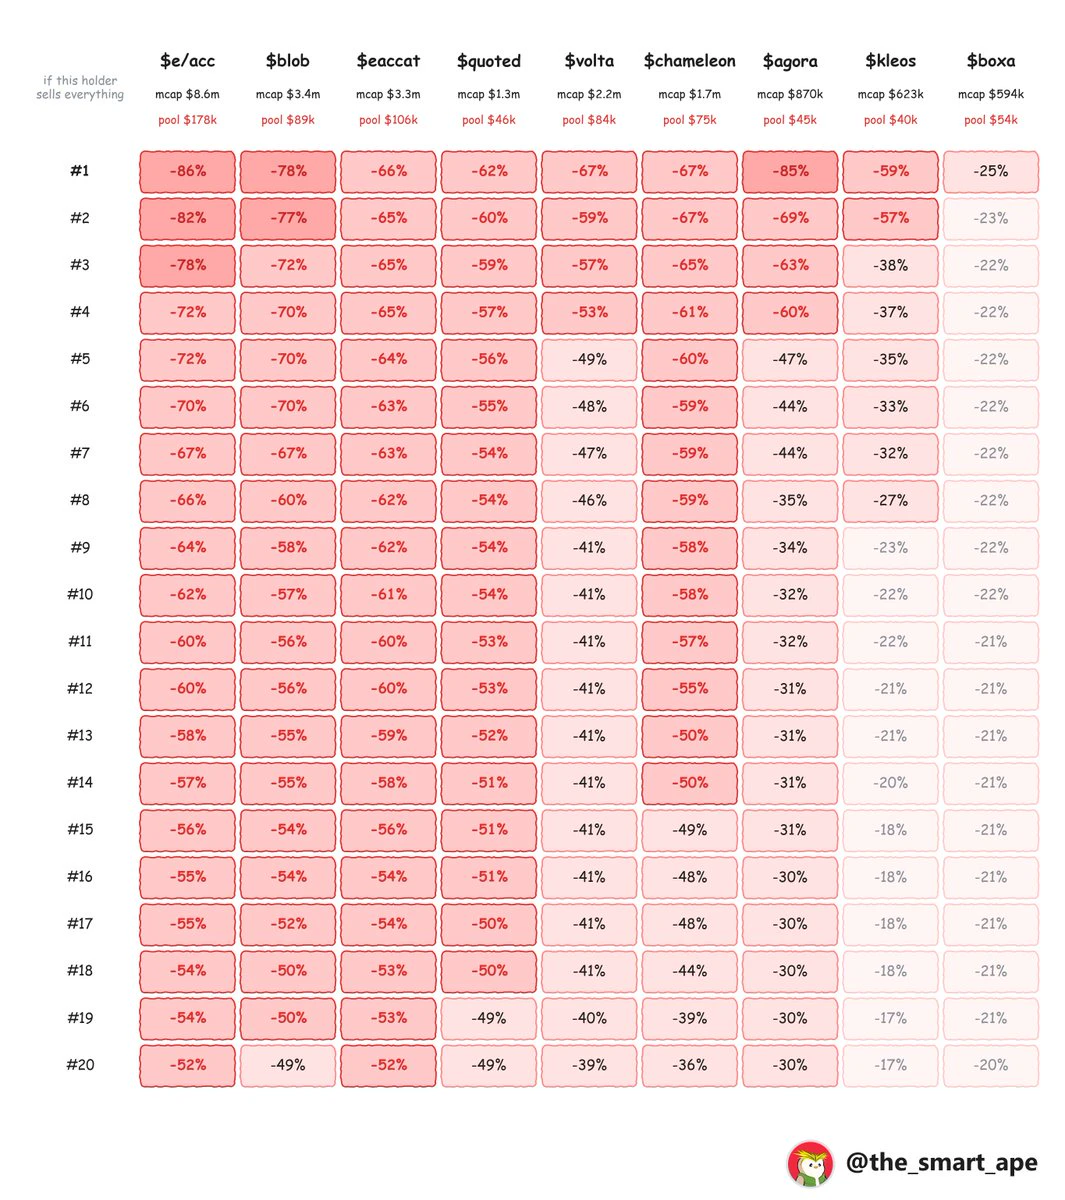
the main problem on @Enter_Elysium is liquidity.
i took the top 20 holders of 9 top coins and checked what happens to the price if one of them sells everything?
if a $3m coin has $100k of hype in its pool, the most anyone can take out is around $100k. the market cap shows the last price, not what you could sell for.
post-image
#CPI数据前瞻 #作手分析 #WCTCS9
🔥 U.S. October CPI is coming up! Has all the bad news already been priced in? Can this inflation report still trigger a selloff?

Trading watchlist: $BTC $ETH $NVDA $GOOGL $XAU

At 21:30 Beijing time on November 10, the U.S. will release its October CPI data.

September CPI rose 3.7% year over year. The market expects headline CPI to rise about 0.24% month over month in October, and core CPI to rise about 0.2%.

I have a view on this CPI report that differs from the market consensus: If inflation comes in below expectations, the market could see a rebound; even
post-image
BTC-0.67%
ETH-1.26%
NVDA+2.80%
GOOGL+0.72%
XAU+0.38%
  • 9
  • 1
#WCTCS9 #广场交易达人 Gold bulls and bears battle; crude oil consolidates and recovers

Spot gold: Gold formed a volatile pattern this week, rebounding from its lows before rallying and then pulling back. The weekly candle had a long upper wick, showing that buying support remains at lower levels, while selling pressure overhead is also significant.
Spot gold is currently consolidating near $4,070/oz. After dipping to around 4,029 intraday on Friday, it rebounded, with bulls and bears locked in a short-term tug-of-war.
Gold remains driven in the short term by interest rate expectations and the dolla
CL-1.83%
  • 3
Load More

Join 40 M users in our growing community

⚡️ Join 40 M users in the crypto craze discussion

💬 Engage with your favorite top creators

👍 See what interests you

Trending Topics

USCPIDataIncoming

7.61k Views1.57k Discussing

The U.S. October CPI report will be released on November 10 at 8:30 a.m. ET. September CPI came in at 3.7% year over year, and markets will be watching closely for signs that inflation is cooling, especially in core CPI. A softer-than-expected reading could strengthen rate-cut expectations, while hotter inflation may pressure risk assets through higher Treasury yields and a stronger dollar. How do you think this CPI print will move $BTC, U.S. stocks and gold?

USAIStocksHitHard

26.63k Views3.72k Discussing

USNonfarmPayrolls

49.41k Views4.46k Discussing

View More