







Square
Following
Hot
News
Profile
Share your thoughts
placeholder
Article
$ETH Hits Targets! 💥🎯
post-image
ETH+1.62%
first day calling on @Pumpfun
bullish tek!
post-image
BREAKING: Centrifuge tokenizes New York Life Investment Management's actively managed U.S. high-yield corporate bond strategy as $HYB on Stellar.
Allowing the freely transferable $deHYB token to serve as collateral across lending and fixed-rate markets in DeFi.
@StellarOrg
CFG-4.38%
XLM+0.49%
Let’s go!!! 🚀🚀🚀
CPI Comes in Hotter Than Expected
live-cover
LIVE43
Everyone watching SYMBOL long is about to get blindsided by a sharp drop.

$MU /USDT - SHORT

Trade Plan:
Entry: 927.98 – 934.84
SL: 964.38
TP1: 906.68
TP2: 890.19
TP3: 865.47

Why this setup?


Debate:
Are we testing TP2 or is 994.50 about to flip this setup?

⚠️ Personal market analysis only. NFA — manage risk and DYOR.
Educational content, not investment advice or a recommendation to buy, sell, deposit, or withdraw any asset. No paid promotion or referral/affiliate links.
MU+2.37%
$INJ is heading straight toward a major selling-pressure zone
INJ has rebounded strongly from around 7.00 and is now approaching the 8.50–8.70 resistance zone. This is exactly where I stop chasing the rally and start watching for a potential price rejection. Short setup entry zone: 8.30–8.60Next target price: 8.20TP1: 8.05TP2: 7.80Final target: 7.55Stop-loss: 8.95The upward momentum is strong, but the price is now approaching the same zone where sellers stepped in previously. If INJ fails to establish a firm foothold above 8.50–8.70, a strong rejection candle could trigger a rapid pullback. A
post-image
INJ+11.44%
Recent update | On a steady winning streak every day
There is really no need to pursue a spectacular moment; not stagnating, not retreating, and steadily moving forward is the best answer to life.😁
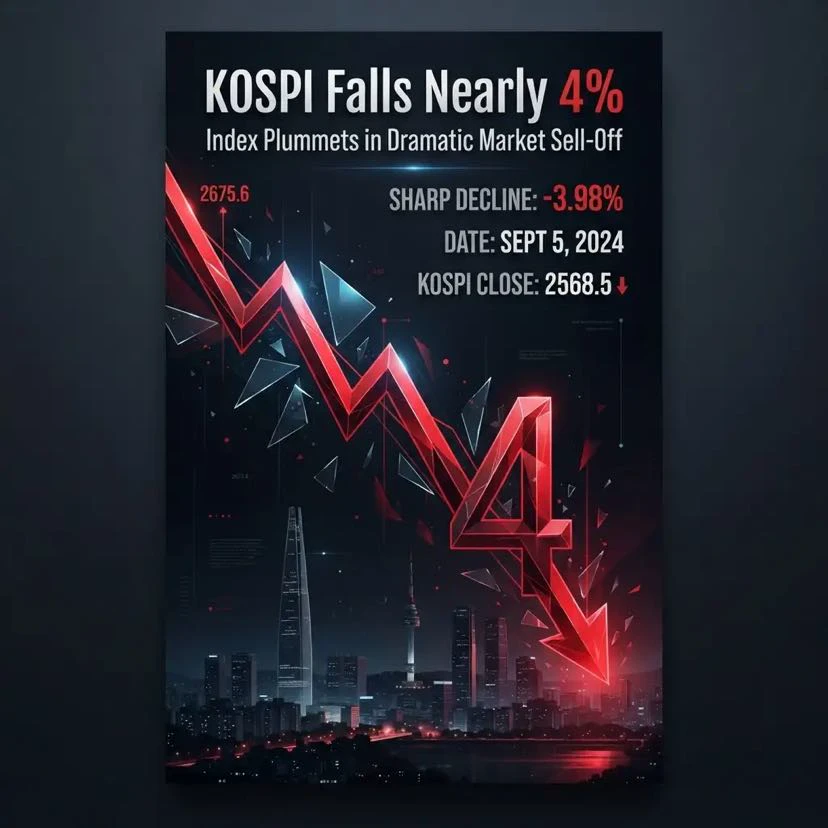
#日韩股集体大跌
( new streamer) market overview
live-cover
LIVE1,528
SOL oscillated downward from the earlier high of 124.99, with the intraday low dipping to 100.51 before a slight rebound, reaching a high of 106.49. This rebound is merely a minor corrective bounce during the decline; the overall broader downtrend channel remains intact, and a rebound to resistance presents an opportunity to enter short.

From the chart, the daily highs have been gradually moving lower, and the bearish trend structure remains intact. This rebound is only a brief pause amid the decline. MACD remains weak and trending downward, while heavy pressure from previously trapped posit
post-image
SOL+1.74%
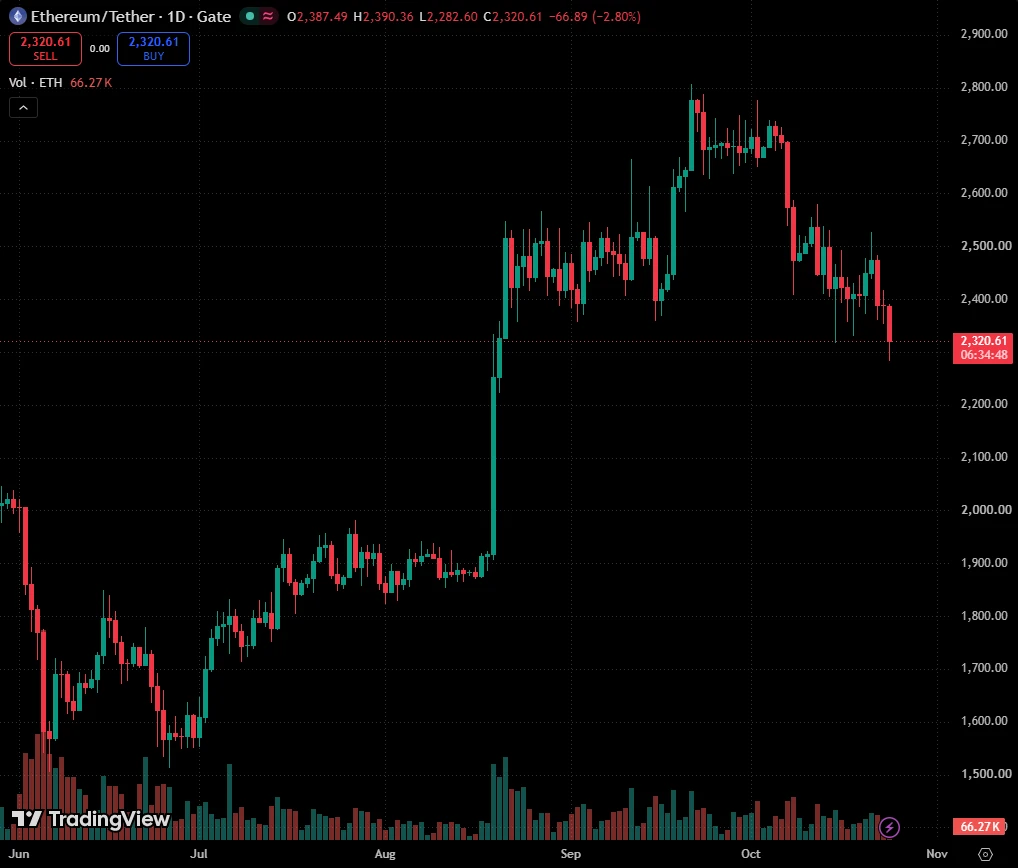
At midday, we remained firmly bearish across the board. BTC rebounded to the 81700 resistance level but met resistance, ETH rebounded to 2390 but came under pressure, and ZEC rebounded to around 1120 but also faced resistance. Short positions were opened simultaneously. BTC’s target was below 80000, ETH’s around 2320, and ZEC’s around 1070. As the U.S. stock market opened, the market moved lower as expected, with prices continuing to fall. BTC hit a low of 79818, ETH pulled back to around 2320, and ZEC dipped to 1075. BTC captured 1300 points of room, ETH secured 40 points, and ZEC secured 40
BTC+0.59%
ETH+1.40%
• Stages of investor acceptance after Fed news
• The point: Show in one paragraph how a crypto investor's thoughts change over the course of one day:
1. 12:29 UTC — “Well, that’s it, PPI will come in line with forecasts, we’re flying to $100k!” 🚀
2. 12:31 UTC — “Okay, PPI is higher than expected... But that’s good for BTC as a safe-haven asset, right?” 🫡
3. 13:00 UTC — “Well, a sausage factory is always looking for new employees” 🏭
#USCPISoon #ShareWeekly
BTC+0.60%
$ZEC short fighting a fresh bullish reversal.
Pair: $ZEC /USDT
Direction: SHORT
Entry: 1135.67
TP1: 1090.48 +4.0%
TP2: 1060.36 +6.6%
SL: 1195.92
- Steady decline from ~1280 through all three MAs, into a sharp final push down, now a strong green reversal candle
- RSI snapped from ~20s to ~55-58 one of the sharpest recoveries of the week
- MACD still negative overall, but the last bar just flipped green fresh cross, same timing as CRCL/ZEC-last-week
$ZEC ‌
ZEC+7.75%
$NEAR NEAR Breaks Out of a 4-Year Descending Channel: TP1: $11
NEARUSDT
Weekly Time Frame:
NEAR (1W, log scale) is breaking out of the descending channel that has defined price action since the 2022 top, and the weekly candle is now pushing above the upper boundary.
What the chart shows:
After the 2022 high (~20.6), price spent years in a descending channel, bottoming around the 0.9 area in early 2026.
Since that low, price has risen sharply and is now trading at ~5.4, above the channel’s upper trendline.
The breakout is happening at the 2024 volume profile POC (~5.2), so the trendline and a h
post-image
NEAR+11.14%
peak lighting on the streets of north kolkata
Does a bullish moving-average alignment always mean you should chase long positions?
Not necessarily. The key is whether the price’s position relative to the moving averages is synchronized with momentum. Take $ZEC as an example: the current price is 1235.97, with MA5=1225.24 above MA20=1138.62, forming a standard bullish alignment and indicating a healthy trend direction; however, RSI has reached 70.2, nearing overbought territory, while the price is hugging the Bollinger upper band at 1248.36, making the risk-reward of chasing short-term highs unattractive. A reusable approach is: use movin
post-image
ZEC+7.81%
XPL+8.96%
INJ+11.40%
Some dinners aren’t about eating
but about having food to eat in the future #WorkplaceDinners
post-image
I turned off the $ZEC gainers-and-losers rankings first, and only one issue is left on the chart: $ZEC remains strong, while the crowded positioning is already out in the open.
$ZEC is currently at 1,241.91, up 8.09% over 24 hours. The 1-hour support is 1,075, resistance is 1,248.4, and current volume is 0.55 times the average volume of nearly 20 candles.
My view for now is this: I acknowledge that the trend is strong, but what matters next is not how much higher it can go, but whether anyone steps in during the first pullback. Moving higher does not count as a win just because it touches 1,2
post-image
ZEC+7.81%
The answer is always hidden in the process that time brings. I’ve already made it extremely clear—the hints have been laid out plainly. Since June, it has felt exactly like hitting whatever I aim at and winning every battle; there’s only one word for it: “awesome”!
$BTC #美国9月CPI超预期
BTC+0.59%
Load More

Join 40 M users in our growing community

⚡️ Join 40 M users in the crypto craze discussion

💬 Engage with your favorite top creators

👍 See what interests you

Trending Topics

USSeptemberPPIBeatsExpectations

91.35k Views1.87k Discussing

US September PPI came in at 6.3% YoY, well above the 5.3% market expectation, pointing to renewed producer-side inflation pressure. Weekly jobless claims were 199K, broadly in line with forecasts. Could hotter inflation further reduce room for rate cuts, and what does it mean for $BTC, US stocks, and gold?

DrLinHanSpeaksAtOxfordUnion

135.63k Views1.86k Discussing

JapanAndKoreaStocksPlunge

47.27k Views1.76k Discussing

View More