






Square
Following
Hot
News
Profile
Share your thoughts
placeholder
Article
$Lobster has successfully bought the dip multiple times and is preparing to sell everything when the price surges.
龙虾+10.06%
Oct. 14, Wednesday — Zhong Ling’s morning BTC/ETH outlook
The CPI data will be released tonight. Betting on the bullish or bearish reaction at the exact moment the data comes out is basically no different from taking blind risks. From the chart, the 4-hour price has already fallen below the Bollinger middle band, and the bullish structure has been broken, but that does not mean the market will necessarily undergo a deep correction. It would also be unreasonable to insist on expecting a sharp crash. The 4-hour and 1-hour KDJ indicators are both in sensitive zones and are about to form a resonan
post-image
BTC+0.61%
ETH+0.86%
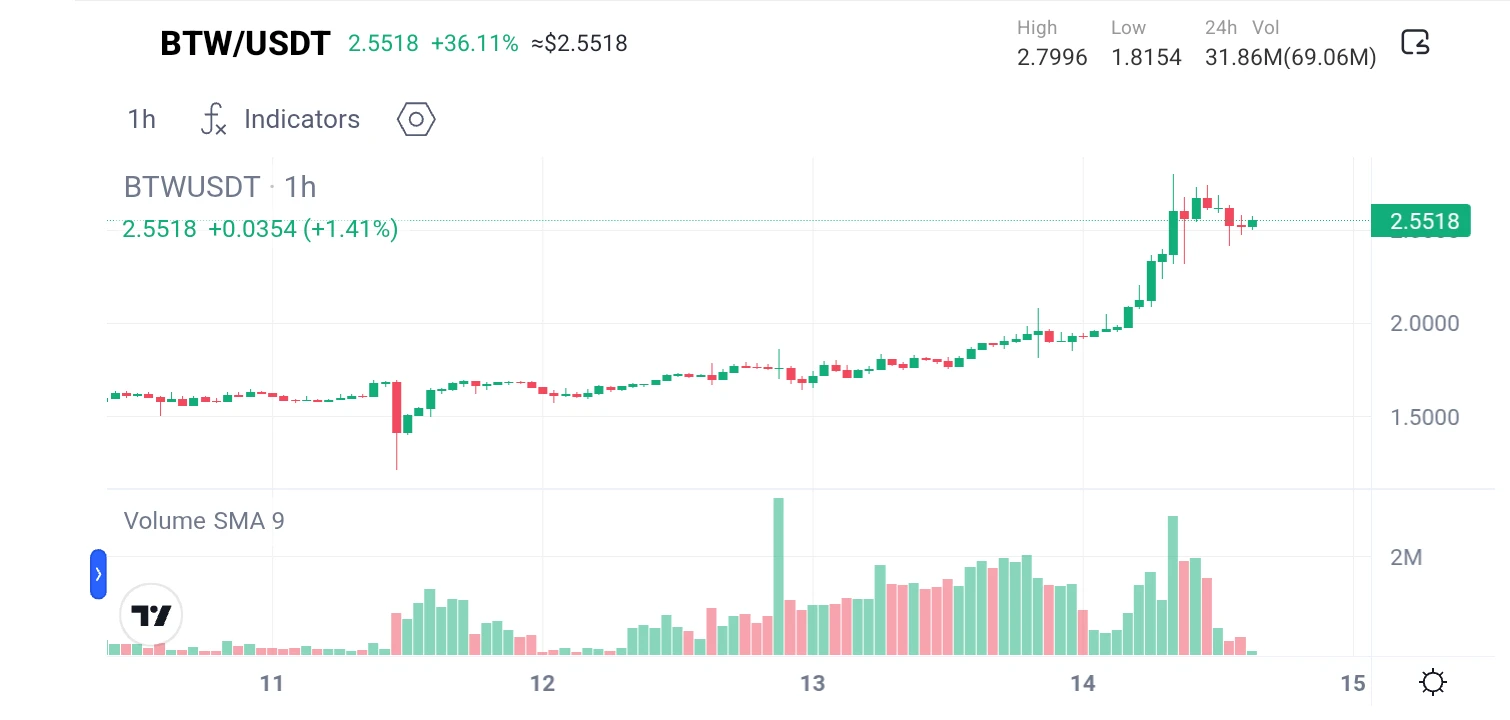
$BTW There is a type of soldier in the military called a sniper. The reason snipers are so formidable is that they are skilled at staying hidden and being patient. This patience is really about waiting for the target to appear. Once the target appears, all they need to do is pull the trigger, which takes only one second, but staying hidden may take several days. Even before going into hiding, they have to plan their route in advance—how to enter and how to leave—and have everything mapped out. Trading is actually the same. We trade when there is market movement and rest when there is none. We
post-image
BTW+31.12%
🔴 LIVE STREAM | Bitcoin Buy the Dip or Wait? 🤔
📉 Bitcoin is moving, and traders are asking one big question: Is this the right time to buy, or is it better to wait for confirmation?
🔥 Join my livestream as we discuss:
🔹 Is Bitcoin presenting a potential buying opportunity?
🔹 What key support and resistance levels should traders watch?
🔹 Could BTC fall further before recovering?
🔹 What market signals could indicate a trend reversal?
🔹 Should traders buy gradually or wait for confirmation?
🔹 How can investors manage risk during market volatility?
📊 Let's explore different market scena
post-image
BTC+0.54%
  • 3
#美国9月CPI即将公布 #CPI Bitcoin’s Next Volatility Test: Can September Inflation Change the Fed Outlook?
The next major macroeconomic catalyst for Bitcoin is approaching. On October 14, 2026, the United States is scheduled to release its September Consumer Price Index (CPI) report at 8:30 AM Eastern Time, equivalent to 20:30 UTC+8. With inflation expectations, interest-rate policy, and risk appetite all in focus, this report could set the tone for the next phase of crypto-market volatility.
But the key question is not simply whether inflation rises or falls. It is whether the actual numbers surprise
Falcon_Official
#USCPISoon September Inflation Could Reset the Fed’s Next Move: Energy Shock, Core CPI and the Market Reaction Test
The next major US inflation report arrives on October 14, and markets are approaching it with a difficult combination of elevated energy costs, persistent underlying inflation and uncertainty over Federal Reserve policy. The September Consumer Price Index (CPI) will be released by the US Bureau of Labor Statistics at 8:30 a.m. Eastern Time, equivalent to 5:30 p.m. Pakistan time. As of October 13, the figures have not yet been released, so the numbers investors are discussing are forecasts, not confirmed results.
The numbers markets are watching
Economists surveyed in recent market reports expect headline CPI inflation to rise to approximately 3.7% year over year in September, compared with 3.4% in August. Core CPI, which excludes food and energy, is forecast at around 2.5%, up from 2.4%. The difference between these two measures is central to interpreting the report: headline inflation captures the direct effect of volatile energy and food prices, while core inflation provides a clearer view of underlying price pressures.
August already showed renewed pressure. The headline CPI increased 0.4% month over month, while gasoline prices rose 3.9% and the broader energy index increased 2.1%. Shelter costs also rose 0.3%. These figures suggest that the September report must be examined beyond its annual headline number: the monthly change, energy contribution and persistence of service-sector inflation all matter.
Why energy could distort the headline
Oil prices have become a major variable in the inflation outlook. Brent crude was reported around $106.65 per barrel on October 12 amid concerns about Middle East supply disruptions. Higher crude prices can feed into gasoline, diesel, transport and distribution costs, placing renewed pressure on household budgets and business margins.
This creates an important analytical distinction. If headline CPI accelerates while core inflation remains relatively moderate, the increase may be driven largely by energy rather than a broad resurgence in consumer demand. That would still matter for households and inflation expectations, but the policy implications could differ from a report showing simultaneous acceleration across housing, services and other core categories.
The key question is whether higher energy costs remain a temporary shock or begin spreading into broader prices and wages.
Three scenarios for markets
A softer-than-expected report could ease pressure on Treasury yields and support rate-sensitive assets. If core inflation rises only modestly and monthly price increases remain contained, investors may become more comfortable with the possibility that the Fed can avoid additional tightening. Growth stocks, technology shares and other long-duration assets could benefit, although the reaction would also depend on earnings expectations and market positioning.
A hotter report would create a different test. If both headline and core inflation exceed forecasts, markets could reassess the risk of further rate increases or a longer period of restrictive policy. Treasury yields and the US dollar could strengthen, while expensive growth stocks and other interest-rate-sensitive assets face valuation pressure.
A mixed result may be the hardest to interpret. Headline inflation could rise because of energy while core CPI remains close to expectations. In that case, traders will need to assess the composition of inflation rather than treating the headline figure as a complete signal. These are conditional scenarios, not predictions of the actual release.
The Federal Reserve’s dilemma
The Fed must balance price stability against economic activity. Inflation remaining above its 2% objective complicates any move toward easier monetary policy, but higher interest rates also raise borrowing costs for households and businesses. Market commentary ahead of the release indicates that policymakers are weighing whether incoming inflation data justify further tightening, with the September CPI report an important input.
One report will not determine the entire policy path. The Fed also considers employment, consumer demand, inflation expectations and other price measures, including the Personal Consumption Expenditures index. Investors should therefore avoid treating a single monthly CPI print as a guaranteed signal of the next rate decision.
What traders should monitor after publication
The first comparison is actual headline CPI against the approximately 3.7% annual forecast. Next, compare core CPI against the 2.5% estimate. Then examine monthly changes and the contribution from energy, shelter and services. Finally, watch the response in Treasury yields, the dollar, equity futures and crypto markets.
For digital assets, the transmission mechanism matters more than the inflation headline alone. A softer report that lowers yield expectations may improve risk appetite, while a stronger report that pushes yields higher could pressure leveraged positions and speculative assets. However, crypto prices can also move independently because of liquidity, positioning and asset-specific news.
The most useful approach is to define scenarios before the release, manage position size and avoid entering a trade solely because the first headline appears bullish or bearish.
The bottom line
#USCPISoon is a test of whether rising energy costs are driving a temporary acceleration in headline inflation or accompanying broader price pressure. The market enters the release with September headline CPI forecast near 3.7% and core CPI near 2.5%, but the actual figures will determine whether those expectations need to change.
The strongest signal will come from the relationship between headline inflation, core price momentum and the market’s reaction in yields and the dollar. For Gate Square traders, the priority is not to guess the number it is to prepare for the different outcomes, distinguish forecasts from actual data and let confirmed evidence guide risk decisions.
repost-content-media
BTC+0.61%
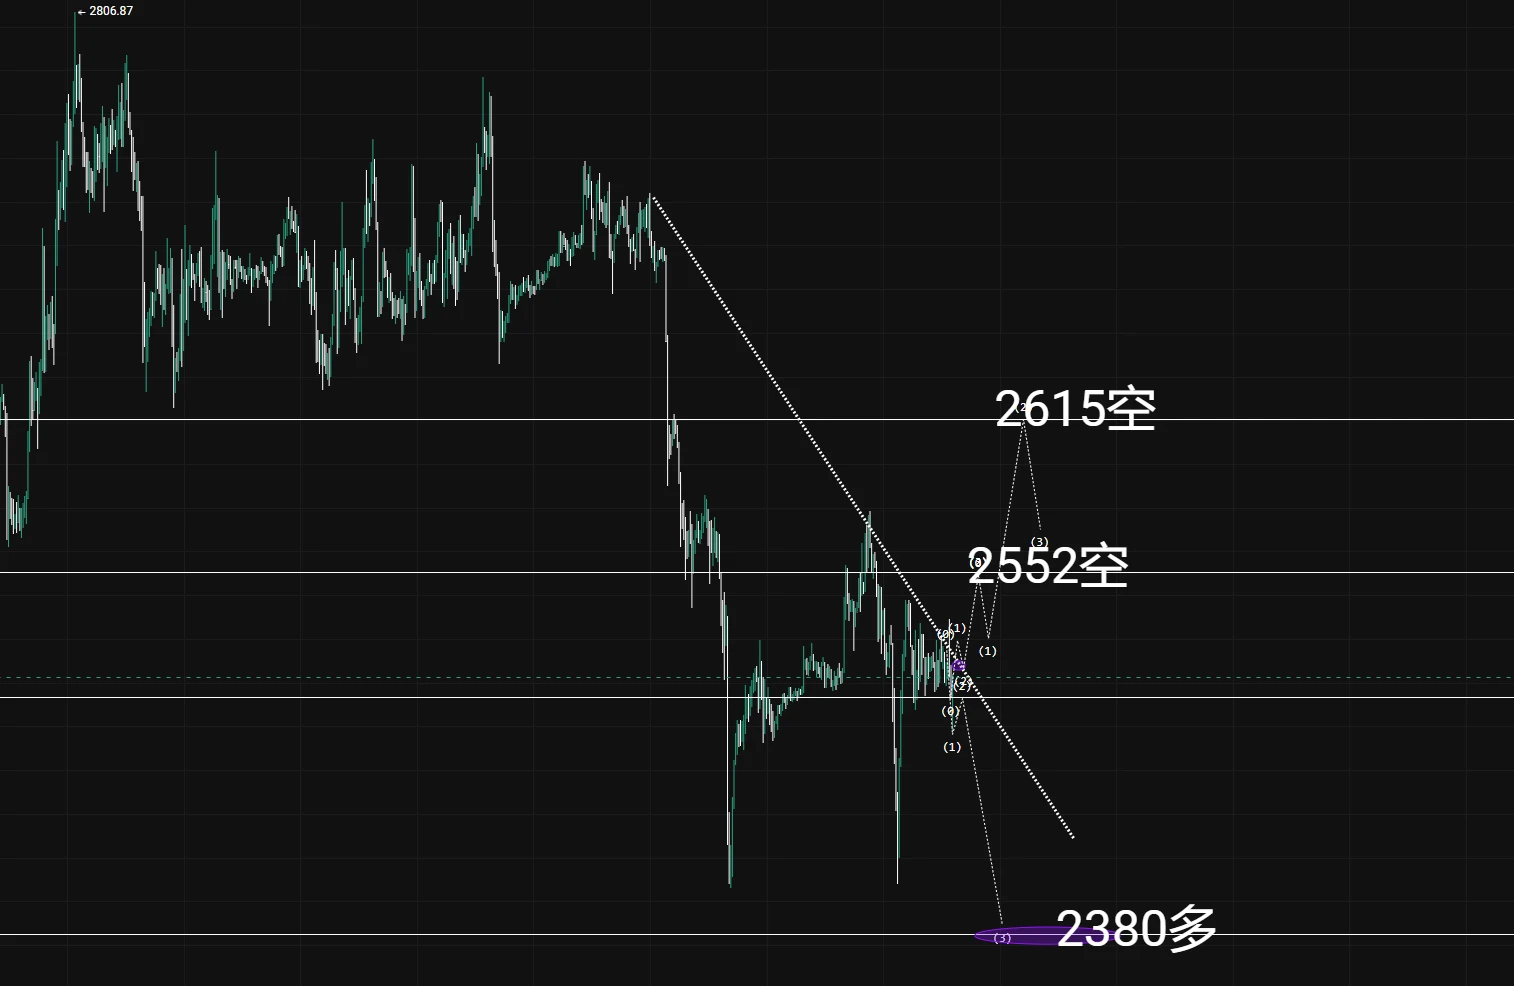
Reviewing last night’s Ethereum price action, the price oscillated repeatedly around the 2500–2530 range overall. During this period, multiple attempts to break above the 2530 level failed to form an effective breakout, indicating that selling pressure overhead remains significant, with 2530 becoming a key short-term resistance level.
Structurally, the price has remained within the range for an extended period, but the highs have consistently failed to rise, while the strength of rebounds has gradually weakened. The bulls have been unable to organize an effective breakout. The price has now pu
post-image
ETH+0.86%
$QNT has entered the oversold zone, but a rebound and a bottom are two different things
$QNT 24-hour -7.04%, current price 210.22. The 1-hour and 4-hour RSI are 57 and 29, respectively. Oversold conditions create demand for a rebound, but a rebound only shows that the decline was sharp; a bottom still requires the price to stop breaking down the structure.
Set emotions aside for now—the structure provides very specific information. The 1-hour EMA20 is at 214.8122 and currently weak; the 4-hour EMA20 is at 226.0318 and currently weak. Shorter timeframes expose changes, while longer timeframes l
post-image
QNT-5.81%
[ NEWSTREAMER ] TODAY MARKET TALK
live-cover
LIVE1,946
Golden words of wisdom, bulls continue to enter
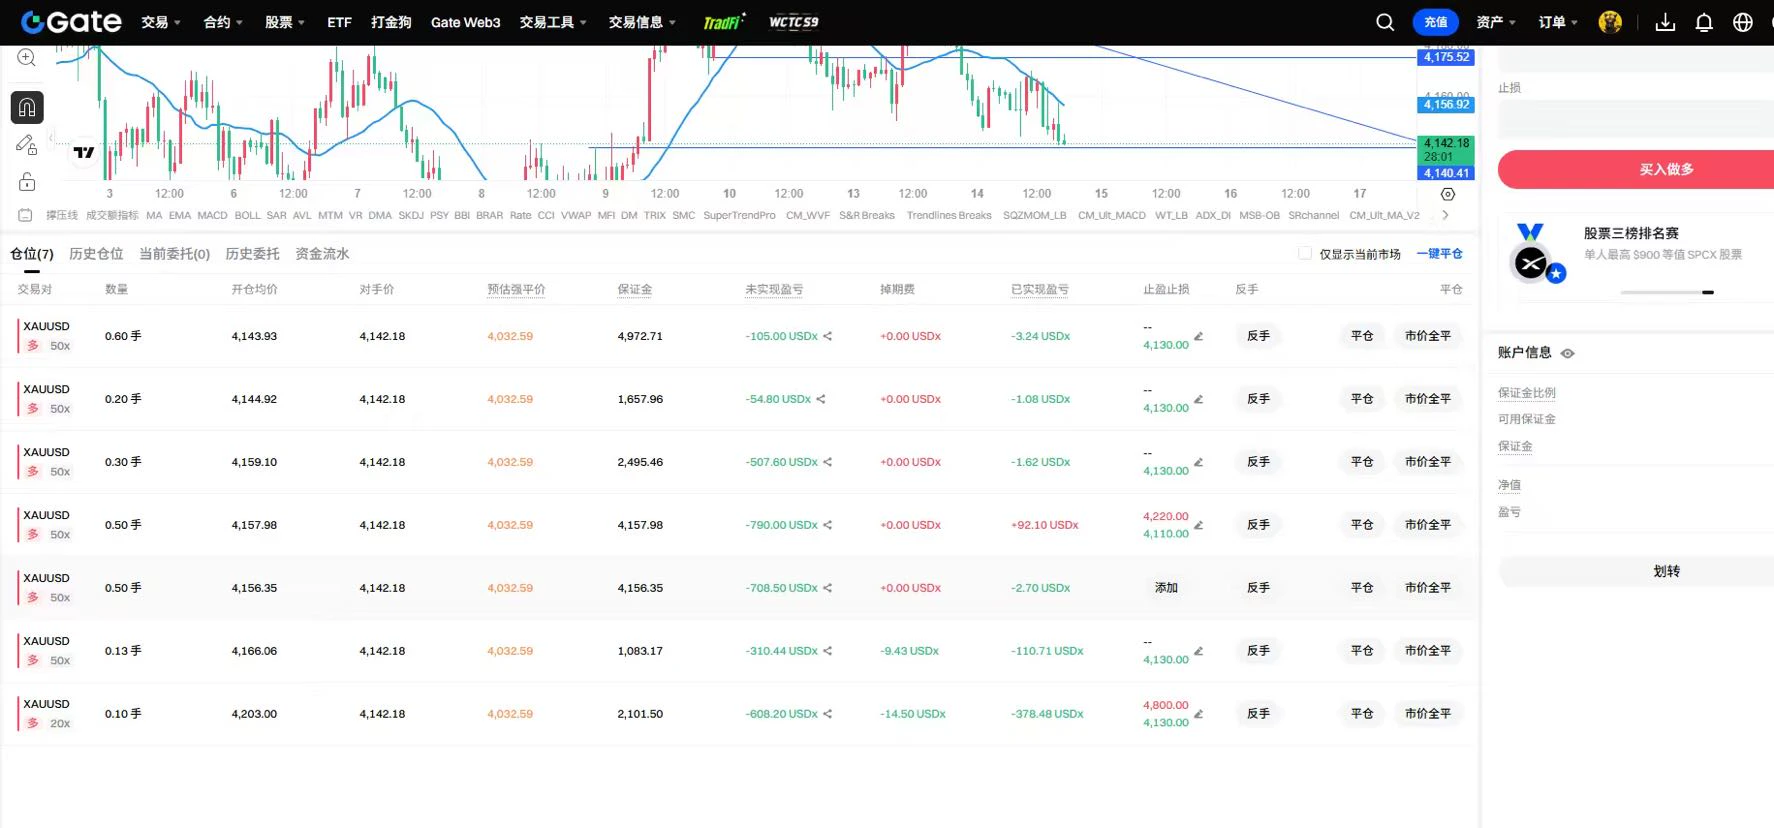
A new trading day, a new beginning. Yesterday, the price successfully reached 4200, and the 4150 long position captured 50 points of upside. The current price is hovering around 4160, reaching the previous long entry point again.
Continue entering long positions. As long as the support at 4130 holds, gold will test 4200 again, so do not enter short positions—continue going long. Enter short positions once gold moves above 4200, and wait for the price to rise.
Go long in the 4140–4150 range, targeting 4200.
post-image
SNDK has bounced off the bottom—can your long position recover?
Markets are always born out of despair and rise amid hesitation; but don’t mistake a rebound for a reversal, or a position that could break even may turn into an even deeper loss!
Why did it rebound last night?
South Korean semiconductors made a dramatic comeback! SK Hynix and Samsung both surged more than 3.6%, while South Korea’s KOSPI index recovered. Market sentiment improved, and funds reassessed the competitive impact of China’s ChangXin Memory Technologies. Combined with Broadcom’s CEO saying that the AI demand shortfall wi
post-image
SNDK-0.32%
SK Hynix+1.94%
$S direction appears aligned, but the low volume shows no confirmation
$S 24-hour change: -1.51%, current price: 0.05856. The 1-hour and 4-hour structures are both relatively strong, but current trading volume is only 0.06 times the average volume of the previous 20 candles. The direction is aligned, but participation has not kept up—this is precisely the point most worth debating right now.
On the event front, the platform's latest announcement mentioned “Gate Research: U.S. Stocks Extend Gains, Moscow Exchange to Launch Regulated Crypto Trading”. This is verifiable background information, bu
post-image
$OP has broken out of its consolidation range and officially taken off. I said in a post last night that among the four L2 kings, OP was the only project that had not taken off, so I bought some yesterday and also mentioned it on the feed. Those who followed the trade yesterday have now secured another 15% profit. There are still just as many idiots on the feed as ever, saying things like, “You recommend this and that every day, so you’ve made all the money yourself.” I’ve answered this question many times. For short-term trades like OP, if someone bought yesterday and sells after it rises to
post-image
OP+18.91%
In fact, social security is already close to collapse
Most young people have no jobs or income, let alone pay into social security
The only people supporting it are those born in the 1980s
Recently, even more of them have become unemployed
These days, regularly buying gold with the money used to pay social security is better than paying into social security
post-image
GLDX-0.07%
PAXG-0.24%
Down 70%! A whale cut losses on 15 million, $PONS — a desperate counterattack or a dead-cat bounce?
Only when the tide goes out do you know who is swimming naked. With whales cutting off limbs to survive, how can retail investors find gold amid the ruins?
Well-known trader Bonk Guy’s holdings shrank from 26 million to 10.4 million, PONS is down 70% from its peak, and project revenue has plunged 99%. Fundamentals are flashing red, while panic selling has largely been flushed out. After bottoming at 0.2735 on the 1-hour chart, it rebounded; the MACD formed a bullish crossover below zero, RSI re
PONS+16.01%
  • 6
  • 2
The Three Major Coins Are No Longer Moving in Sync; A Market Shift May Be Imminent
The crypto market has reached another sensitive juncture: major volatility may be coming, with BTC, ETH, and ZEC each going their own way after surging.
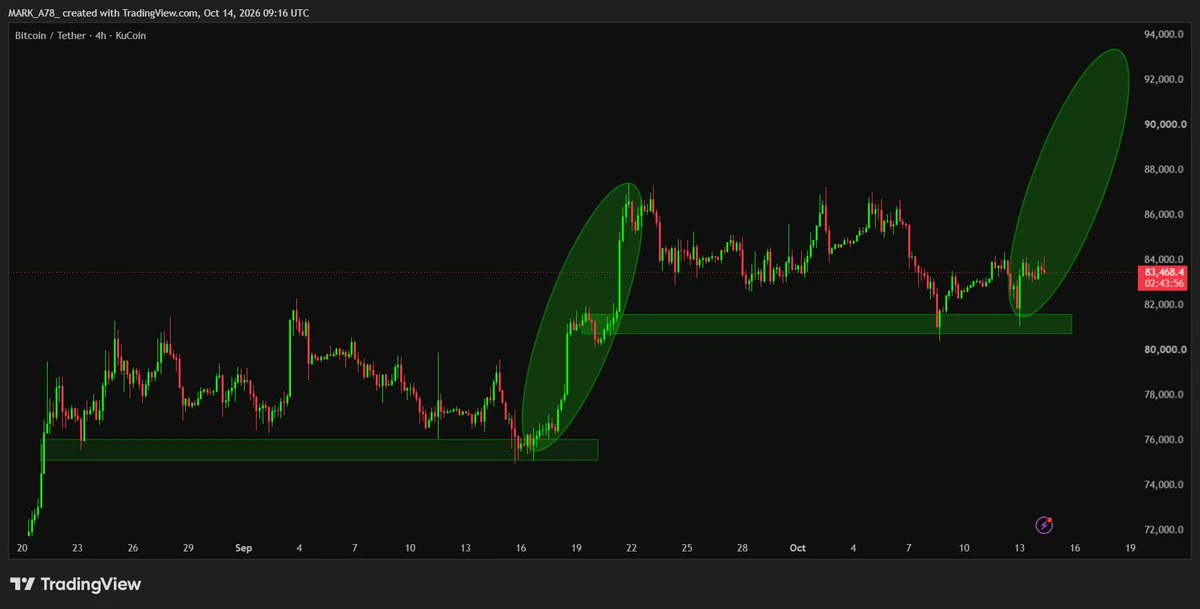
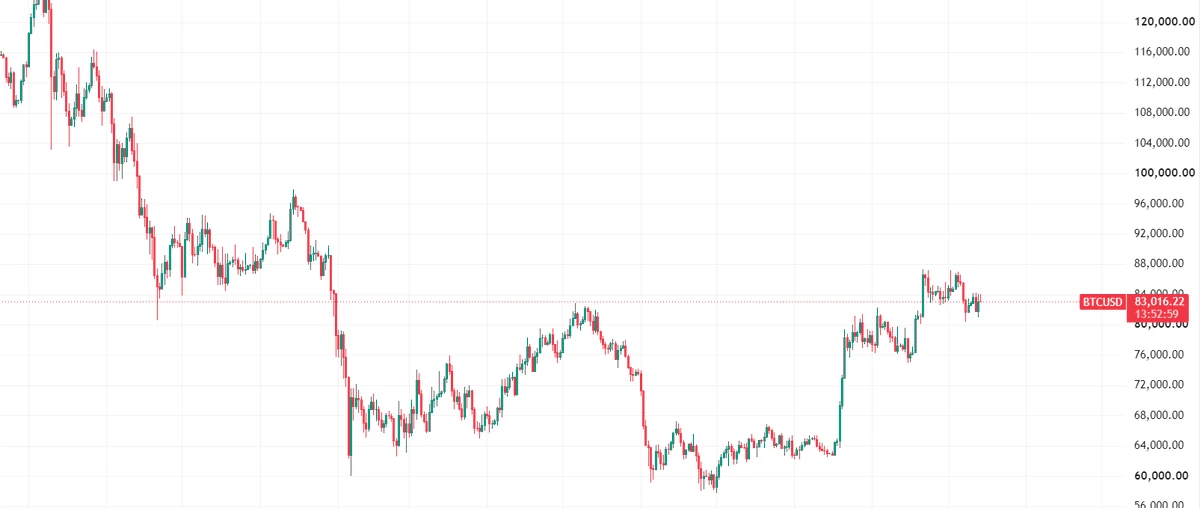
BTC is at 83650. Short-term moving averages are still holding, but the MACD red bars have turned negative, signaling a strong likelihood of range-bound repair. 84177 is firm resistance above, while 83457 is the defense line below; do not take large positions before either level breaks, and admit defeat if it does.
ETH is at 2534, grinding back and forth around t
BTC+0.54%
ETH+0.74%
ZEC+5.34%
Going to prison only affects three generations
Having no money affects generations to come
The reality is: if you have no money, you may not even have a next generation🤣
post-image
10.14$ETH Silk Road
# Market Analysis
After surging to 2519.23, the market came under pressure and pulled back. A long upper-wick candlestick at the highs indicates selling pressure overhead. The price retraced to fluctuate near the middle Bollinger Band, while the MACD red bars gradually faded, with the indicator showing signs of turning downward. The short-term market has entered a phase of struggle between bulls and bears. Strong resistance above is at 2519.23, with support below at 2494.24.
## Bullish Strategy (Long)
✅Long rationale: The previous low of 2494.24 is the key support for this
post-image
ETH+0.86%
#WillYouBuyDipInKoreanStocks 🚀 South Korean Stocks Plunge — Will You Buy the Dip?
Samsung Electronics & SK hynix are leading a sharp sell-off in Korean markets.
Is this just a short-term correction… or the perfect opportunity to buy the dip?
This week’s Gate Square #每周来晒 Special Edition is live!
🔥 How to join & win:
1️⃣ Register here → https://www.gate.com/campaigns/6244
2️⃣ Post your honest view using both hashtags:
#每周来晒 + #韩股大跌你会抄底吗
🎁 Rewards:
• Instant red packet for every valid post
• New users → 100% chance to win
• Weekly leaderboard → up to 100 USDT
💬 Drop your take below:
1️⃣ Do y
post-image
  • 2
  • 1
10.14 ETH Market Trend Analysis
The bottom support was confirmed at 2494.24 earlier, after which the market entered a period of oscillating upward movement. After the candlesticks surged along the upper Bollinger Band, bearish forces quickly intensified, sending prices sharply lower with a large bearish candle to test support at the lower Bollinger Band. After the decline ended, buying interest entered to provide support, and the market stabilized and rebounded. The Bollinger Bands gradually narrowed, and the market entered a corrective consolidation phase. In the short term, this is a rebound
post-image
ETH+0.86%
Load More

Join 40 M users in our growing community

⚡️ Join 40 M users in the crypto craze discussion

💬 Engage with your favorite top creators

👍 See what interests you

Trending Topics

DrLinHanSpeaksAtOxfordUnion

134.67k Views1.85k Discussing

Gate Founder & CEO Dr. LinHan has been invited to speak at the Oxford Union, a 200-year-old debating society that has hosted Einstein, Hawking, and Churchill. He will discuss crypto, the future of money, and what Gate Money means for global value movement. First trading platform on this stage. Nov 12 at Oxford. [👉 Learn more](https://oxford-union.org/event-6845310)

USCPISoon

24.63k Views1.65k Discussing

GateWCTCS9GlobalTradingCompetition

36.76k Views5.93k Discussing

View More