






Square
Following
Hot
News
Profile
Share your thoughts
placeholder
Article
At 11:30, Fed Chair Powell is about to speak, and volatility is very high. This kind of event is unpredictable. The market has been sluggish recently, so there probably isn’t much room for further declines. As long as Powell does not deliver overly bearish news, the market will not become too extreme. The market will be closed on Saturday and Sunday, and the timing is right—the broader market will gradually rebound. $ETH You can open a position, set your stop-loss properly, and 2500 will be reached. #美国9月PPI大超预期
ETH+3.94%
$BTC Google ran magic state cultivation on the Willow chip, reducing errors by approximately 40-fold and achieving 99.99% accuracy, cutting the error-correction overhead of fault-tolerant quantum computing. For the crypto industry, the Q-Day narrative has gained fresh fuel: two papers published at the end of March reduced the number of physical qubits needed to break Bitcoin from the millions to the tens of thousands, while Google Quantum AI warned that transactions being broadcast could be hijacked in approximately 9 minutes, putting approximately 6.9 million BTC with exposed public keys at
post-image
BTC+1.76%
What in the world ?! 🤯
post-image
Aptos Labs' Shelby storage network, co-developed with Jump Crypto, now runs production workloads for Teepin, Pictor Network and PathPulse AI in private beta. The three customers span enterprise AI, 3D rendering and spatial data.
@Aptos
APT+10.20%
$ETH Currently bearish—short, short; longs are all fuel!
Direction: Short
Entry: 2470-2430
Take profit: 2410-2380
ETH short position opened: Whales sold BTC for 53k ETH; loss-making whales liquidated their positions, releasing selling pressure. The candlestick bottomed at 2313 and rebounded.
#美国9月PPI大超预期
post-image
ETH+3.94%
#KOSPIJumps3.3% After the kind of day Korean investors had on Thursday, I think a lot of people were just hoping for a bounce on Friday. They got one.
First, the damage
On October 15, the Kospi closed down 454.59 points, or 7.57%, at 5,554.22, and circuit breakers briefly halted trading in both markets. It also fell below the 6,000 mark for the first time since July 30. The reasons were piling up: worries about persistent US inflation, the chance of tighter monetary policy, and doubts about how sustainable AI infrastructure spending is. It was also not a one-day story. The Kospi had fallen sev
🌅🚀 GATE.IO ⚡ HOT TRADER LIVE | BTCS NEXT BREAKOUT? ₿📈 | MORNING MARKET WATCH 🔥🐂🐻
live-cover
LIVE1,565
Good morning, babes~
It’s finally Friday
I already feel so much more relaxed
I heard #Solana has moved into a top office building in Shanghai
They say foreign companies let employees bring pets to work
Can I bring my dog to work? @solana
I want to apply for a job there 😆...
post-image
SOL+3.92%
🚨 $SNDK
——Down 41%. Is it a buying opportunity? SanDisk is currently trading near $1,395, below the previous $2,354. AI data centers, enterprise SSD demand, and NAND prices remain important bullish catalysts. My bullish trade plan Entry: Buy at $1,340–$1,380 if support holds Target 1: $1,450 Target 2: $1,500–$1,600 Stop-loss: Below $1,270 A breakout above $1,450 could trigger another rally. However, if it falls below $1,276, downside risk will increase. My strategy: Buy in batches near support, do not chase the rally, and add only after a confirmed breakout. Trade the opportunity, not the hy
post-image
SNDK-0.56%
Old Cat’s Crypto Basics: Why do you see one price when buying coins, but execute at another?
Many beginners encounter this the first time they buy crypto.
You clearly see BTC at 60000U, but after clicking buy, the average execution price becomes 60150U.
Did the exchange secretly charge extra?
Not necessarily. This involves a very common concept in trading: slippage.
I. The price you see is not necessarily the price you can buy at
The latest price shown on the trading page only represents the price at which the previous trade was executed.
But when you actually buy, you need to see whether anyo
post-image
BTC+1.76%
ETH+3.88%
Oversharing is a way of forcing intimacy.
post-image
All steady spot profits in crypto have never come from betting on market moves or relying on luck! True professional traders only trade high-confidence moves at key support and resistance levels! All price rises and falls, shakeouts, and breakouts revolve around key levels of market consensus! No empty talk today—we’re directly revealing precise BTC/ETH/SOL/BNB resistance and support levels, and teaching you step by step how to draw lines, identify trends and signals, and determine entries and exits. Put it straight into practice after reading!
📍 Spot Strategy · Practical Identification and L
BTC+1.76%
ETH+3.88%
SOL+3.92%
BNB+1.71%
Live market update
live-cover
LIVE2,009
#USSeptemberPPIBeatsExpectations CPI and PPI Both Run Hot: Is the Market Entering a New Inflation Shock?
The inflation debate has taken another serious turn. After stronger-than-expected U.S. CPI data, September’s Producer Price Index (PPI) has added further pressure to an already sensitive macroeconomic environment. With producer inflation reportedly rising to 6.3% year-over-year and 1.3% month-over-month, investors are being forced to reconsider one of the most important questions in financial markets: Is inflation becoming more persistent than expected, and what does that mean for risk asse
post-image
  • 1
Micron's earnings report dazzled, yet the stock still plunged—why are its results and share price “fighting” each other?

This is the most puzzling part of this storage-stock pullback—Micron just delivered the best earnings report in its history, yet its stock fell the hardest.

First, the results. Micron's fourth-quarter fiscal 2026 revenue was $54.23 billion, up 379% year over year and 31% quarter over quarter, setting a record for the sixth consecutive quarter. GAAP net income was $37.7 billion, up more than 10x year over year. Adjusted EPS was $33.42, with both revenue and adjusted EPS e
MU+1.93%
$DUSK Current price: 0.1095. The first resistance above is the upper Bollinger Band at 0.1149, while support below is the lower Bollinger Band at 0.1076. Let’s lay out the key levels first, then discuss the logic.
From the funding perspective, this 24h +7.88% rally carries a counterintuitive signal: the funding rate is -0.0065%, meaning it is negative. Price is rising while the funding rate is negative, indicating that shorts in perpetual contracts are paying longs, with the positioning structure skewed bearish. In other words, this rise is not driven by leveraged long chasing, but by shorts
post-image
SPCXB
SPCXBSpaceX
Four.meme
MC:$4.44KHolders:2
0%
DUSK+3.38%
UNI+8.70%
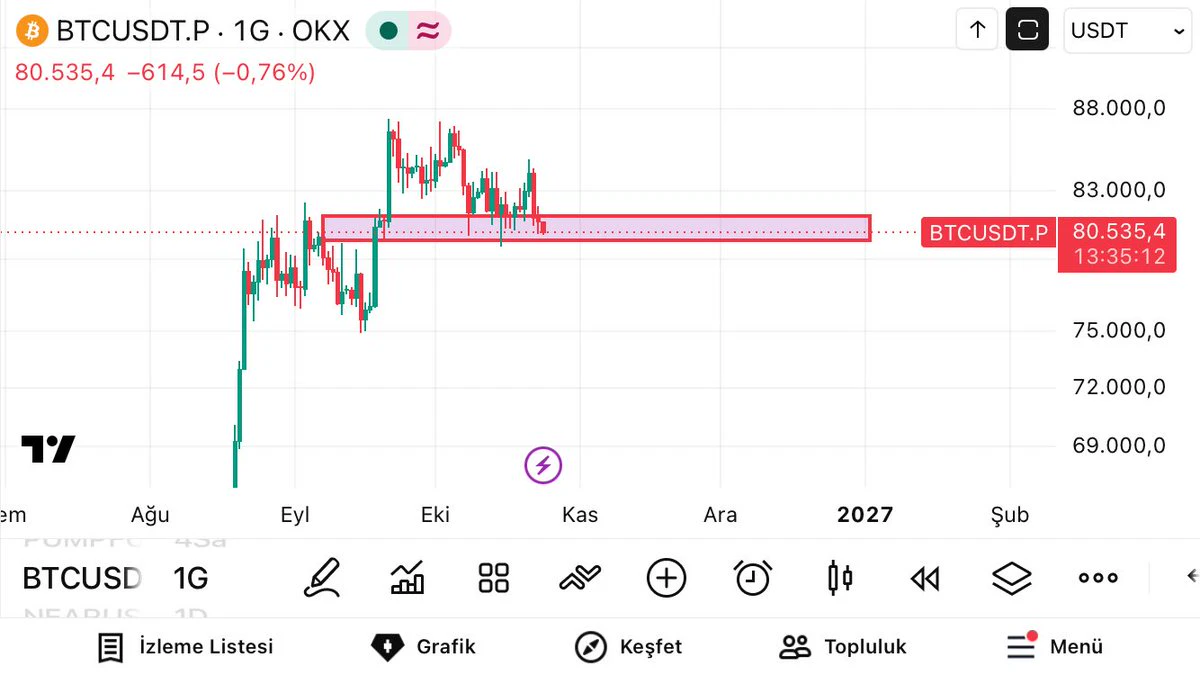
Most funds are betting that BTC will hold above $85,000 in October, and this expectation is already fully priced in, leaving limited room for upside speculation.
A breakout above $87,500 and a deep drop to $77,500 offer better odds, representing moves that deviate from mainstream expectations; when the market is unanimously bullish, beware of reversal risk if expectations fail to materialize.
post-image
BTC+1.76%
🚨 $AGT
— Bearish setup? 📉 Whales are continuously placing buy orders in the $0.025–$0.020 range, but the strong sell wall near $0.038 may limit upside. Although futures buying volume leads 52.2% to 47.8%, aggressive buying does not guarantee a breakout. 🔴 $0.038: Key resistance 🎯 $0.025–$0.020: Potential downside targets If $AGT faces rejection, the price could experience another leg down. Monitor price action and manage risk. Do your own research; this is not investment advice.
post-image
AGT+109.95%
XAUUSD Oct 16 Asia-European Session Outlook$XAUUSD
It has not yet firmly held above 4170, so be especially cautious of a false breakout! If 4170 is truly broken to the upside, pay attention to the 4192–4198 resistance zone with multiple mid-level confluences. Do not take the wrong direction; going short currently offers a significantly better risk-reward ratio!
Intraday resistance
1. 4190–4198, 4h timeframe
2. 4220–4226, daily timeframe
3. 4315, daily timeframe
Support
1. 4104–4113
2. 4066–4070; watch for additional wick-spike action here
3. Around 4024
post-image
XAUUSD-0.18%
$XAUT 10.16 Gold outlook
From the chart, gold remains in a downtrend channel on the larger timeframe, but signs of stabilization and a rebound have emerged on the smaller timeframe. In the short term, lightly enter long positions with the trend, then go short after encountering resistance
Trading reference: Go short once around 4175; if it breaks through, go short around 4115, targeting 4130–4100
post-image
XAUT+0.50%
Load More

Join 40 M users in our growing community

⚡️ Join 40 M users in the crypto craze discussion

💬 Engage with your favorite top creators

👍 See what interests you

Trending Topics

USSeptemberPPIBeatsExpectations

91.35k Views1.9k Discussing

US September PPI came in at 6.3% YoY, well above the 5.3% market expectation, pointing to renewed producer-side inflation pressure. Weekly jobless claims were 199K, broadly in line with forecasts. Could hotter inflation further reduce room for rate cuts, and what does it mean for $BTC, US stocks, and gold?

DrLinHanSpeaksAtOxfordUnion

135.63k Views1.86k Discussing

KOSPIJumps3.3%

47.29k Views1.88k Discussing

View More