Square
Following
Hot
News
Profile
Share your thoughts
placeholder
Article
The odds of a 25 bps Fed rate hike in October have dropped to a new monthly low of just 14%.
Markets are increasingly pricing in no rate hike, which could be a positive signal for risk assets like Bitcoin and crypto.
All eyes on the Fed’s October 28 decision.
post-image
BTC-0.14%
  • 9
  • 2
#ShareWeekly #WarshIMFSpeech Warsh at the IMF: why the Bangkok remarks matter for rate hikes and for BTC
Fed Chair Kevin Warsh joined IMF Managing Director Kristalina Georgieva for a fireside chat at the IMF-World Bank meetings in Bangkok, and the two questions in this topic are the right ones. Is the tone hawkish or dovish, and what does it mean for Bitcoin? Here are the answers, backed by the numbers that moved after he spoke.
Tone: neutral on the surface, hawkish underneath
Warsh did not choose a side. He reiterated the Fed's commitment to price stability while refusing to prejudge upcoming
BTC-0.14%
USIDX-0.18%
SPX500-0.30%
NAS100-0.65%
XAUUSD-0.12%
  • 1
Trenches
AGT
A
bade
b
AGT
0x5d...e274
Market Cap
$.
Change
.
24h Vol
$.
Holders
.
CNPY
C
bade
b
CNPY
0xc6...ddd2
Market Cap
$.
Change
.
24h Vol
$.
Holders
.
FOLIO
F
bade
b
FOLIO
0x5f...e411
Market Cap
$.
Change
.
24h Vol
$.
Holders
.
FTR
F
bade
b
FTR
DFMt...pump
Market Cap
$.
Change
.
24h Vol
$.
Holders
.
Q
Q
bade
b
Q
0xc0...0589
Market Cap
$.
Change
.
24h Vol
$.
Holders
.
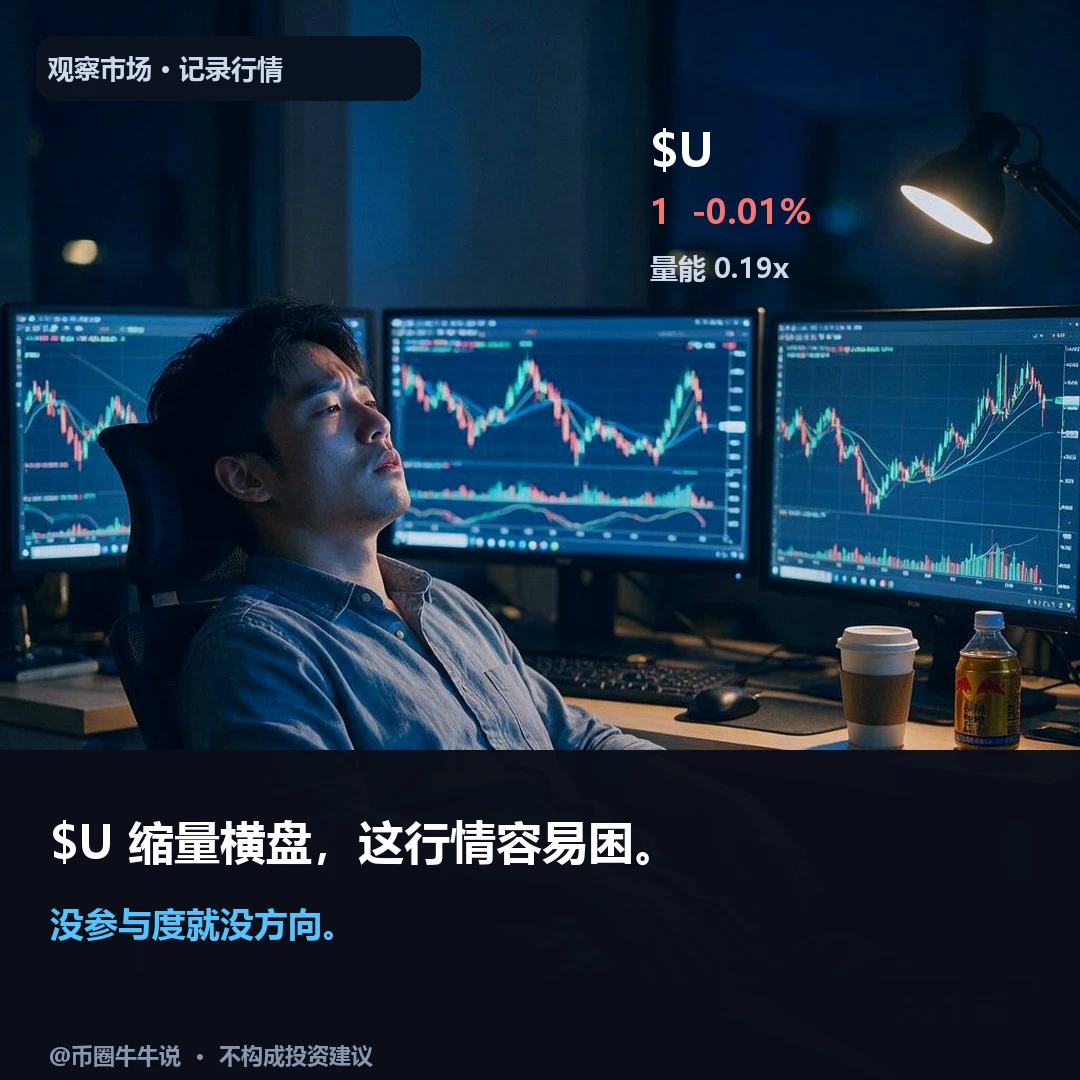
I also have the teacher version of Big-Tailed Cat here... There’s always one direction that’s right...
post-image
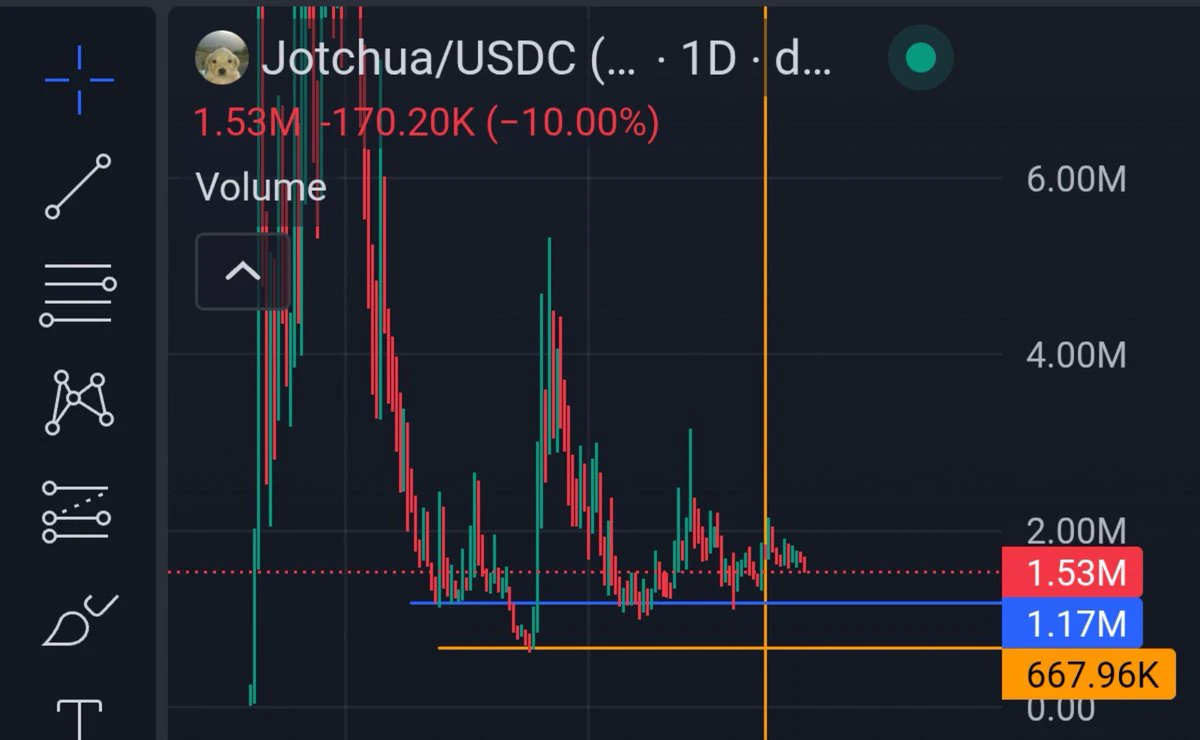
The data looks off. $US is currently at 0.0060, down 14.38% in 24 hours, with a low of 0.0059, closing almost at the floor, yet trading volume was still 22.9M—the price crashed without volume shrinking, so this isn’t an ordinary pullback.
Three possibilities: first, someone dumped heavily ahead of a certain event; the volume shows the selling pressure is real. Second, market makers pulled liquidity, and the thin order book created the plunge—the 0.0059 wick looks like that. Third, panic selling triggered a cascade, with retail traders handing over their tokens after seeing it break below 0.00
US-11.92%
#DOGE DOGE ETFs switch from consecutive net inflows to redemptions! Can the $0.08 support hold?
Dogecoin hype cools! ETF funds flee, with $0.08 becoming a make-or-break line🐶
Dogecoin DOGE, once hugely popular, is now facing a subdued market atmosphere. Dogecoin ETFs had previously seen three consecutive weeks of inflows, but the trend completely reversed in October as institutional funds began to pull out, putting significant pressure on the price.
📉ETF funds see $540,000 in outflows over two days.
According to SoSoValue data, from October 1 to 9, flows in and out of Dogecoin spot ETFs were
post-image
DOGE-1.67%
$ETH #美国9月PPI大超预期 Crypto Academician: 10.18 Ethereum (ETH)’s medium-term uptrend remains intact, but bears have completely taken control in the short term
Yesterday, a follower told me he went long at 2700 and has held on until now, but is almost at his breaking point. I really understand that feeling—watching unrealized losses grow day by day, unable to sleep at night and feeling drained during the day. But I want to say this: in trading, position management is ten times more important than getting the direction right. If you’re holding a full position, even if you get the direction right, on
ETH-0.93%
$LINK 🔵
Just dropped the full long term buy/sell roadmap for the subs.
Every entry + every TP mapped out till Christmas.
A lot of the crew already sitting on a $7-9 average 💸
If you're not in yet, you know where to find it 👇
post-image
Treat $SOL as a thesis to test: current price 103.52, down 0.93% over 24 hours, with participation at 0.42x. What’s known is clear; the key unknown is whether real buyers will show up at key levels.
There’s a simple rule of thumb: price shows direction, while volume shows participation. When price has moved but volume is clearly below average, the follow-through on either a breakout or a decline should be discounted. Looking only at candle colors is easy, but price moving and most people being willing to follow are two different things.
Don’t clutter the chart with lines. For now, just note 1
post-image
SOL-0.68%
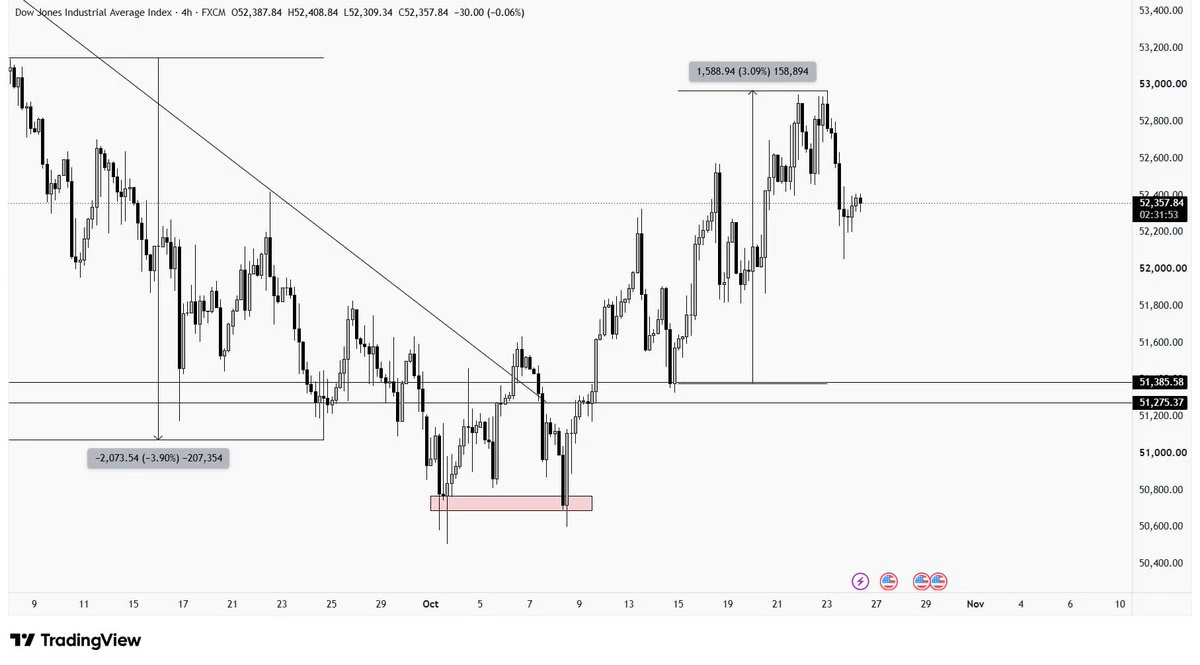
#美国9月PPI大超预期 #ShareWeekly MACRO MEMO: Two Hot Inflation Prints in Two Days, and a Market That Did Not Follow the Script
September producer prices rose 1.3% on the month against 0.6% expected, and 6.3% on the year against a 5.5% consensus. Core PPI climbed 0.7% against a 0.3% forecast. It came one day after CPI of 3.7% year over year, above the 3.6% forecast, with core CPI up 0.3% against 0.2%. Producer energy prices rose 10.8%, so fuel is the main engine, but the core readings show heat spreading beyond it.
THE FED
Rate-hike odds moved fast. October hike odds reached about 45% after CPI, then
post-image
CME+1.49%
SPX500-0.30%
US500-1.06%
US2000+0.24%
BTC-0.14%
$AVA Bottom reversal—upward momentum is starting to strengthen 📈
Go long now with 20x leverage: Entry range: $0.314 – $0.328Take-profit 1: $0.340Take-profit 2: $0.360Take-profit 3: $0.385Take-profit 4: $0.400Stop-loss: $0.267Risk warning: If Take-profit 1 is reached, partially take profits and move the stop-loss to the entry price to protect your principal. Please manage your risk and never put all your funds into a single trade. Click below to go long now…👇$AVA
post-image
AVA+36.13%
A couple weeks ago I added bonds to my account & people thought I lost my mind
“Brandon the market’s ripping, why would you buy BONDS?”
Because my stock sheet/overall thesis had $Q about 10% above fair value. When the market gets hot I lower my risk... fewer sold puts, took profits on $META, & moved about 15% of my account into bonds
I don’t have a crystal ball.
Timing the market is next to impossible.
I just follow the valuations/totality of data.
This week the Nasdaq 100 dropped almost 5% & chip stocks fell 9 days in a row
& today I started doing the opposite... swapped some of those bonds b
post-image
NAS100-2.28%
BTC and ETH Derivatives Activity Rises During a Sudden Market Reversal
live-cover
LIVE2,055
It’s not just supertankers going up in flames—crypto and stock traders’ wallets are burning too.
If this keeps up, aren’t you worried it’ll spark public outrage?
post-image
2026.10.18
Daily chart entry point: 2410
Resistance levels above: 2420-2425-2430-2440-2450-2480
Support levels below: 2400-2390-2380-2370-2350-2330-2315-2300-2280-2270
At every support and resistance level, trade the rebound on the first break or failed break; if the level breaks again, trade with the trend. If 2430 holds, chase the move into a long position; if it fails to break, look to short at a higher level. If 2480 holds, chase the move into a long position; if it fails to break, look to short at a higher level. If 2380_2370 holds, look to go long near the lows; if it breaks, look to sho
BTC MARKET UPDATES
live-cover
LIVE438
SAND is suspected of being a gambling-related project, so how can it still be listed
post-image
SAND+15.24%
$SAND Gambling-related tokens will sooner or later be investigated and delisted
post-image
SAND+15.24%
#NEARJumpsNearly10% Protocol Jumps Nearly 10 Percent, Is a New Momentum Wave Beginning?
The cryptocurrency market continues to deliver opportunities for traders who know how to recognize momentum, and NEAR Protocol has attracted attention after a price jump of nearly 10 percent. Such a move can quickly change market sentiment, bring fresh attention to an asset, and encourage traders to look more closely at its price action.
But the most important question is not simply why NEAR is rising. The real question is whether this rally can sustain its strength or whether the market is approaching a sh
BTC-0.14%
ETH-0.95%
  • 2
GM, my @playcambria Viceroy Charter NFT revealed today
How’d I do
post-image
Load More

Join 40 M users in our growing community

⚡️ Join 40 M users in the crypto craze discussion

💬 Engage with your favorite top creators

👍 See what interests you

Trending Topics

USSeptemberPPIBeatsExpectations

91.35k Views1.92k Discussing

US September PPI came in at 6.3% YoY, well above the 5.3% market expectation, pointing to renewed producer-side inflation pressure. Weekly jobless claims were 199K, broadly in line with forecasts. Could hotter inflation further reduce room for rate cuts, and what does it mean for $BTC, US stocks, and gold?

GateWCTCS9GlobalTradingCompetition

37.87k Views6.66k Discussing

GateBTCAndETHFuturesVolumeRanksTop3

53.8k Views1.8k Discussing

View More