
Square
Following
Hot
News
Notifications
Profile
Share your thoughts
placeholder
Article
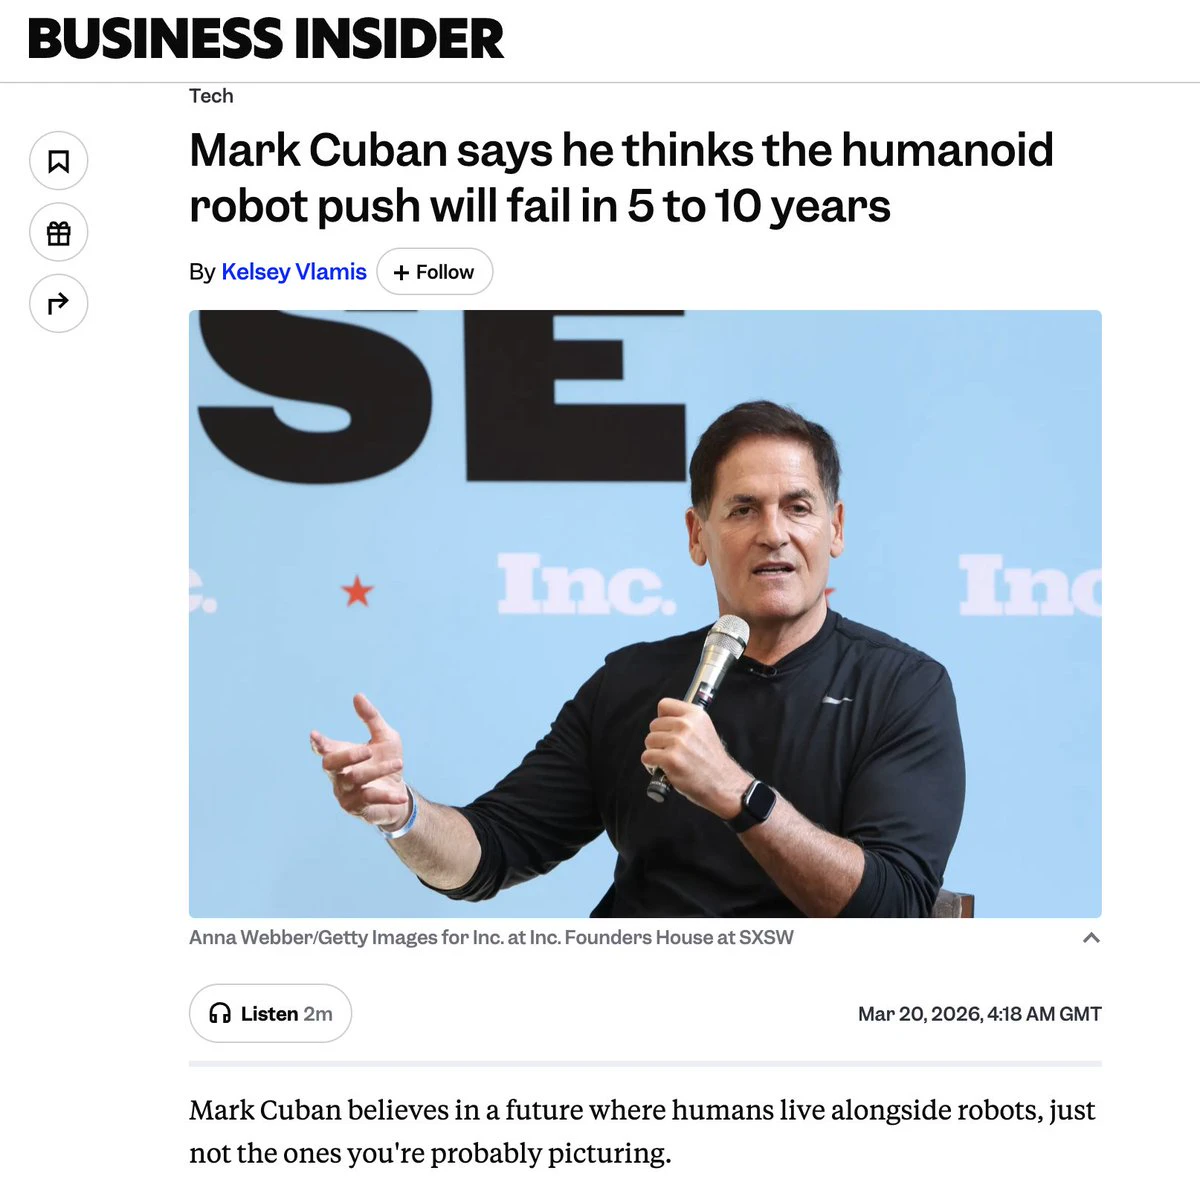
only 8 months later…
i wonder if @mcuban has changed his opinion?
post-image
Which memecoin is about to do this
post-image
MEME-0.94%
MEMECOIN+8.70%
Trenches
ZIG
Z
bade
b
ZIG
0x8c...1145
Market Cap
$.
Change
.
24h Vol
$.
Holders
.
BTC
B
bade
b
BTC
C5xp...pump
Market Cap
$.
Change
.
24h Vol
$.
Holders
.
STONK
S
bade
b
STONK
6GmA...UNgx
Market Cap
$.
Change
.
24h Vol
$.
Holders
.
MAGGIE
M
bade
b
MAGGIE
8rHo...PmZV
Market Cap
$.
Change
.
24h Vol
$.
Holders
.
CLAUDIA
C
bade
b
CLAUDIA
2j5S...W2ZM
Market Cap
$.
Change
.
24h Vol
$.
Holders
.
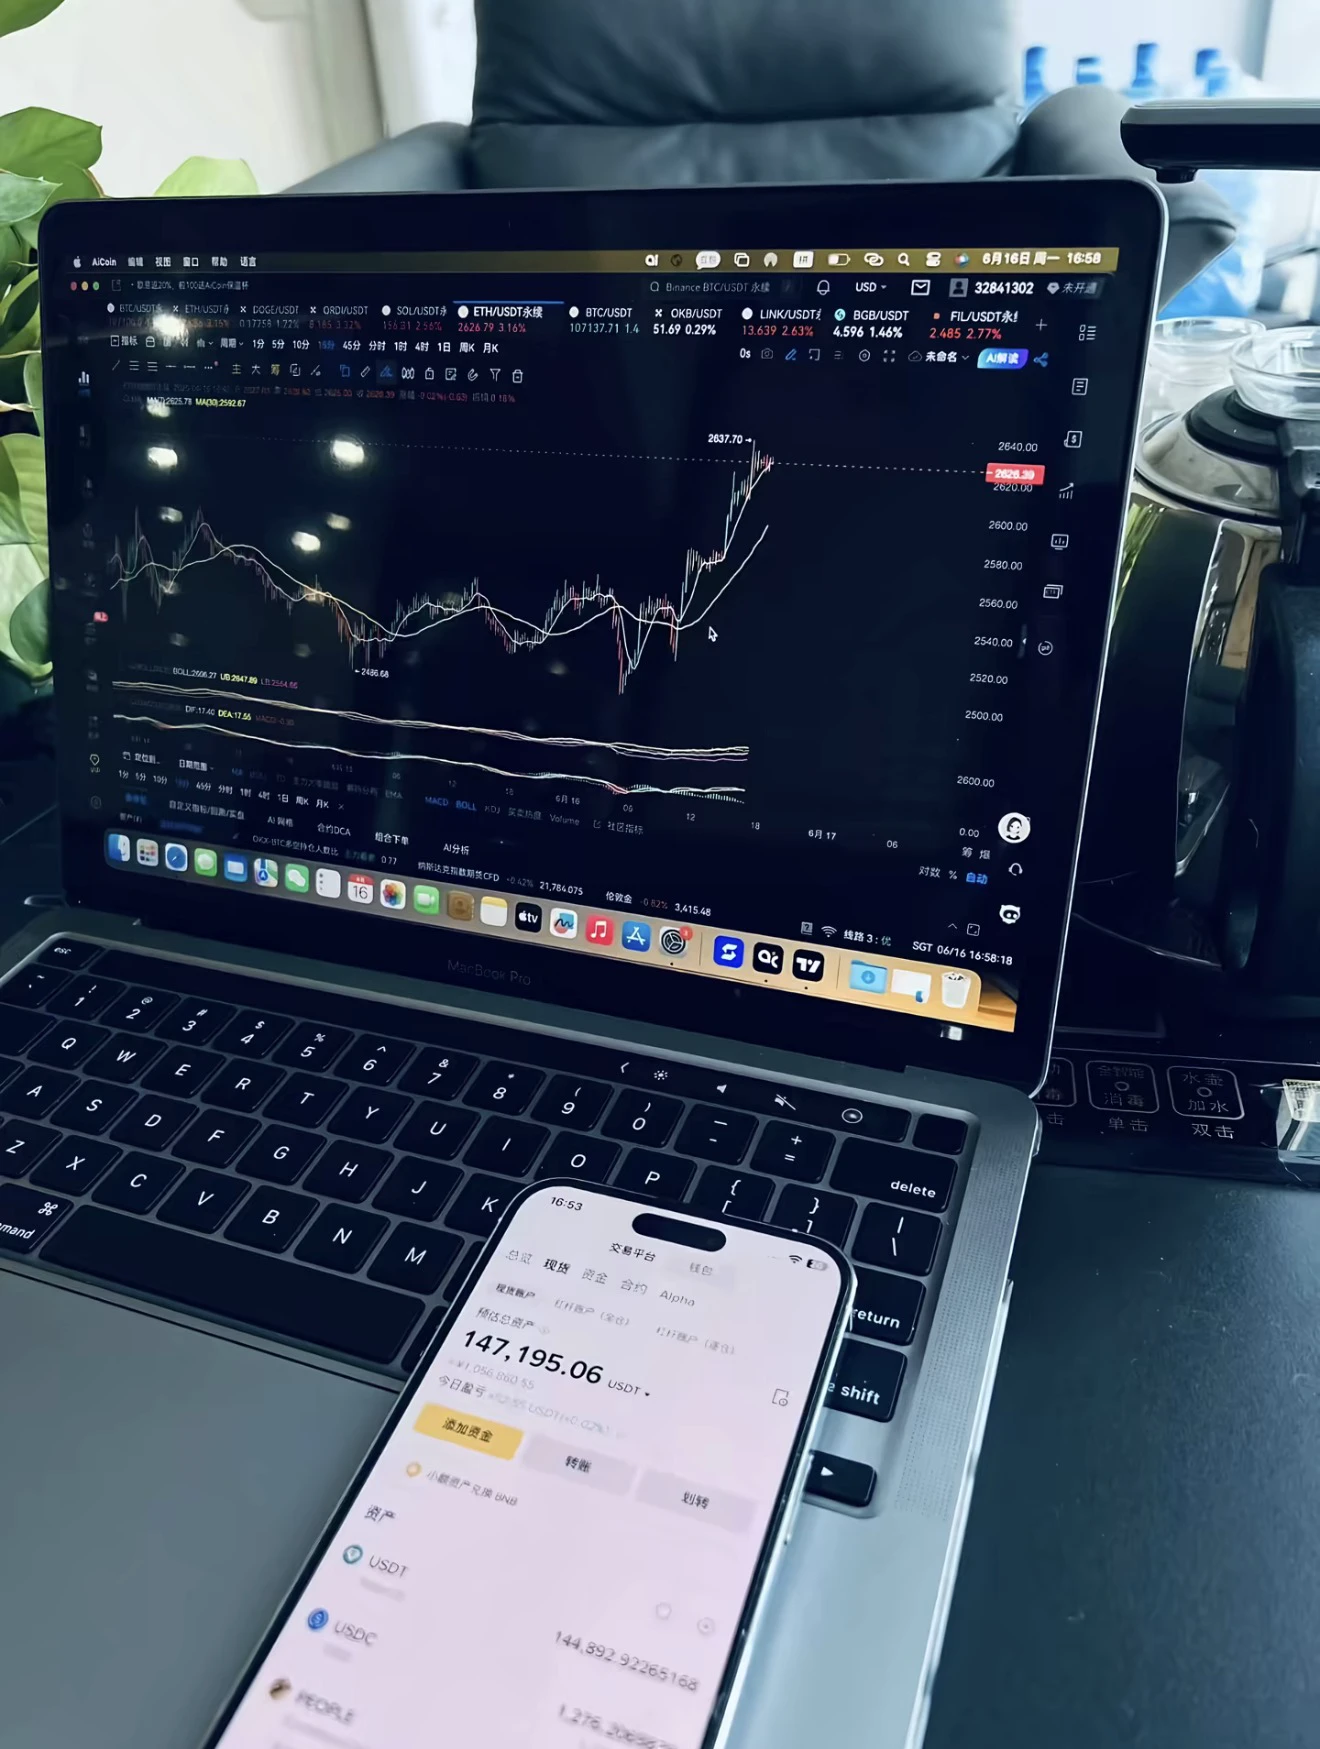
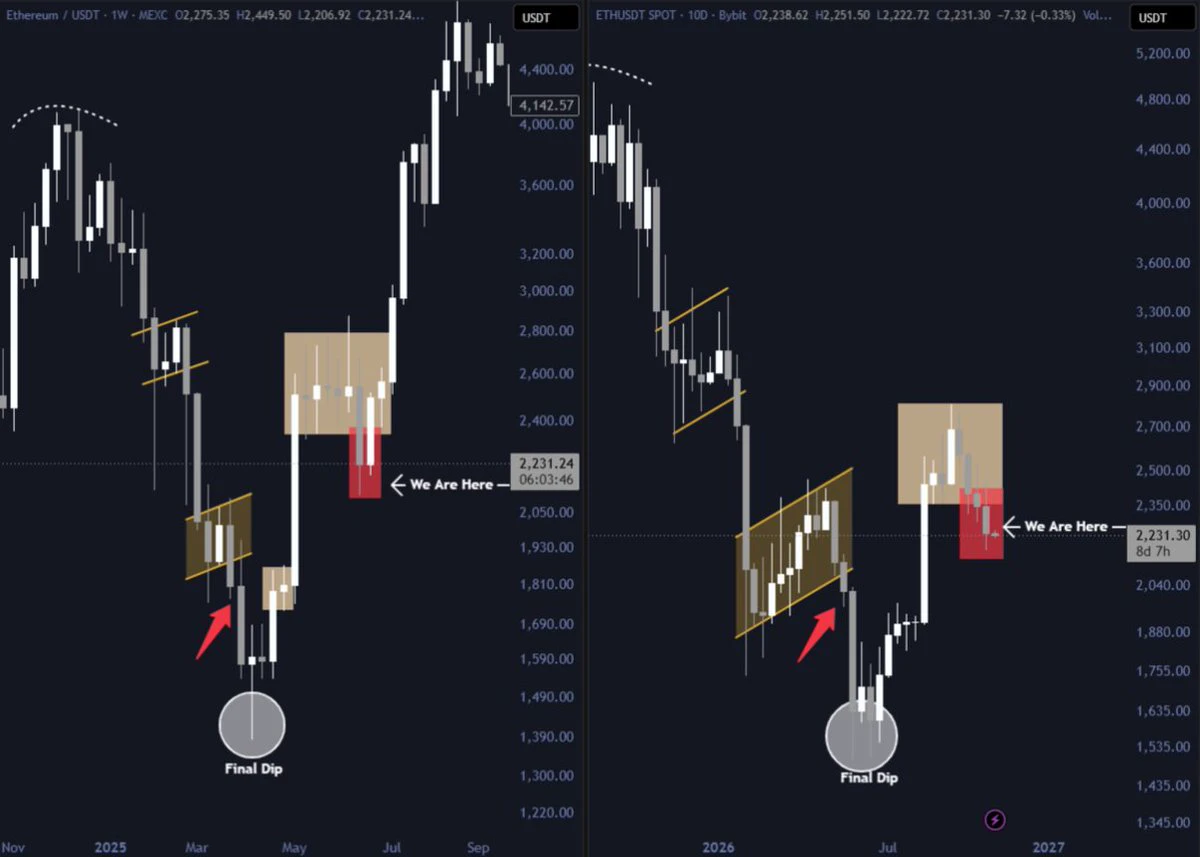
$ETH is getting close to its bottom
The structure looks very similar to 2025, and I think it'll repeat again
post-image
ETH-1.26%
Don’t rush to turn your fortunes around; first learn how not to get wiped out
There’s a strange phenomenon in crypto: the less money people have, the more they want to grow it quickly.
With 15U in their account, they’re fixated on stories of “100x in three months” on the leaderboard; with barely any chips in hand, they’re already planning what car to buy once they’re financially free.
The result: too little capital, too much ambition, and the gap in between gets filled by going all in.
But the market isn’t a wishing well. It advertises get-rich-quick stories, but collects tuition from ordinary
post-image
BTC-0.65%
ETH Technical Outlook: Ethereum Struggles Below $2,385 as Key Support Remains Under Pressure

Ethereum is showing a weak daily structure after facing rejection from the $2,700 area. Price is currently trading near $2,232, below all four major EMAs. Although buyers are attempting to stabilize the market around $2,230, momentum remains relatively weak.

The next move will depend on whether ETH can reclaim its EMA resistance zone or whether sellers push price toward lower support levels.

1. EMA Structure: Sellers Maintain Control

Current ETH price: $2,231–$2,233

- EMA 20: $2,318.22
- EMA 50: $
ETH-1.26%
  • 1
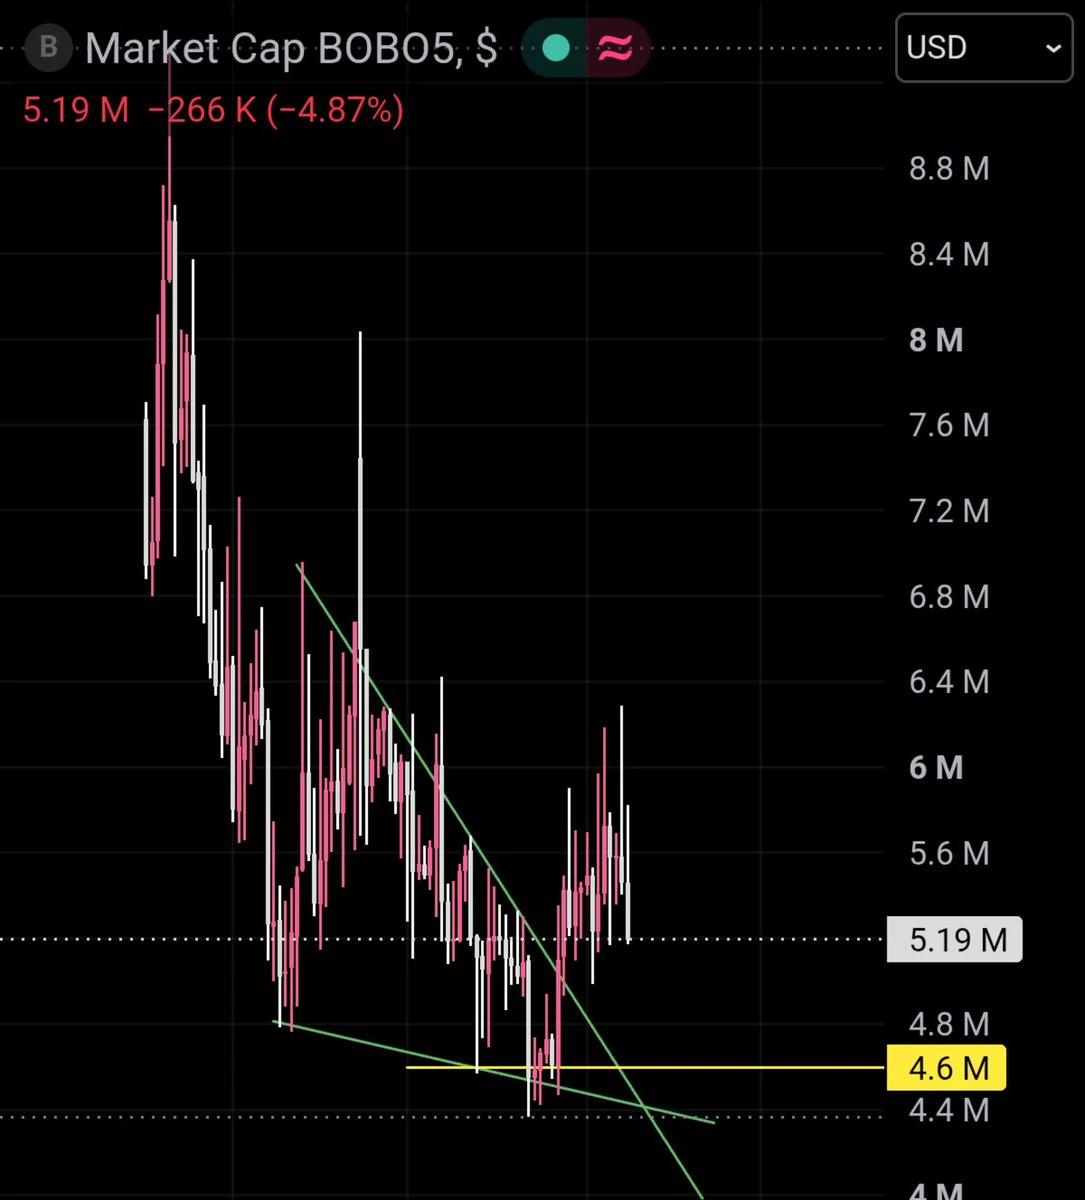
Full retrace?
$BOBO
post-image
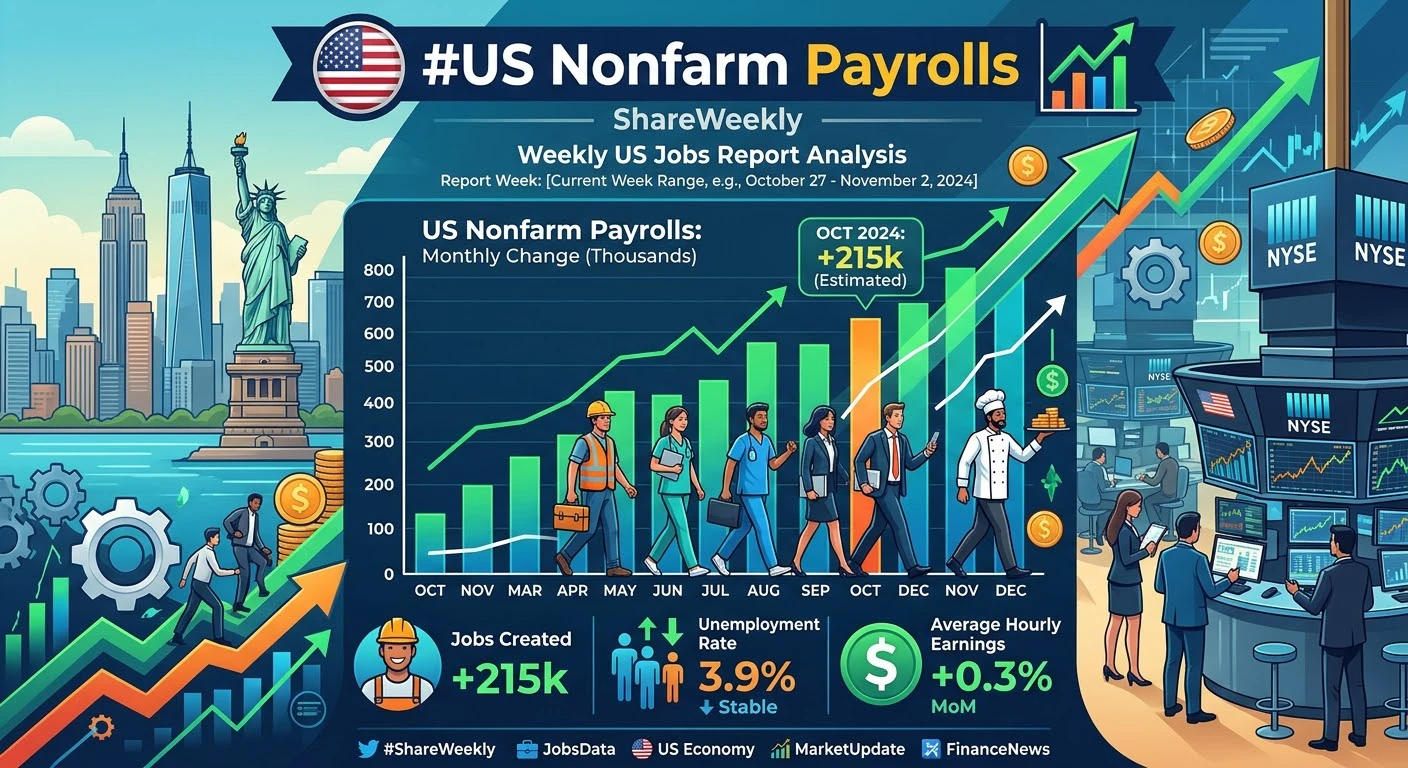
#USNonfarmPayrolls #ShareWeekly
US Nonfarm Payrolls: A Critical Indicator for the Global Financial Markets
The U.S. Nonfarm Payrolls (NFP) report is one of the most influential economic indicators in global financial markets. Released monthly by the U.S. Bureau of Labor Statistics, this report measures the number of jobs added or lost across the U.S. economy, excluding agricultural workers, private household employees, and certain other categories.
Why Nonfarm Payrolls Matter
Nonfarm Payrolls provide valuable insights into the health of the U.S. labor market and the overall economy. Strong em
post-image
BTC-0.67%
XAU+0.38%
Hey @opensea, I have an idea!
What if users earned a percentage of the trading fees whenever their Signals led to a purchase?
post-image
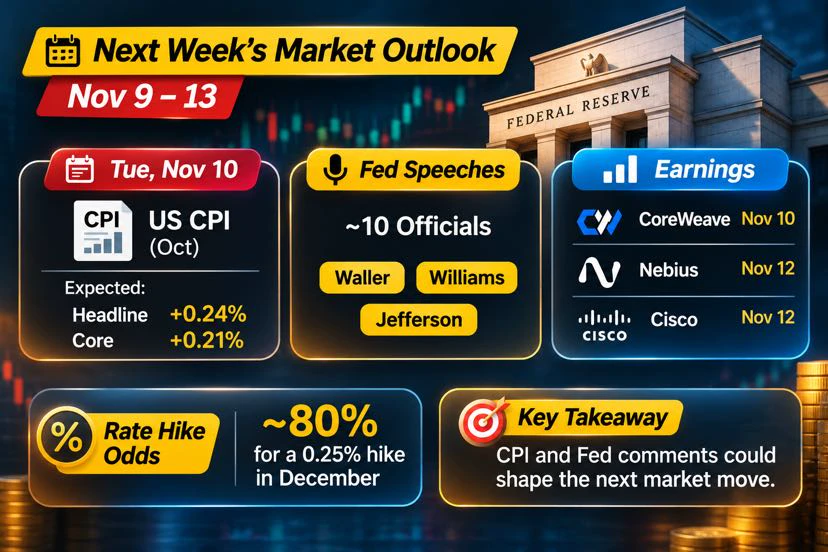
#USCPIDataIncoming
Next week could be an important one for the markets 👀
* Tuesday: US October CPI data.
* Tuesday: CoreWeave earnings.
* Thursday: Nebius and Cisco earnings.
* Friday: US October PPI data.
After stronger than expected jobs data, markets are now pricing in around an 80% chance of a 0.25% rate hike in December.
Hmm i think CPI will be the biggest event for the market. If inflation comes in higher than expected, it could put more pressure on rate cut hopes. AI earnings will also be interesting, especially for the demand for computing power.
For Bitcoin and crypto, I’ll be watch
post-image
CRWV+6.18%
CSCO-2.05%
BTC-0.67%
#Share My Holding Returns
another way up to the moon 🌝 if the market is going to respect the structure so we are good and catch the exact point and let's eep pushing it towards upside first to take the liquidity instead of downside. ♥️🎇🎆
#StockTalkSeason
post-image
$ERA ‌ is quietly building momentum again.

Price has recovered from the $0.05627 low and is now trading around $0.0755, with the daily Supertrend bullish at $0.05389. The recent candles show buyers gradually regaining control.

Key levels to watch:

Support: $0.0718
Next support: $0.0639
Major support: $0.0539
Resistance: $0.0814
Next target zone: $0.0840 to $0.0940

A daily close above $0.0814 would strengthen the bullish case. Until then, holding above $0.0718 remains important.

The recovery looks promising, but confirmation above resistance is what matters now.

$AMD ‌#Ahr999EntersBott
ERA+24.21%
AMD+11.55%
The crowd is waiting again, while corporations are buying Bitcoin by the billions #bitcoin #trading #crypto #indicators
BTC-0.67%
The U.S. Consumer Price Index (CPI) data for October will be released on Tuesday—with economists expecting annual inflation to rise from 3.7% to approximately 3.9%—followed by the Producer Price Index (PPI) data on Friday. The Federal Reserve’s next interest rate decision is scheduled for December 9, and the market is currently pricing in a high probability of a quarter-percentage-point hike. It is also worth noting that the commentary provided by Fed officials following these data releases will be closely monitored.

Why will these two key events drive the market?

The calendar for the coming
BTC-0.67%
ETH-1.26%
NVDA+2.80%
SPCX+8.74%
NAS100+1.90%
  • 13
  • 4
🚀 BTC LIVE: Bull Run or Big Crash? Where Is Bitcoin Heading Next?
live-cover
LIVE769
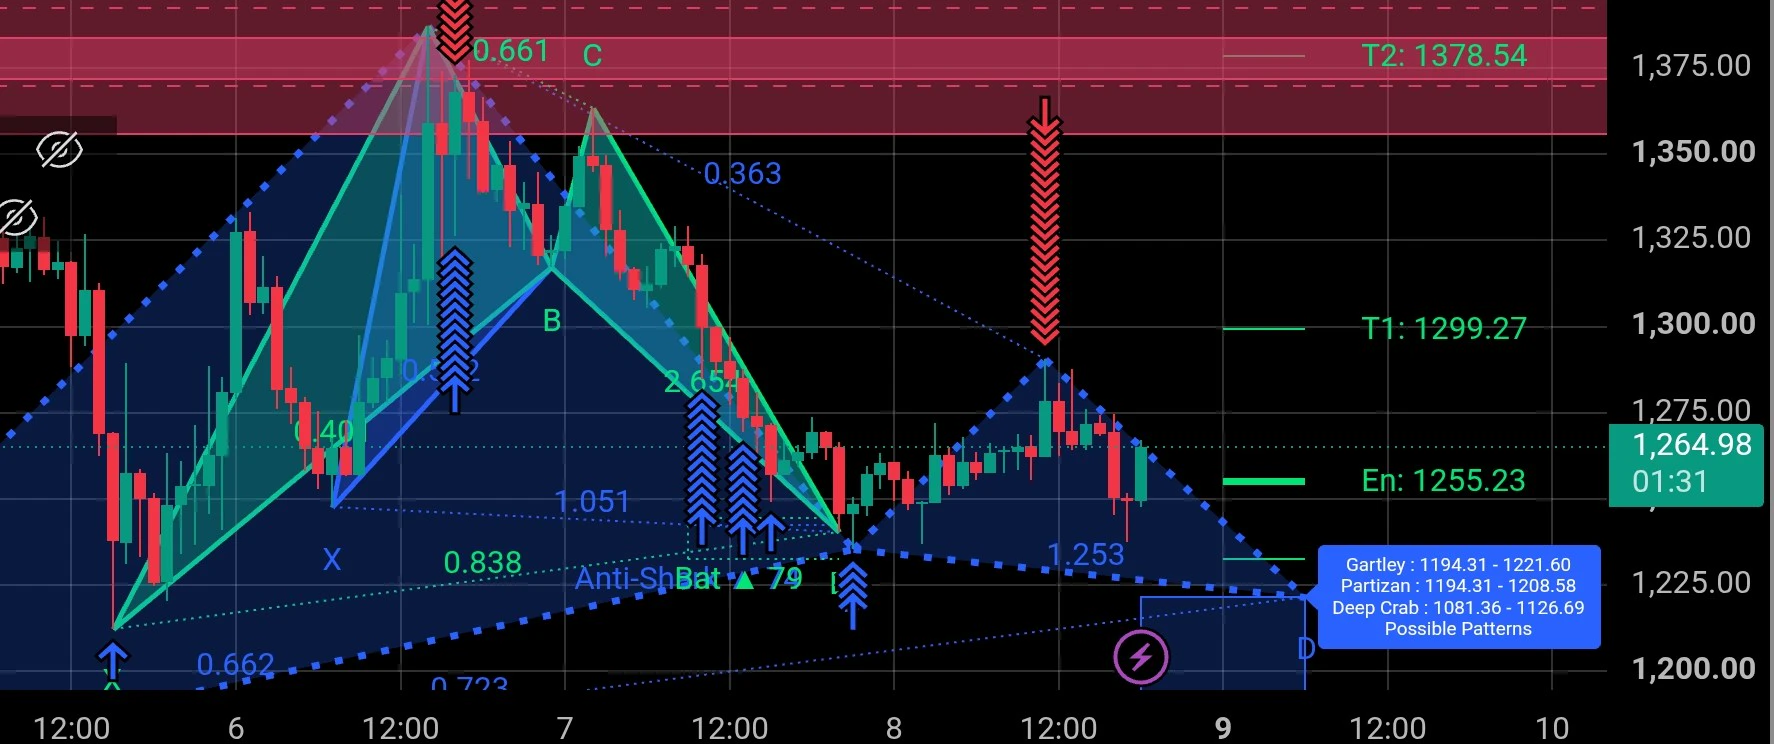
$ZEC Bat pattern formed and confirmed BUY at 1255 usd. See the formation and studied entry point , TP and SL. Some other patterns also coming soon if market moves in the right direction.
post-image
ZEC+1.29%
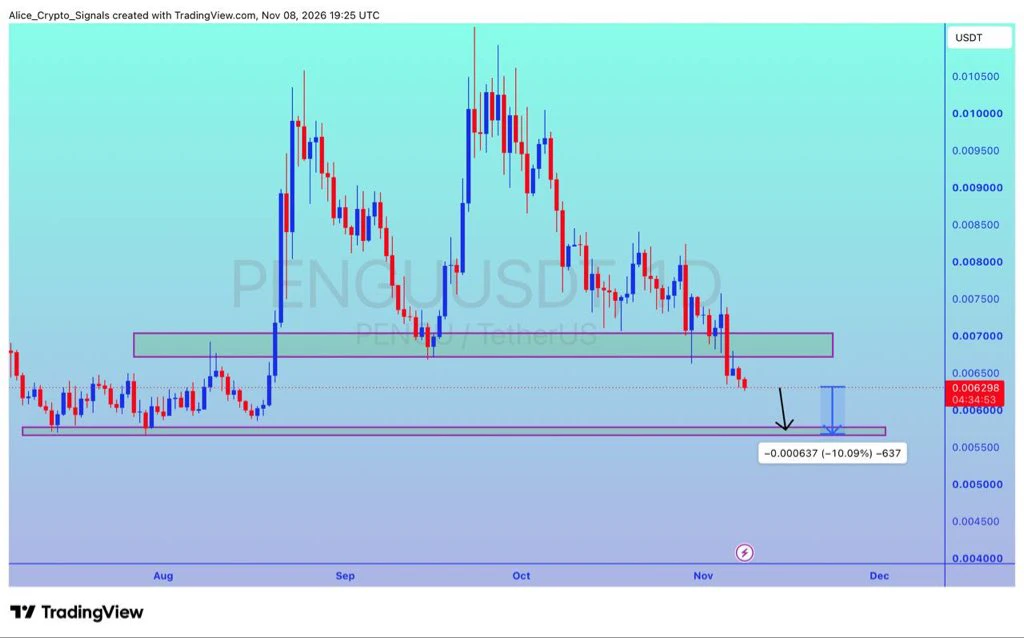
$PENGU
UPDATE
#PENGU already breakout done. In this move we can see 10%+ gain here ✍🏻
#PENGUUSDT #PENGUBTC #BTC #Bitcoin #NFTs
post-image
PENGU+0.40%
BTC-0.67%
  • 3
Entering crypto with 100 yuan, what you really need to guard against isn't the market—it's yourself
Let's do the math first: 100 yuan comes to less than 15U.
What can 15U do? With 20x leverage on ETH futures, a 1% price move makes your account wobble; a 5% move, and you won't even get a chance to recover. In other words, you're not trading—you're buying a heartbeat with the price of a meal.
But many people start exactly this way—the smaller the capital, the more they want to take a shot; the more they want to take a shot, the bigger the position; the bigger the position, the more one pullback
post-image
BTC-0.65%
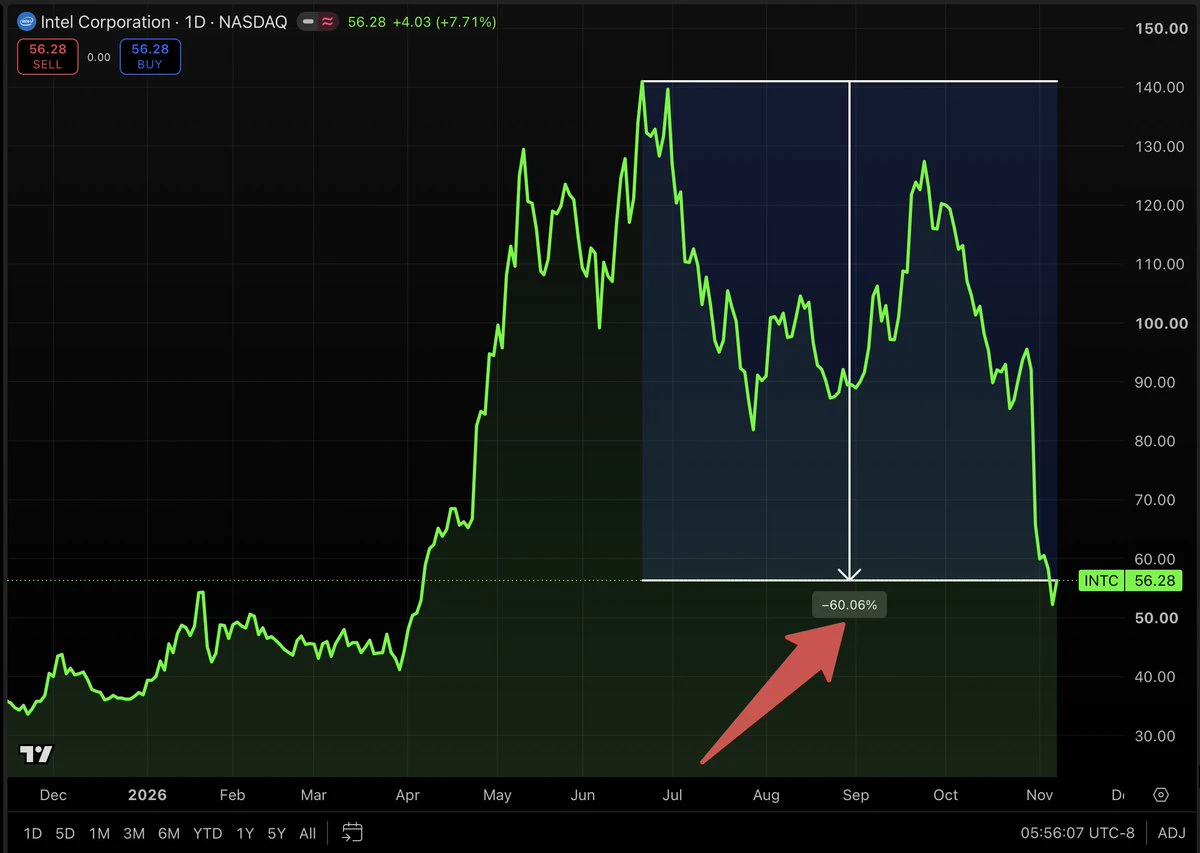
Intel is down about 60% from its high
People keep asking me if it’s a buy now because it’s “so cheap”
Is it though?
Revenue growth around 12%. A forward P/E around 40
Meanwhile Nvidia trades around 15x forward earnings with WAY faster growth. TSM is under 20x
So why would I pay 40x for 12% growth when I can pay half that or less for better companies growing faster?
This is the trap. People look at how far a stock fell instead of what they’re paying for the earnings
A 60% drop just means it was really expensive before & to be honest... $INTC still is expensive.
VALUATIONS MATTER!
post-image
INTC+8.00%
NVDA+2.80%
TSM+6.60%
Load More

Join 40 M users in our growing community

⚡️ Join 40 M users in the crypto craze discussion

💬 Engage with your favorite top creators

👍 See what interests you

Trending Topics

USCPIDataIncoming

15.13k Views1.66k Discussing

The U.S. October CPI report will be released on November 10 at 8:30 a.m. ET. September CPI came in at 3.7% year over year, and markets will be watching closely for signs that inflation is cooling, especially in core CPI. A softer-than-expected reading could strengthen rate-cut expectations, while hotter inflation may pressure risk assets through higher Treasury yields and a stronger dollar. How do you think this CPI print will move $BTC, U.S. stocks and gold?

USAIStocksHitHard

29.19k Views3.74k Discussing

USNonfarmPayrolls

56.39k Views4.5k Discussing

View More