Share your thoughts
placeholder
Article
Arc]🔹Arc teams public livestream has drawn community criticism
live-cover
LIVE82
$XRP Key Levels After the Selloff
Three technical zones are now in focus:
• ~$1.10 — first support
• ~$0.87 — deeper downside zone
• ~$1.65 — resistance if $XRP reclaims ~$1.78
The key isn’t the level alone.
Price reaction + volume will show whether these zones hold or break.
Until then, the broader structure remains unresolved.
BCRYTEX SIGNAL
Research First. Noise Last.
#XRP #Crypto #Trading
post-image
XRP+0.64%
$POWER SHORT SETUP | 1H
The current pullback offers a potential short continuation setup. Entry zone: 0.1313–0.13225 Stop-loss: 0.13709 Targets: TP1 0.11926 (2.36R) / TP2 0.11191 (3.74R) / TP3 0.10602 (4.85R) Partial take-profit: 30% / 30% / 40% Notes: Decision score is below the current activation threshold. Status: Watchlist only—wait for confirmation before considering this setup.
post-image
POWER-4.08%
Listen, $CROSS is showing a bullish reversal after a minor pullback........ Now is the time to open a long position. Entry: $0.1810 – $0.1830Target: $0.1880 / $0.1940 / $0.2000Stop-loss: $0.1711
post-image
CROSS+33.27%
GOLD SURGE
live-cover
LIVE336
New stuff Register firsthand Focused on missing nothing
post-image
$AR ~ one might politely disregard this chart when it stands as probably the next NEAR protocol
On the WEEKLY, it hangs about like a distinguished gentleman who has misplaced his belt after a lively evening supposedly “poised” for “marginal gains” after an extreme deviation.
On the DAILY, it is snuggling up to a double-rounded bottom. It must retest the green zone and hold above it, or it will be left in the dust. A tiny leveraged trade? Charming. That is exactly how trading accounts meet their maker 🤣🤣.
$Noiz I may be crazy, but I bought this bottom.
post-image
  • 3
$SOL Signal】Long + 1H breakout/order-book support
$SOL 1H RSI 62.94; selling pressure above 100.45 was quickly absorbed, with order-book imbalance at 12.23%.
🎯 Direction: Long
⚡ Entry/limit order: 100.1487 - 100.4500
🛑 Stop-loss: 99.4455
🚀 Target 1: 101.9568
🚀 Target 2: 102.7101
🛡️Trade management:
- Execution strategy: Take 50% off at Target 1 and move the stop-loss up to the breakeven level. If the price falls back to the entry level, exit automatically to protect the principal.
Depth logic: The 4H MACD histogram at 0.295 is expanding, while the 1H histogram at 0.1197 is contracting;
post-image
SOL+4.08%
After $ZHIPU surged to 96.92, I instead took 70% off first. It’s not that I’m bearish, but this level is right at the key prior-high resistance, so the risk-reward of chasing higher has deteriorated. The move up from 85.41 formed a breakout-pullback-breakout structure, with each pullback holding at a higher key level and volume expanding on the breakouts.

The key levels are clear now: the prior high is the first key level. If, after breaking through, price pulls back on declining volume and holds the upper boundary, that would create a new entry setup; if it only spikes above and then falls
post-image
ZHIPU+5.62%
LAB+4.30%
DOGE+1.96%
I had already finished complaining to my friends about this week’s market, but now I have to take it all back. A bit awkward.

A few days ago in the afternoon, the $BR long position held on the retest and buying pressure strengthened, so I signaled opening a long around 0.21096. Now at 0.66389, +4232.39% secured. It took off—those who were on board should have laughed themselves awake.

Take profit on 80% first, and protect the remaining 20% at the entry price. Don’t get greedy for the last bite; put the bulk in your pocket first.

Panic comes from having no plan, and losses come from over
post-image
BR+2.66%
ZEC+14.09%
BNB+2.36%
After $BCH surged to 232.55, I actually took 70% off first. It’s not that I’m bearish, but this level is right around the key previous-high resistance, making it less cost-effective to keep chasing. The move up from 221.80 formed a breakout-pullback-breakout structure, with each pullback holding at a higher key level and volume expanding on the breakouts.

The key levels are clear now: the previous high is the first key level. If, after the breakout, price pulls back on declining volume and holds the upper boundary, that would create a new entry setup; if it merely pushes higher and then fall
post-image
BCH+7.31%
ZEC+14.09%
DOGE+1.96%
$UNI Current price: 7.679. The first resistance above is the Bollinger upper band at 7.848, while support below is referenced at MA5's 7.63 and MA20's 7.127. These two lines are treated as the dividing line between bulls and bears because the current price has already risen above the bullish alignment formed by MA5 and MA20, with MA5 crossing above MA20 by an expanding margin, indicating a strong medium-term structure.
In a horizontal comparison, among the top gainers over the past 24h, $UNI rose 18.80% with a trading volume of 112.7M USDT, clearly stronger than $THE during the same period—
post-image
UNI+19.35%
THE+3.72%
MARSCOIN+36.62%
Does a bullish moving-average alignment always mean you should chase the upside? Not necessarily—the key is to look at the distance between the price and moving averages, as well as whether the momentum indicators are confirming the move.
Take $KORU as an example. The current price is 20.59, with MA5=20.57 having just crossed above MA20=19.852, forming a standard bullish alignment. The 24h gain is +10.46%, appearing strong on the surface. But note two points: first, the price is already approaching the Bollinger upper band at 21.3132, with a deviation of approximately 3.7% from the middle ban
post-image
SOL+4.08%
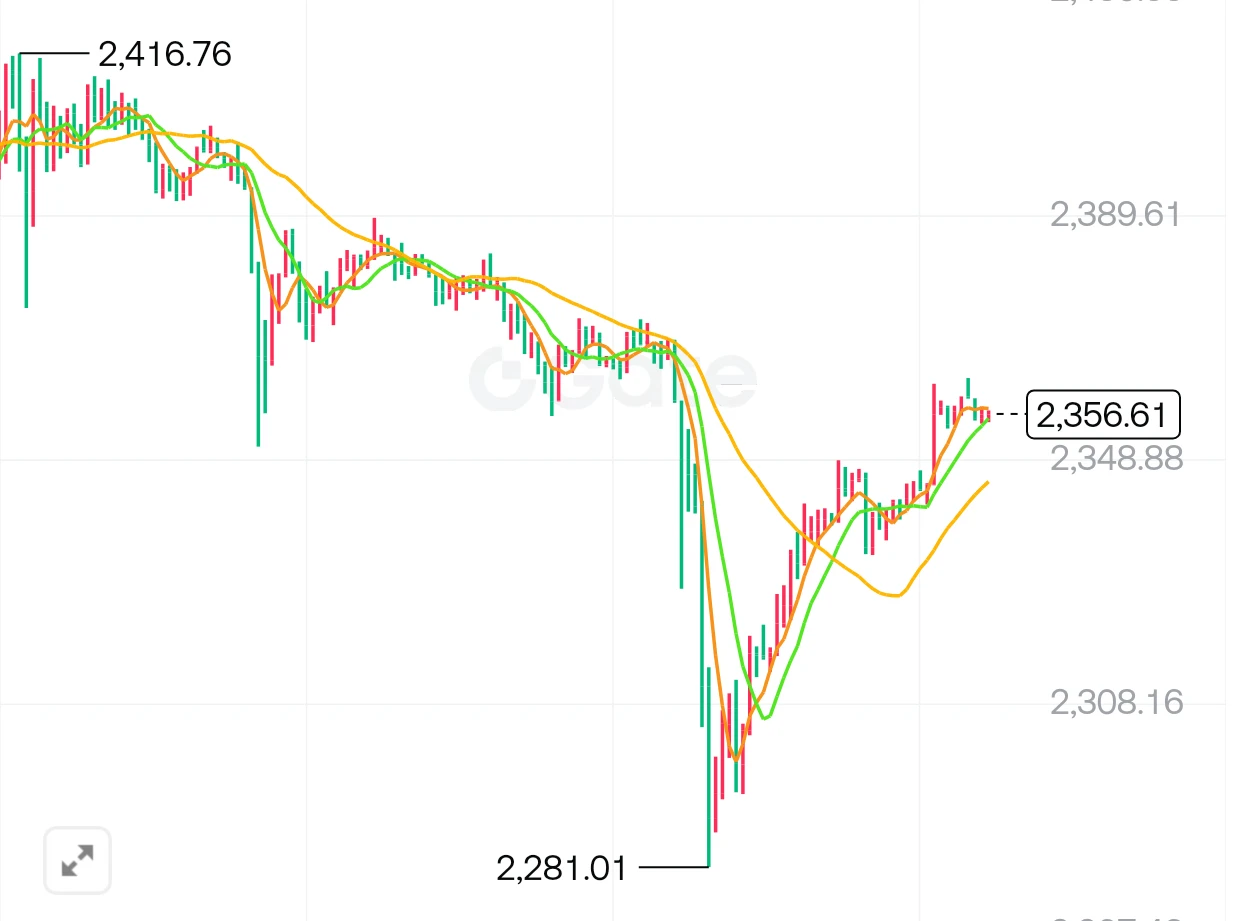
I’m taking a short on $ETH because price is moving into the 2,480–2,520 supply/resistance zone on the 4H chart.
My setup:
Entry: 2,480–2,520
DCA: 2,520–2,550
TP1: 2,360
TP2: 2,280
TP3: 2,200
SL: Above 2,560
Why I’m bearish: this area has acted as strong resistance, and price is now approaching it again. If ETH gets rejected from 2,480–2,520 and loses the 2,400 support area, I expect downside continuation toward 2,360 first.
The short setup stays valid while price remains below the resistance zone.
post-image
ETH+2.28%
The market does not explain itself; it only moves. Your job is simply not to make reckless moves.
When I checked the chart after lunch, $AKE held firm after a pullback and buying pressure strengthened. I judged it worth waiting for, with just one reminder: hold once it stabilizes.
From 0.0101698 all the way to 0.0210384, it took off +2624.68%. Those on board should be grinning in their sleep. Time to enjoy a good meal.
Take 80% in profits first, protect the remaining 20% at the entry price, and let the profits run if it keeps surging.
Don’t let profits inflate your ego, and don’t despair over
post-image
AKE+10.96%
LAB+4.30%
ADA+4.51%
🩸 Nike’s turnaround story is facing another serious test.
$NKE recently traded near $36, around its 52-week low and roughly 12-year lows.
Then came another warning from Wall Street:
Robert W. Baird downgraded Nike from Outperform to Neutral and cut its price target from $70 to $44.
Nike is also set to leave the S&P 100 on September 21, ending an almost 18-year run in the index.
But there’s an important distinction:
Nike is leaving the S&P 100 — not the S&P 500.
The stock will remain in the broader S&P 500.
The bigger issue is what happens next.
Nike’s market value has fallen sharply over the
post-image
NKE+1.03%
  • 1
$MARSCOIN - Short-term
Entry: 0.1162 Take-profit 1: 0.1100 Take-profit 2: 0.1035 Take-profit 3: 0.0960 Stop-loss: 0.1225 The price is testing the upper boundary of the recent range; if buyers fail to sustain momentum, there is still room for a pullback.
post-image
MARSCOIN+36.62%
I think this might've been the biggest bear trap ever.
That move to $58k really did its work.
Only to now deviate back above.
You gotta respect it.
The Market makers really used the 4 year cycle to lead the majority astray.
And it worked like a charm.
Bitcoin has now reclaimed that deviation, and max pain is higher for the sidelined beras.
Once we've figured out this next low...
Send it much higher.
post-image
BTC+0.98%
In a recession, the deficit reaches 12% of GDP and annual interest payments hit 3 trillion, compressing the fiscal margin for error
The underlying logic of macro risk pricing is undergoing a profound shift, with market focus moving from a simple tug-of-war over growth expectations to a dual examination of debt sustainability and technological compliance. As high interest rates coincide with slowing economic growth, fiscal room for error has been sharply compressed, and any quantitative analysis of a recession scenario could easily trigger a drastic repricing of assets. Meanwhile, the debate wi
Load More

Join 40 M users in our growing community

⚡️ Join 40 M users in the crypto craze discussion

💬 Engage with your favorite top creators

👍 See what interests you

Trending Topics

GateTopsStockPerpetualCoverage

36.25k Views1.87k Discussing

According to the latest DefiLlama report, Gate has listed 385 stock-related perpetual contracts, ranking first in coverage; average daily volume is about $1.15B and average open interest about $738M, both ranking third in the industry; liquidity depth for its five highest-volume contracts — SNDK, SKHYNIX, SPCX, SOXL, and MU — ranks first across the board. How do you view Gate leading in both coverage breadth and liquidity depth? [👉 Full Report](ttps://defillama.com/research/spotlight/deep-enough-trade-gate-case-tokens-stocks)

GateTrenchesExclusive0GasTrading

46.3k Views869 Discussing

FedHikes25bpsForFirstTimeIn3Years

32.62k Views8.49k Discussing

View More