Share your thoughts
placeholder
Article
No sense of scale, can’t hold on—the profits on this trade are paper-thin, but I’m absolutely loving it.
When the screen was glowing green, I set my sights on $WLD . The price repeatedly retested 0.3669 but managed to hold, and this kind of resilience in a weak market looked more like a signal light. While everyone else was running, I went long with a small position instead. Unexpectedly, the market really came through, climbing all the way to 0.4022, for a return of +681.22%.
Sideways movement at the bottom is an accumulation of strength, while holding firm after a retest shows confidence. Wea
post-image
WLD+3.43%
LAB-2.48%
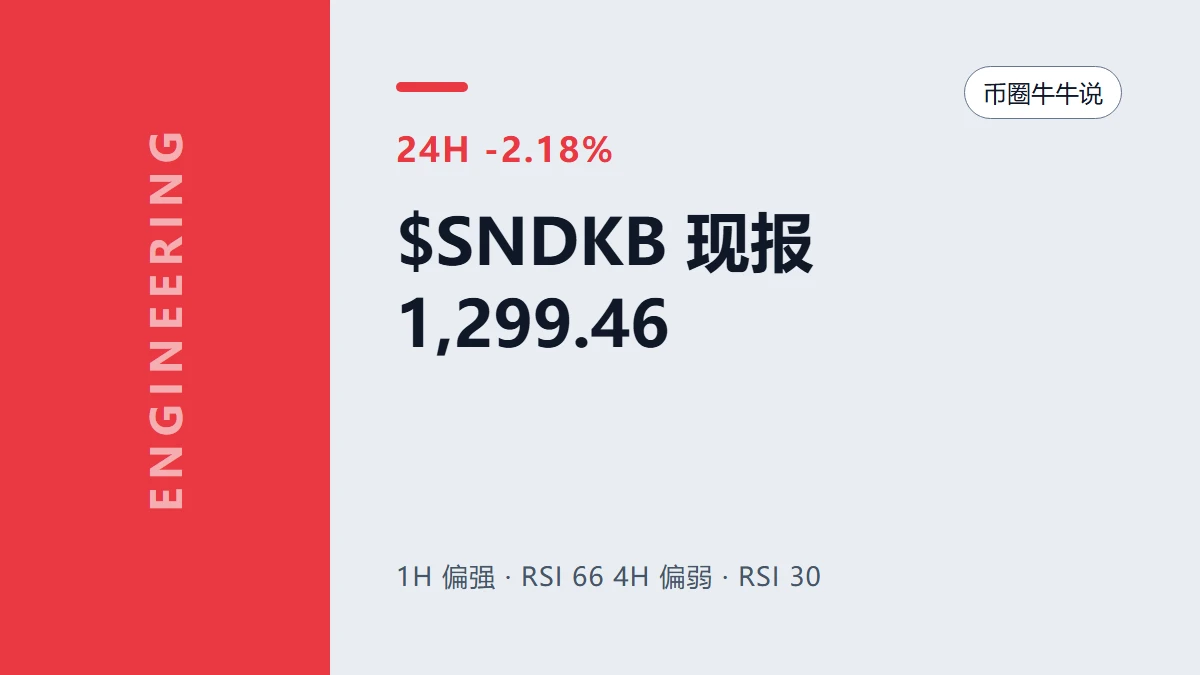
SNDK+1.58%
$FLOCK Signal】Bullish continuation: 1H pushes into the upper band + 4H MACD expansion
$FLOCK 1H broke above the upper Bollinger Band to 0.0818, and the current price of 0.07788 is above the 4H upper Bollinger Band at 0.0769. The 4H MACD histogram expanded to 0.0026, with momentum continuing. RSI is 73.5 on 1H and 78.8 on 4H, remaining elevated without falling. Sell-side depth is approximately twice the buy-side depth, but the price has ignored the pressure. The funding rate is -0.0138%, with the negative value persisting. OI is stable, with no position retreat seen after the volume increase.
post-image
FLOCK+39.40%
SUSHI SushiSwap. Rotates with ARB and UNI in the DeFi rotation. DEX governance tokens will be bought up first when L2 sentiment recovers. Moderate volume, deeper than XAN and EPIC.
$SUSHI
post-image
SUSHI+21.16%
Everyone’s still bidding $SOL /USDT at 106—but the 4h tape just flipped a quiet kill switch.

$SOL /USDT - SHORT

Trade Plan:
Entry: 106.37 – 106.85
SL: 109.60
TP1: 104.37
TP2: 102.87
TP3: 100.63

Why this setup?
Why now? The 1D range is your cage, and 77% confidence says we test the floor.
• RSI 15m at 62.6—late buyers are chasing a fading bounce.
• ATR 1h at ~0.96: volatility is tight, but breakouts sting.
• Entry 106.61 targets: TP1 104.37, TP2 102.87, TP3 100.63.
• Stop 109.60 caps the upside trap—respect the invalidation at 102.89.
The range top rejects, and the path of least
SOL+4.19%
I just casually tapped refresh, and it went up on its own, leaving me in a very passive position. When the screen was glowing green across the board in the early session, $BCH hovered around 247.31 for ages without breaking down. That kind of bottom consolidation looked to me like accumulation, so I directly called for a long. Those who dared to follow already did.

Don’t lose your patience grinding through a range, only to try to regain your dignity in a one-way move.

I just took a look—the current price is 260.36, and the +374.96% profit is safely in the bag. No need to say much: take pro
post-image
BCH+3.75%
ZEC+17.29%
BTC+0.39%
$7 UNI: are you chasing the rally or sitting it out?
Look at the surface first: it has gone parabolic, but is starting to pull back.
From the $2.3-$3 lows in early June, UNI has produced a steep primary uptrend. It has risen 30-50% over the past week and more than 70% over the past month, touching an intraday high of $7.48 today before falling back to around $7. The weekly chart has just broken above and confirmed the upper boundary of the 4.90 mid-term range, and the mid-term target of 7.56 has already been reached. Daily RSI has surged to around 80, while MACD momentum is slowing—the trend i
post-image
BTC+0.39%
ETH+1.98%
UNI+11.99%
Why is everyone still long ESPORTS while the 1D trend screams capitulation?

ESPORTS/USDT - SHORT

Trade Plan:
Entry: 0.01459 – 0.01465
SL: 0.01494
TP1: 0.01438
TP2: 0.01422
TP3: 0.01398

Why this setup?
- 95% confidence SHORT on the 4h — that’s not a guess, it’s a signal.
- RSI 15m at 40.94: momentum already broken, no bounce fuel left.
- Entry 0.01462 sits just above TP1 (0.01438) — the path of least resistance is down.
- ATR 1h (0.000134) shows tight coils → explosive moves favor shorts when trend is bearish.

Debate:
Are you fading this 95% short into TP2 (0.01422) or calling the
ESPORTS-1.62%
I made dinner today 🥳✌
$ZIVIDEND going higher after graduating from @LaunchOnSF 🫢
I can’t convince you now
But we’re going to $200m mc
Hold your ZIVIDEND and $ZEC
Ca:
9XqW82GbV8TSuFGLS5qZjpMmL8F2BZ2AaWyC68px37hc
post-image
ZEC+17.30%
Fed Rate Bets Shift Again! Could Changing Expectations Move BTC & ETH?
live-cover
LIVE812
Everyone’s chasing longs on $LAB /USDT—but the 95% confidence short says you’re already late.

$LAB /USDT - SHORT

Trade Plan:
Entry: 0.07243 – 0.07287
SL: 0.07471
TP1: 0.07110
TP2: 0.07007
TP3: 0.06852

Why this setup?
Why now?
- 4h bias is SHORT with a 95% score—rare conviction.
- 1D trend is bearish, and the 15m RSI at 39.17 shows momentum is still fading, not reversing.
- Price sits at 0.07265, but the real target is 0.07110 (TP1) then 0.07007 (TP2)—that’s a 3.5% drop before any bounce.
- ATR (0.00086) says volatility is contracting; breakouts are violent. Don’t wait for the can
LAB-2.48%
[New Streamer] Whales Move in Sync!
live-cover
LIVE1,874
#USELESSSurgesAnother67%
USELESS +67%: Why Insider Distribution Matters More Than Influencer Conviction for Sustainable Edge
USELESS hit $213M MC (+67%) after Bonk Guy’s call, with his position up $1.68M. But influencer conviction is often a cover for insider exit liquidity. The real edge lies in validating whether this surge is driven by organic retail absorption or merely coordinated distribution from early wallets. Here’s my validation framework. 👇
🔍 Why Distribution Topology Determines True Value
• Wallet Concentration vs. Holder Count Divergence: If market cap rises but unique holder
USELESS-3.43%
BONK+0.66%
The year-end Bitcoin target price given by major global financial institutions and top AI models has reached $95,000–$150,000 per coin, while Ethereum’s target is $3,175–$4,500 per coin; patiently hold spot #BTC收复8万美元
TradingKingGaoYuliang
Core Logical Reasoning
Driver 1: Macroeconomic Monetary Environment (the Biggest Short-Term Variable)
• Current Headwind: The probability of a rate hike in September has risen to 62%, while the rate cut previously expected by the market has yet to materialize. The Fed’s dot plot shows rates at around 3.25%–3.40% by the end of 2026, but CME FedWatch pricing puts the probability of a rate cut this year below 10%.
• Key Timing: The September FOMC meeting (mid-to-late September) is the short-term watershed moment. If a rate hike is implemented, BTC could fall to $72,000–$75,000 in the short term; if the Fed unexpectedly pauses, the Q4 rally could begin immediately.
• Powell’s Term: His term expires in May 2026. Changes in the Fed’s leadership will bring policy uncertainty, but the market has gradually priced this in.
Driver 2: ETF Fund Flows (Structural Support)
• Pressure in the First Half: Spot BTC ETFs saw monthly net outflows of $4.06 billion in June, the largest redemption record since their launch, directly causing BTC to fall from $110,000+ to the July low of $59,000.
• A Turning Point in August: Over the past 60 days, Bitcoin whales have accumulated approximately $2.75 billion, while ETFs turned back to net inflows in late August (exceeding $1 billion in a single week). Exchange balances continue to decline, with investors shifting to cold storage, indicating that selling pressure is drying up.
• Solid Cumulative Base: Cumulative net inflows into spot BTC ETFs remain at approximately $55 billion, with total assets under management of around $109 billion. This is the biggest difference between this cycle and previous ones—institutional capital is already in the market rather than waiting on the sidelines.
Driver 3: Cycle Position (Deeply Corrected)
• BTC’s maximum decline in the first half of 2026 was approximately 30% (from $111,000 at the beginning of the year to $59,000 in July), and its current price of $80,000 is in the middle of a rebound.
• Historically, in post-halving cycles (the April 2024 halving), the second Q4 often sees a second wave of gains due to reduced miner selling pressure and an institutional allocation window.
• However, it should be noted that this cycle is more institutionalized, so volatility may be smoothed out, making a repeat of the multi-fold gains seen in 2021 unlikely.
Driver 4: Ethereum’s Independent Logic
• ETH/BTC Exchange Rate: Currently around 0.031, it is in a historically low range. If risk appetite recovers in Q4, ETH typically has greater upside elasticity.
• Stablecoins and Tokenization: Standard Chartered raised its year-end ETH target from $4,000 in June to $7,500, primarily because the growth in network utility driven by stablecoin issuance and asset tokenization has not yet been reflected in the price.
• Yield Characteristics: ETH staking provides an annualized yield of approximately 3%–4%, making ETH more attractive than BTC as an “interest-bearing asset” in a falling-rate environment.
• Risk: Spot ETH ETF inflows remain consistently weaker than those of BTC. If this trend continues, ETH may continue to underperform.
IV. Key Indicators to Watch (Tracked Over the Next 3 Months)
1. September FOMC Decision: Rate hike vs. pause will determine the direction of Q4’s opening
2. Weekly Net Inflows into Spot BTC ETFs: Three consecutive weeks of positive inflows = confirmation of a bottom
3. Whether BTC Can Hold Above $85,000: This is the 200-day moving average level; holding above it would open up room toward $100,000
4. ETH/BTC Exchange Rate: A break above 0.035 = a signal that ETH is beginning to outperform
5. U.S. Inflation Data: If CPI continues to decline, rate-cut expectations will heat up again#美国8月非农超预期
BTC+0.39%
ETH+1.98%
MARKET ALERT - BMNR
Chart Analysis
Timeframe 1 Hour (1H TF): The trend is undergoing a bullish recovery after a sharp correction. The current price at 25.82 is moving above EMA20 (25.51), EMA50 (25.28), and EMA200 (24.64). The upward-crossing EMA alignment indicates strong short-term momentum toward the local resistance area at 26.60.
Timeframe 4 Hour (4H TF): The main trend remains strongly bullish. The price is holding solidly well above EMA20 (25.16), EMA50 (24.69), and EMA200 (22.02). The previous correction was successfully supported at the EMA support area and formed a higher low, indica
BMNR+3.65%
  • 4
  • 2
JUST IN: China launches the National Anti-Fraud AI App to assess risk and provide prevention guidance using LLMs and multimodal tech. Could boost consumer trust and curb fraud around digital assets and fintech services. $BTC $ETH
post-image
BTC+0.39%
ETH+1.98%
Everyone’s watching XRP’s 1.42 wall—but the 4h chart is whispering a different secret.

$XRP /USDT - SHORT

Trade Plan:
Entry: 1.4162 – 1.4208
SL: 1.4402
TP1: 1.4022
TP2: 1.3913
TP3: 1.3751

Why this setup?
- Price is pinned at 1.4185 with a tight 1h ATR of 0.009—compression before expansion.
- RSI 15m at 51 is neutral, but the daily trend is *range*, not bull—so shorts have room to breathe.
- Our short targets are stacked: 1.4022 → 1.3913 → 1.3751, with invalidation only below 1.4078.
- Why now? The 4h structure says “sell the top of the box,” and we’re sitting right on the lid.

De
XRP+1.19%
#Gate事件合约晒单挑战
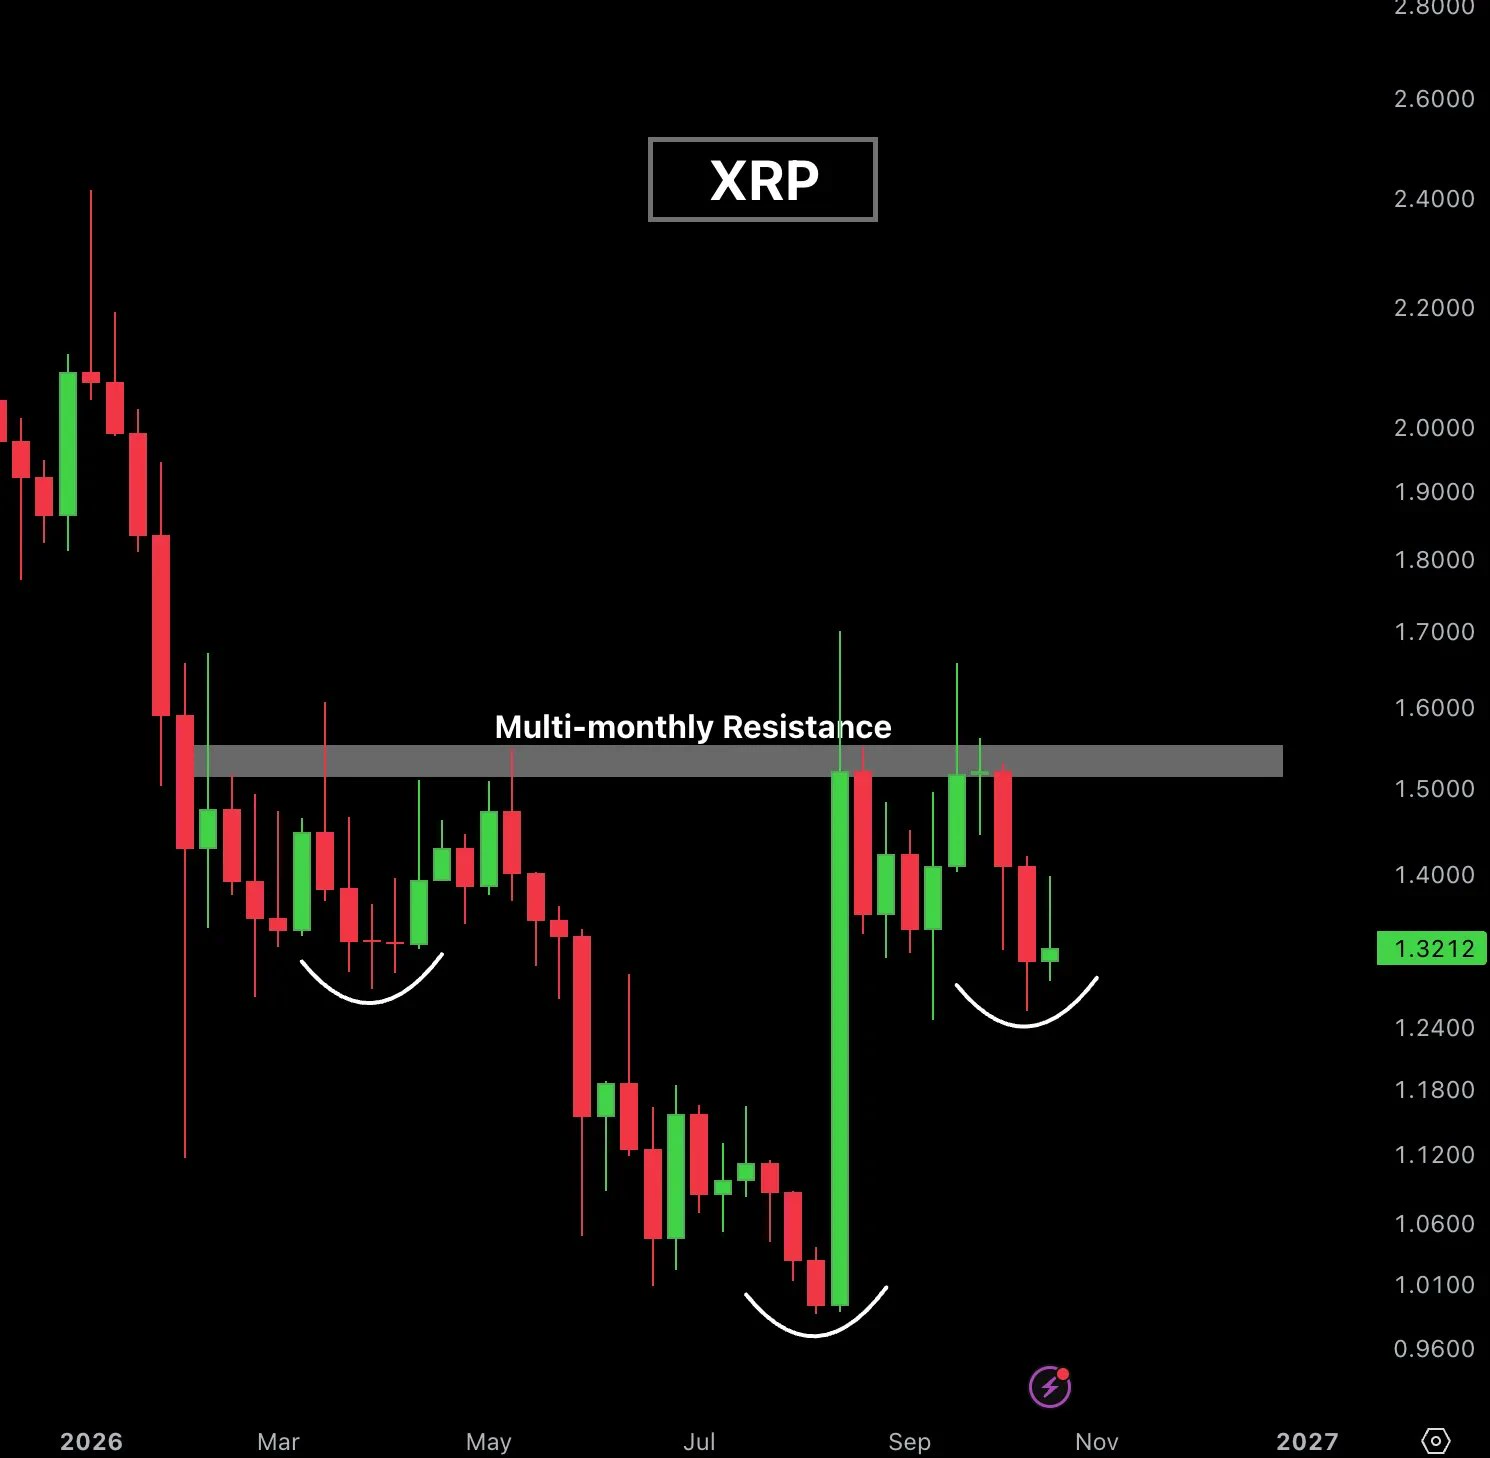
#XRP Ledger Shows Bigger Value Despite Fewer Active Accounts
Q2 ACTIVITY SHIFT
The latest XRP Ledger data shows an interesting divergence in network activity. Daily active accounts fell 24% year over year to 16,600, but average daily order-book volume increased 79% to 3.57 million XRP.
That combination matters. Fewer active accounts are participating, yet the amount being traded through the order book has increased significantly. This suggests that the activity that remains is becoming more concentrated around larger transactions rather than being driven purely by a growing num
post-image
XRP+1.15%
RLUSD+0.02%
  • 2
  • 1
Silver’s quiet 66.29 level is the trap door most traders won’t see until it snaps.

$XAG /USDT - SHORT

Trade Plan:
Entry: 66.27 – 66.31
SL: 66.50
TP1: 66.13
TP2: 66.03
TP3: 65.87

Why this setup?
- Price is pinned at 66.29 with a 4h SHORT bias (55% confidence)—not a screaming sell, but a tactical fade.
- 1D trend is *range*, so this isn’t a breakout play; it’s a mean-reversion scalp inside the box.
- RSI on 15m at 55.02 shows mild upside heat, but ATR (1h: 0.087) is thin—moves will be quick, not violent.
- Why now? Entry zone (66.27–66.31) is hugging the reference, with TP1 at 66.13
XAG+0.09%
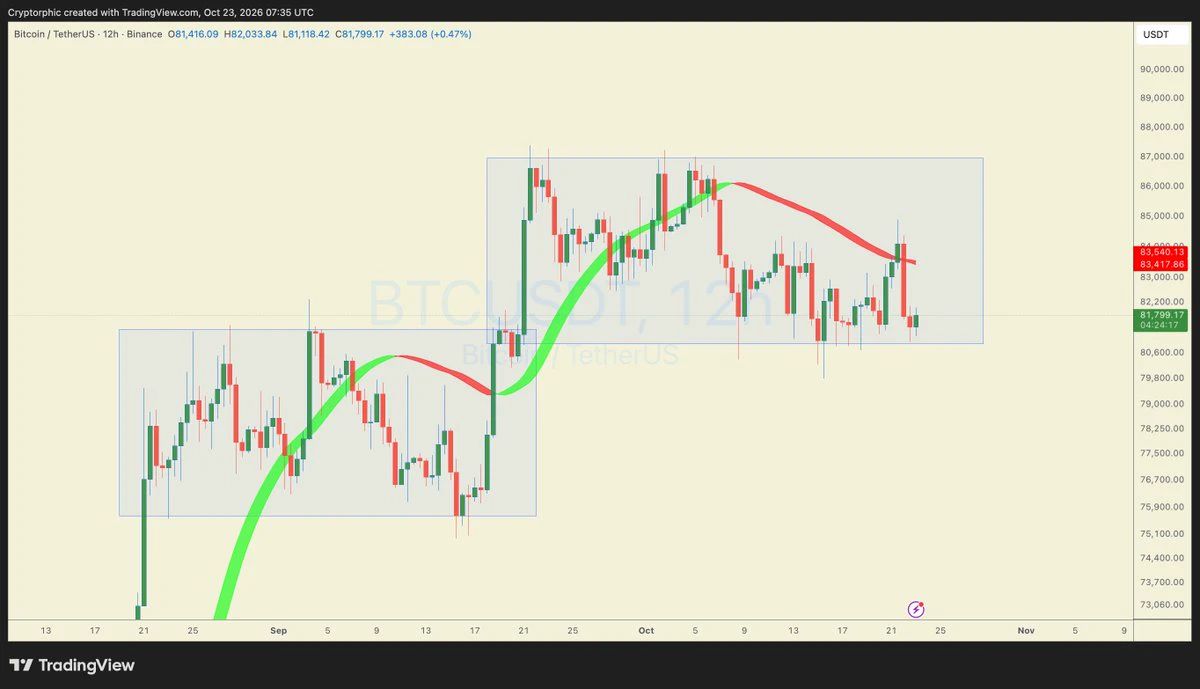
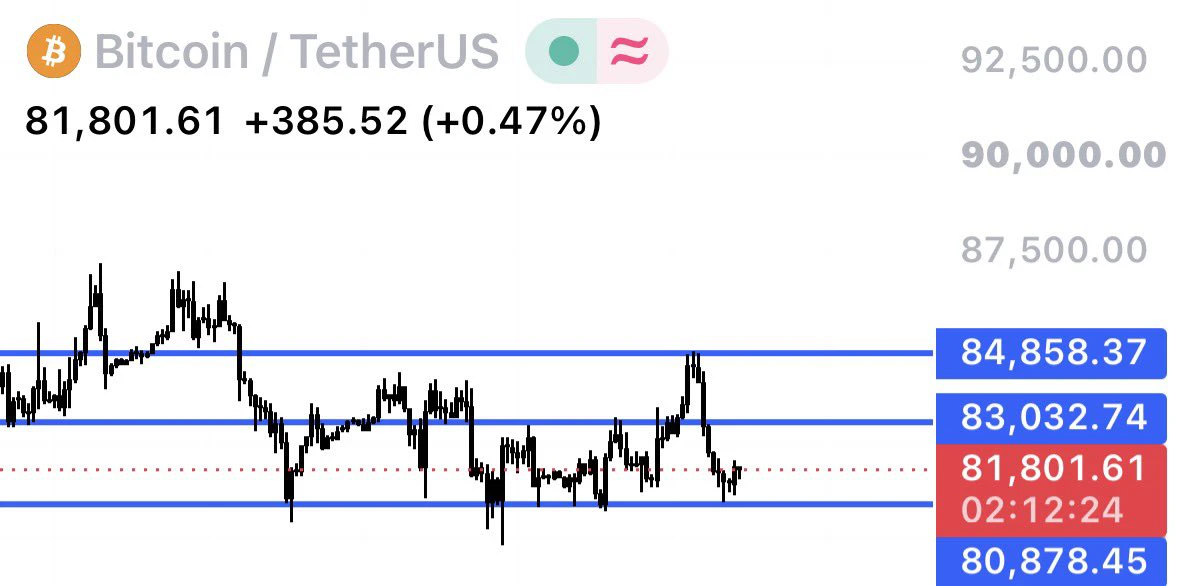
BTC is consolidating in a narrow range near the $80,000 mark, up 0.19% over the past 24 hours and +2.17% over the past 7 days. Spot ETFs saw net inflows of $3.8 billion over three weeks, while Thailand’s former prime minister publicly voiced support for a national Bitcoin strategic reserve, providing support at the bottom; meanwhile, concerns over the unwinding of yen carry trades are suppressing breakout momentum—the range-bound pattern may persist in the short term, with direction depending on subsequent events such as the Federal Reserve decision and the Senate CLARITY vote#美国8月非农超预期
post-image
BTC+0.39%
Load More

Join 40 M users in our growing community

⚡️ Join 40 M users in the crypto craze discussion

💬 Engage with your favorite top creators

👍 See what interests you

View More