







Square
Following
Hot
News
Profile
Share your thoughts
placeholder
Article
Real Vision Founder: Why Are Most Public Blockchains Destined for Elimination?
[Plain-language guide] Most blockchains will eventually become ghost towns—not because they are scams, but because this is the norm in capital operations, much like the aftermath of the bursting internet bubble.
The few chains that survive stand out through sovereign economies, specialized positioning, or platform dependence.
Investors should focus on user density, stablecoin growth, and developer inflows—not price fluctuations—to identify the true winners.
See 👉 for details:
post-image
Us stocks and BTC both come under pressure
live-cover
LIVE2,858
Dominant cycles eventually become intracycle harmonics of larger dominant cycles
Don't feel the effect of the four year quite as much?
As an asset matures, 4 becomes 8
8 becomes 16
etc.
post-image
BIG BREAKING
🇺🇸 US PPI at 6.3% Expectations: 5.3% Highest in 4 years.
THIS IS VERY BAD
post-image
The prior forecast continues to play out✅
Previously noted that a rebound into the 81500-82000 resistance zone could be shorted; the market encountered resistance and pulled back as expected, smoothly moving downward and providing 1000 points of room. The pace completely matched the forecast.
Only trade with the trend, align knowledge with action, and move forward steadily.$BTC
BTC-2.96%
SKDD tops the $12 mark! Tokenized US stock SKDD continues to climb—where are the funds in the mapped basket heading?
The stock perpetual-form SKDD remains strong, rising 21.22% in a single day to $12.024 ($9.69 on 10/13).
No standalone corporate earnings reports were released today. Together with BSP, it forms today's US stock-mapping concept basket, with funds showing continuous wash trading and stepwise pushing higher.
Conclusion: This is a capital-driven price push in a US stock-mapped asset. Trading depends on the US stock market's opening trend; do not confuse it with on-chain crypto prot
post-image
SKDD+15.79%
$ETH ‌
Today's three data points:
PPI➕initial jobless claims➕monthly retail sales, all bearish!
I have already shorted ETH, with a take-profit target around 2280 and no stop-loss for now.
Rising PPI means higher costs, which inevitably have to be passed on to consumers, while today's monthly retail sales did not signal cooling consumption. This means household willingness to spend remains strong, even with high prices.
PPI production costs + household purchasing power are both driving inflation higher, because monthly retail sales measure total consumption spending!
Initial jobless claims als
WildfireAlpha
Yesterday’s CPI data was bearish, with both the core monthly and annual rates exceeding expectations!
Tonight will bring the PPI data and the U.S. September retail sales monthly rate, both of which are also somewhat related to inflation.
PPI is the Producer Price Index. A reported figure > the expected figure is bearish,
and the same applies to the retail sales monthly rate: reported figure > expected figure = bearish!
Simply put:
Rising raw-material PPI (Producer Price Index) → higher production costs for factories → after some time, factories pass on the higher costs → higher supermarket retail prices (CPI rises) → higher inflation!
This time, CPI moved ahead of PPI, which is a rare occurrence.
Retail sales monthly rate:
This measures the total amount ordinary people spend buying physical goods!
In other words, when ordinary people are willing to spend heavily (strong retail data) → strong demand for goods → merchants dare to raise prices → inflation rises!
The relationship with CPI is that CPI measures how much prices have risen, while retail sales measures how much money was spent in total—it reflects consumption capacity! Sufficient consumption capacity and a willingness to spend are also among the drivers of inflation.
Strong consumption (high retail sales) → strong demand → more likely to push CPI prices higher
We will not forecast the data. It is most prudent to assess whether it is bullish or bearish after the data is released, based on the reported figure.
Next comes Waller’s speech on Friday. This CPI reading was bearish, so let’s see whether Waller’s remarks are dovish or hawkish!
There are basically no other macroeconomic events this week, so we can just look forward to the weekend. #美国9月CPI超预期 #美国9月PPI数据公布
repost-content-media
ETH-5.27%
🚨🔥 BTC MARKET ALERT — BREAKOUT OR PULLBACK? ₿📊
Bitcoin is trading around a major decision zone, and the next move could change the market mood! 🚀🐻
📈 Will BTC bulls push toward a stronger recovery, or will sellers take control and trigger another pullback?
💬 HOT TRADER QUESTION: Are you expecting a bullish breakout or a bearish correction? Share your thoughts and market outlook in the comments!
🎯 Watch the market carefully, manage your risk, and never trade based on hype alone.
Stay alert, trade smart & always DYOR! ❤️
— Hot Trader ⚡
#GateSquare #BTC #Bitcoin #CryptoMarket #HotTrader
BTC-3.04%
📊 CPI yesterday, PPI today— inflation has repeatedly exceeded expectations. How will the market respond?
U.S. PPI rose to 6.3% year-on-year in September and increased 1.3% month-on-month, once again surpassing market expectations.
Combined with the previously stronger-than-expected CPI data, inflationary pressure has once again become the market’s focus.
But interestingly, the market has not moved in a single direction:
📉 BTC has pulled back to around $80,000, putting bulls to the test
📊 U.S. tech stocks are under pressure as funds begin reassessing risk
🥇 Gold rebounded intraday as safe-h
GateSquare
📊 CPI yesterday, PPI today— inflation has repeatedly exceeded expectations. How will the market respond?
U.S. PPI rose to 6.3% year-on-year in September and increased 1.3% month-on-month, once again surpassing market expectations.
Combined with the previously stronger-than-expected CPI data, inflationary pressure has once again become the market’s focus.
But interestingly, the market has not moved in a single direction:
📉 BTC has pulled back to around $80,000, putting bulls to the test
📊 U.S. tech stocks are under pressure as funds begin reassessing risk
🥇 Gold rebounded intraday as safe-haven demand and interest-rate expectations continue to clash
With inflation continuing to heat up, will the Federal Reserve remain on hold in October?
For traders, more important than correctly guessing the data is knowing how to adjust their strategy after market conditions change.
💬 Are you currently more inclined to reduce positions and seek safety, look for opportunities to buy the dip, or wait for the market to stabilize?
Bring #美国9月PPI大超预期 to Gate Square and share your macro outlook, BTC trend analysis, or real trading activities.
The data is now out; next, it all comes down to which direction the market chooses.
repost-content-media
BTC-3.04%
XAU+1.19%
XAUUSD+1.24%
Shill me a memecoin that'll make me rich
post-image
MEME-5.28%
Analysis crypto market
live-cover
LIVE2,838
$BTC Once again, the bull market has been declared over! Every time there is a major drop, someone claims Bitcoin is finished! From $16k all the way to $80k. Throughout history, multiple waves of panic have ultimately been followed by rebounds. Will the market prove the bears wrong again this time? Looking back at BTC’s weekly trend, from around $16k in 2023 to the later $25k, $50k, and $80k areas, whenever the market experienced a clear correction, some people assumed the rally was completely over. But as the chart shows, the declines that were repeatedly labeled as the end of the bull marke
post-image
BTC-3.04%
ETH-5.42%
  • 1
October 15, evening Bitcoin strategy:
Bitcoin suffered a sharp sell-off in tandem with the plunge in Japanese and South Korean stocks in the morning, triggering an avalanche
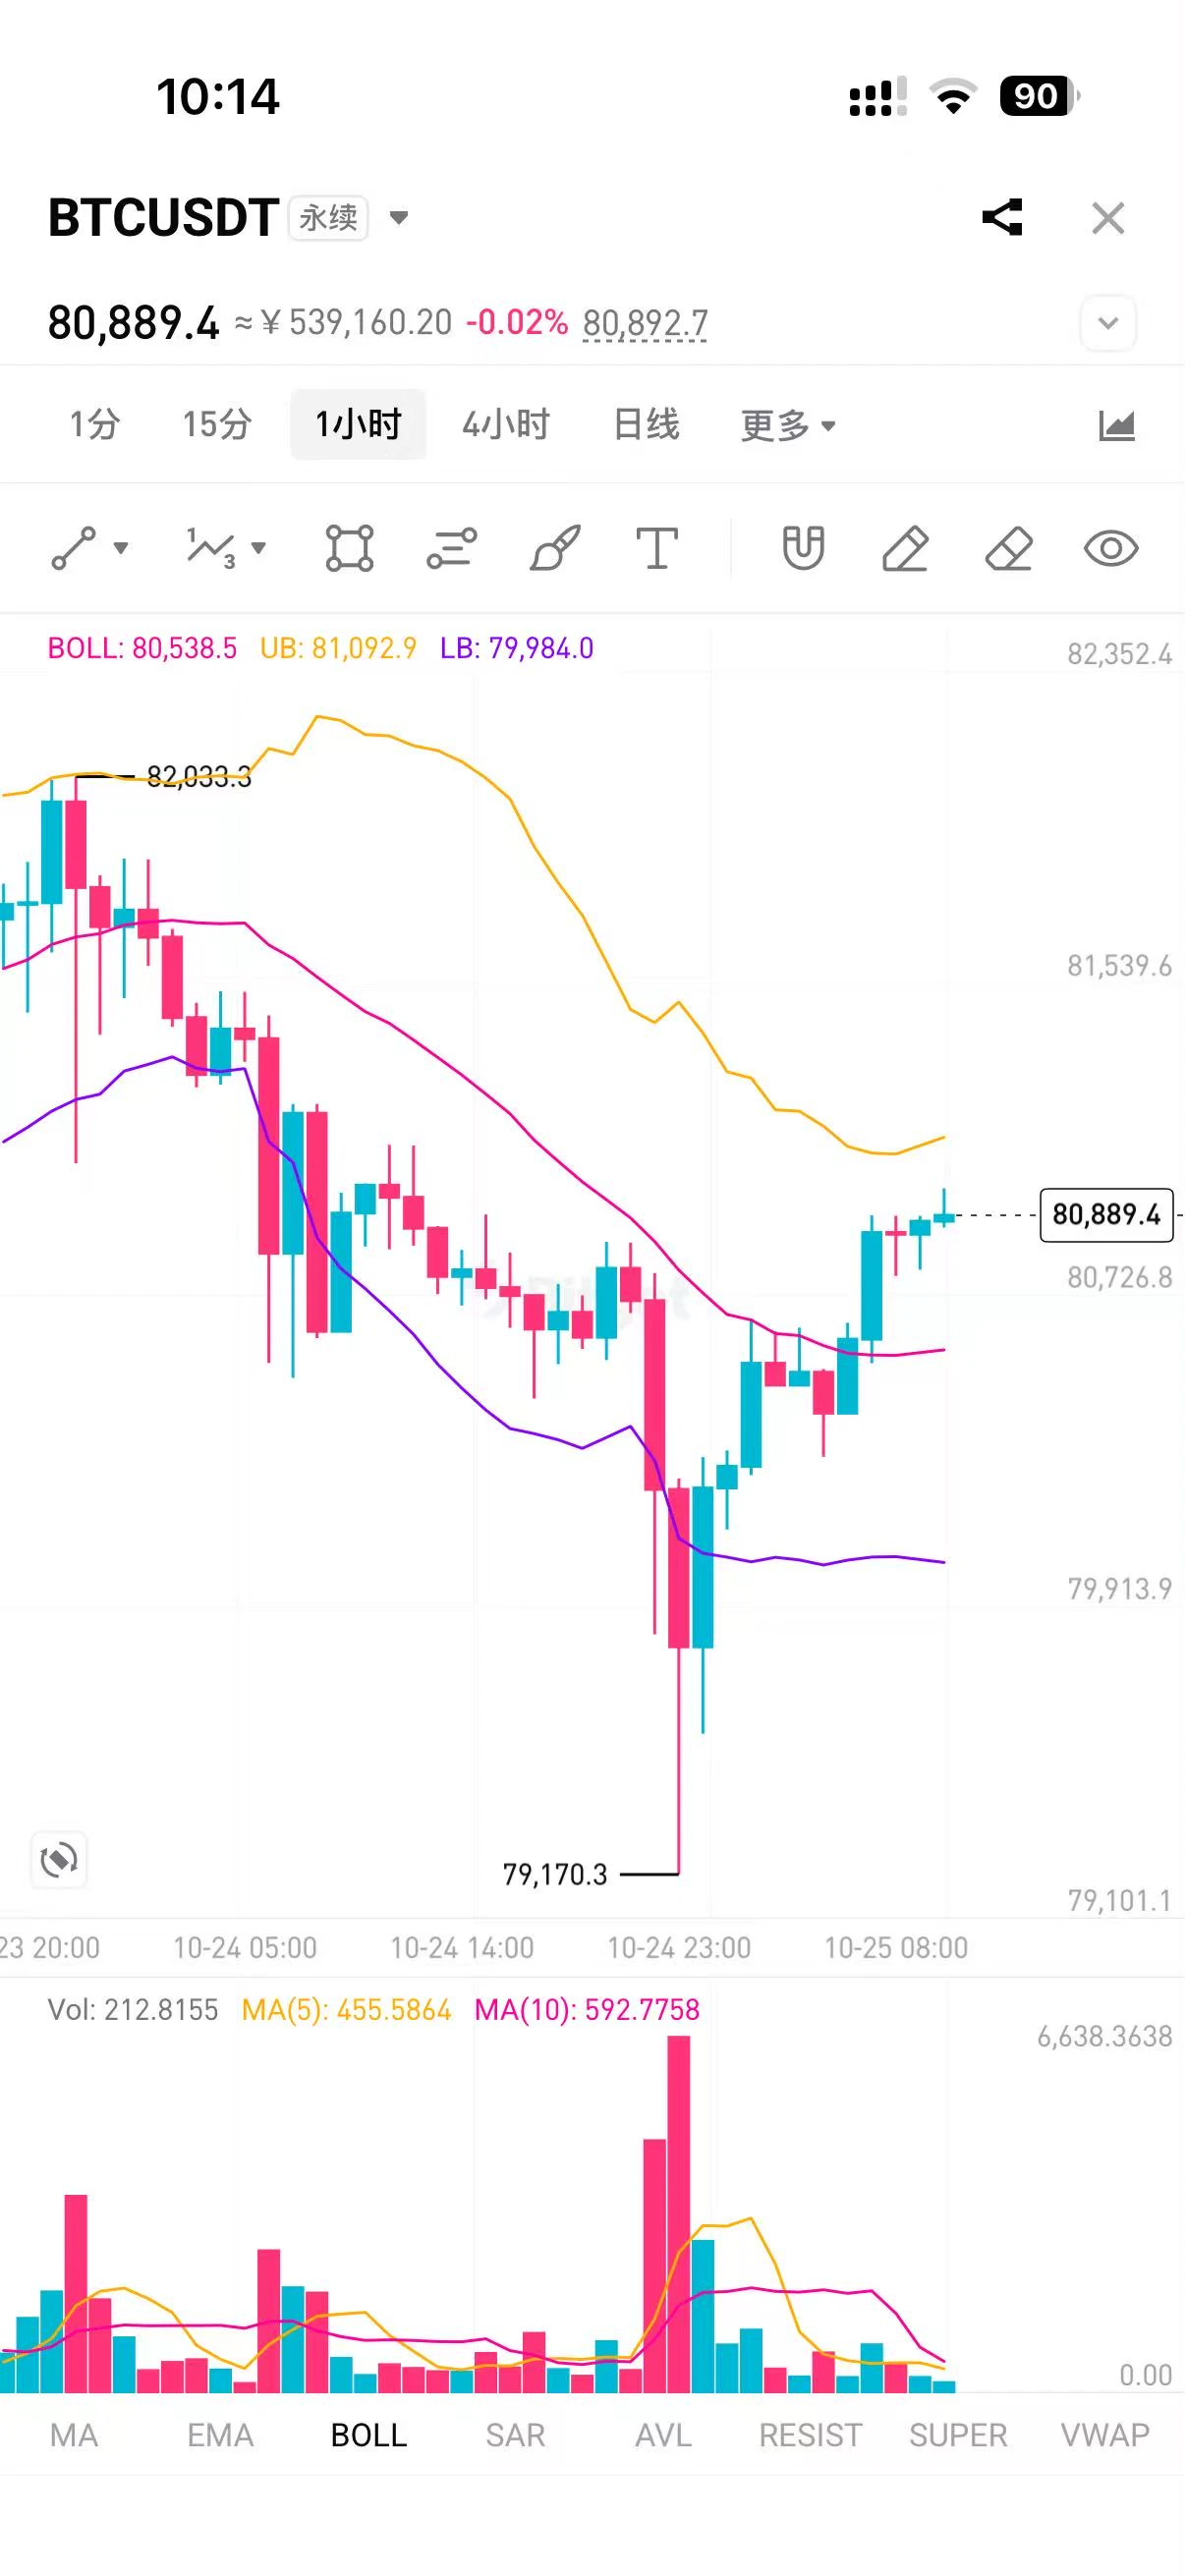
It came within one step of the 80k Bitcoin floor, reaching 80124
CPI + rising rate-hike expectations + geopolitical factors + a circuit breaker in South Korean stocks
After the major bearish news, Bitcoin began the battle to defend 80k
For Bitcoin to stabilize, it must hold above 82180,
Otherwise, it will start with 7
Key right-side levels tonight: 81559——80849
Evening trading suggestions:
79800
post-image
BTC-2.96%
Trend: The long-term bullish trend remains intact, but there is a deep medium-term correction and extreme short-term oversold weakness. It has retraced -40% from the 6/22 high of $2,354, plunged -17% in 5 days, and is technically oversold (KDJ J value -1.98, RSI 32.3). A rebound is needed, but the trend has not reversed.
1.Cycle peak risk: The memory industry fears "buying at the top of the cycle" most. Earnings are accelerating quarter over quarter but may be nearing a turning point; if the 10/29 earnings report guidance weakens, the valuation (PE19) will instantly become expensive.
2.Earning
post-image
$C98 C98USDT Medium-term Bullish potential!
The price is moving within a descending channel on the 1-hour timeframe. It has reached the lower boundary and appears to be preparing for a rebound; a retest of this boundary is expected, which should support an upward move.
The Relative Strength Index (RSI) indicates a bearish trend, but given the "oversold" condition on the 1-hour timeframe, there is a high probability of an upward breakout from this downtrend.
An orange trend line is present, providing support for an upward rebound.
There is an initial support level at 0.01424, which acts as a pr
post-image
C98-7.84%
Your $DOGE account will bleed out if you chase every single 24 hour wick. Selling the low at 0.0777 or longing the top at 0.08499 without a plan is how a -5.318 percent daily slide turns into a total account wipeout at current 0.0803 levels. Stay frosty and guard that stack. Not financial advice, DYOR. 🧠 Master your mindset. ⏳ Patience beats panic. 📉 Accept small losses. $DOGE #GateIdleEarnAutoYieldUpTo3% #GateLaunchesTrenchesWith0GasFee #ShareWeekly #WeekendMarketBullishOrBearish
post-image
DOGE-4.81%
The new crypto bull/bear market indicator is literally @cz_ 😂
post-image
$AZERO AT ANY MONENT!
post-image
Would you still dare to hold gold at $4,150?
CPI blew out, the probability of a rate hike surged to 50%, and gold bounced back to 4,150 from 4,073—but it failed to break through 4,170 three times. Is this the final chance to escape, or the last shakeout before getting on board?
First, the surface picture: range-bound and weak, but someone is holding the line.
The current price is 4,150. Yesterday, it plunged to a low of 4,073 before rebounding today. Over the past 24 hours, it has been grinding back and forth between 4,140 and 4,160. Think gold is stable? Wrong. Once the CPI data came out, the
post-image
BTC-3.04%
ETH-5.42%
XAU+1.19%
Load More

Join 40 M users in our growing community

⚡️ Join 40 M users in the crypto craze discussion

💬 Engage with your favorite top creators

👍 See what interests you

Trending Topics

USSeptemberPPIBeatsExpectations

91.35k Views1.83k Discussing

US September PPI came in at 6.3% YoY, well above the 5.3% market expectation, pointing to renewed producer-side inflation pressure. Weekly jobless claims were 199K, broadly in line with forecasts. Could hotter inflation further reduce room for rate cuts, and what does it mean for $BTC, US stocks, and gold?

DrLinHanSpeaksAtOxfordUnion

135.63k Views1.86k Discussing

JapanAndKoreaStocksPlunge

47.27k Views1.75k Discussing

View More