Share your thoughts
placeholder
Article
$AKE Signal】1H band-hugging volume expansion; buy the pullback in the long setup
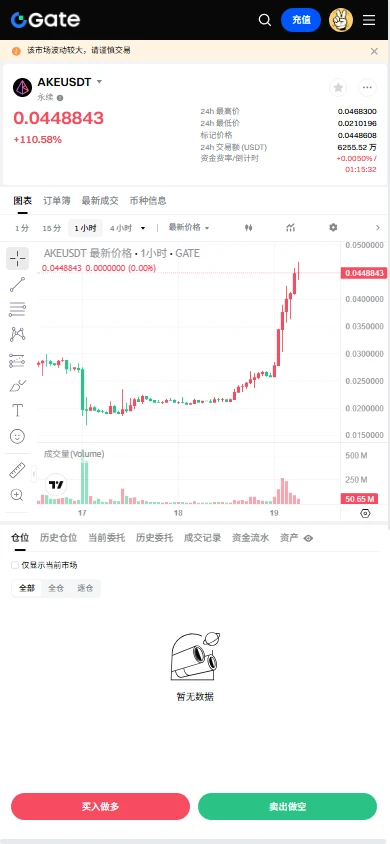
$AKE 1H RSI 94.03, with the price hugging the 1H Bollinger upper band at 0.0450, while the 4H MACD red histogram continues expanding. The order book bid/ask ratio is 0.89, with sell orders slightly heavier, the funding rate is 0.0050%, and OI is stable. The 0.04467358 - 0.04480800 range is absorbing bids, and the short-term bullish structure remains intact.
🎯Direction: Long
⚡Entry/Limit Order: 0.04467358 - 0.04480800
🛑Stop-loss: 0.04256760
🚀Target 1: 0.04816860
🚀Target 2: 0.04984890
🛡️Trade Management:
- Ex
post-image
AKE+113.83%
BTC+5.85%
ETH+6.73%
SOL+11.15%
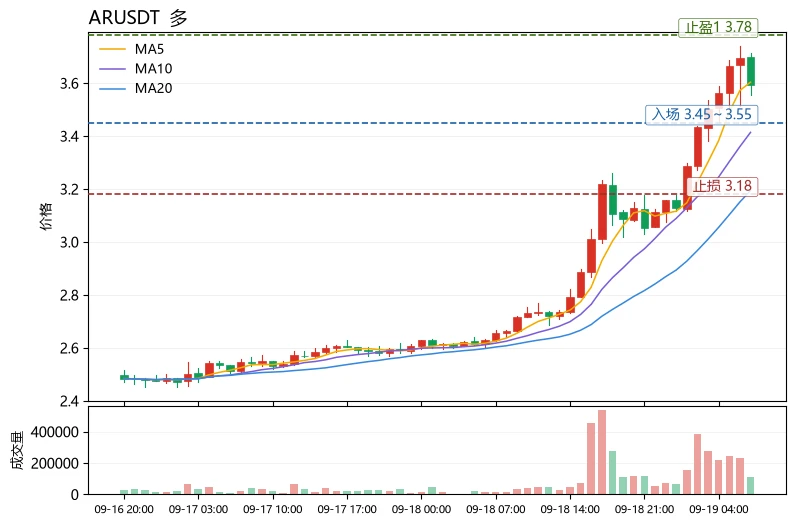
$AR Current price 3.592, up 35.45% over 24h, with a trading volume of 12.1M USDT. First, the data: MA5=3.6038 has crossed above MA20=3.19405, forming a bullish moving-average alignment; the MACD histogram at +0.04287 remains bullish; however, RSI=75.8 has entered the overbought zone, the price is near the upper Bollinger Band at 3.7789, and the funding rate of +0.0100% indicates that longs are slightly crowded.
Assessment: The trend is healthy, but the short-term market is overheated. A reusable chart-reading method is “use moving averages to determine direction and RSI to determine timing”—a
post-image
STRK+52.57%
Happy Halloween 🎃
$BTC
post-image
BTC+5.85%
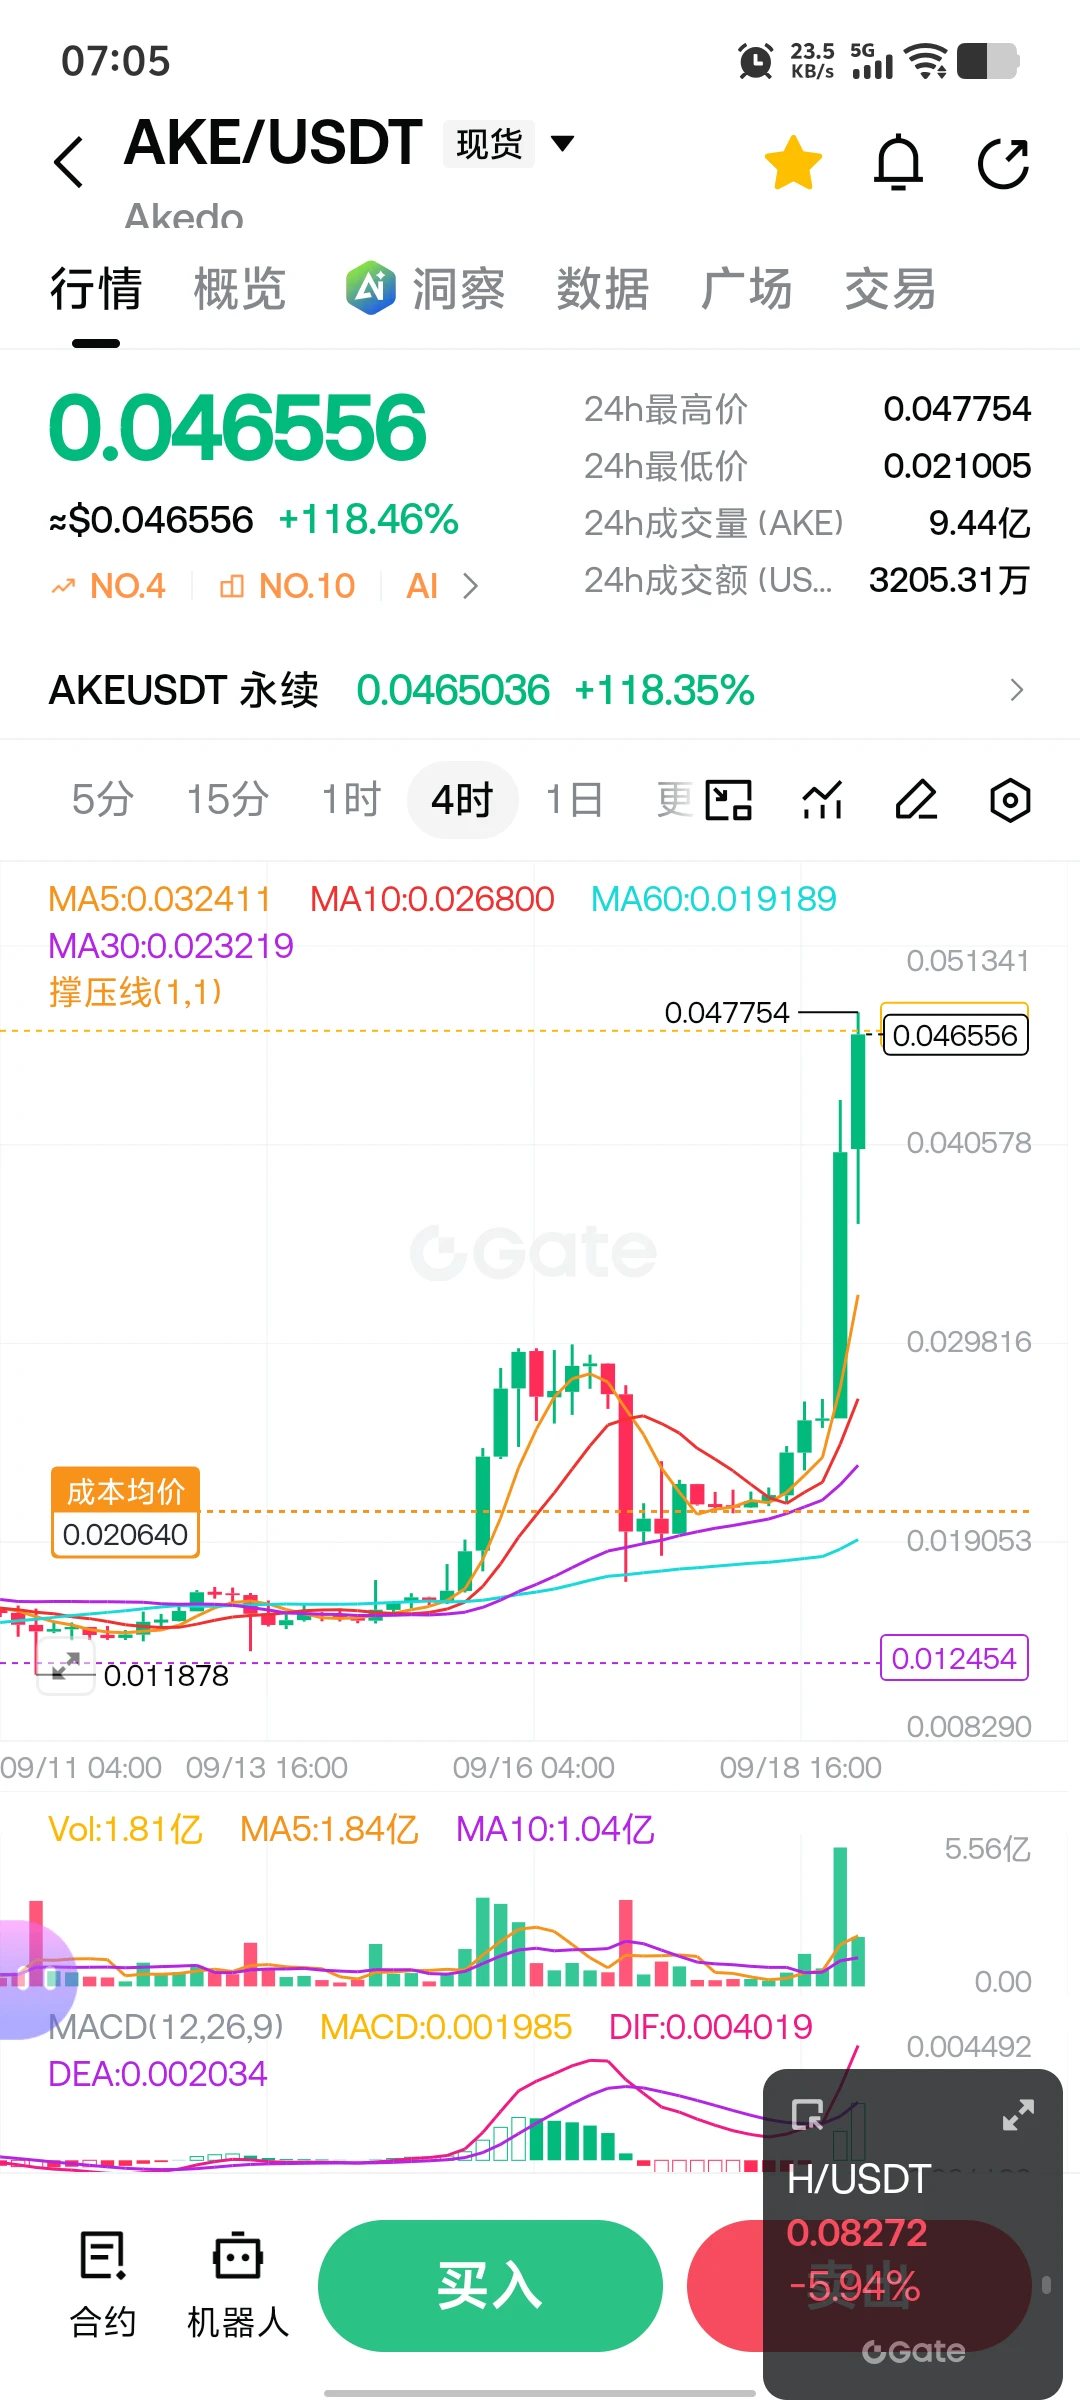
# AKE spot position entered at 0.02, exited at 0.047 after doubling
post-image
AKE+113.80%
Everyone is calling BNB a breakout, but the 4h data says otherwise.

$BNB /USDT - SHORT

Trade Plan:
Entry: 761.5 – 763.9
SL: 778.3
TP1: 751.0
TP2: 743.2
TP3: 731.6

Why this setup?
Why now? The daily trend remains bullish, yet the 1h price is sitting at 762.7 with a 15m RSI of 53.37, showing neutral momentum beneath the highs. The 1h ATR of 4.987971 tells us volatility is compressed enough for a sharp move, while the entry zone between 761.5 and 763.9 aligns perfectly with this resistance. We are targeting TP1 at 751.0 and TP2 at 743.2 on a short bias, with the invalidation level at 734.3
BNB+3.35%
South Korean stocks rebound strongly! KOSPI opens up 2.54, with SK Hynix and Samsung leading the gai
live-cover
LIVE46
Financial News, Crypto Market Updates, Real-World Strategies
live-cover
LIVE57
RAY, up 172.89% over 30 days, is up another 21.83% today: volume ratio 2.223, with no signs of fatigue
Wow, $RAY up 172.89% over 30 days, and up another 21.828% today, currently at 1.7754. The direction is clear: bullish intraday; buy dips, don’t chase highs.

The volume is real—full-day trading volume was 16.427 million USDT, 2.223 times the 30-day average, with a funding rate of 0.0 and no leverage in play.

Technicals are not overheated—daily RSI is 64.9 and not overbought, MACD has formed a bullish crossover above zero, and MA7 has been pressing MA30 for the 28th day.

The broader mark
RAY+19.22%
#ZECKeepsRisingBreaking1500
ZEC JUST ENTERED A DIFFERENT LEAGUE — BUT THE REAL QUESTION IS WHAT HAPPENS AFTER $1,500?
Zcash has gone from being an overlooked privacy asset to one of the most explosive large-cap crypto stories of September.
ZEC has pushed through the $1,500 area after a vertical move that has taken the token from roughly $500 in mid-August to above $1,500 — a gain of around 200% in just one month.
And this is not simply a momentum chart.
There are several fundamental and market-structure catalysts behind the move.
First, Zcash is approaching a major network upgrade. The upcomi
ZEC+6.69%
  • 1
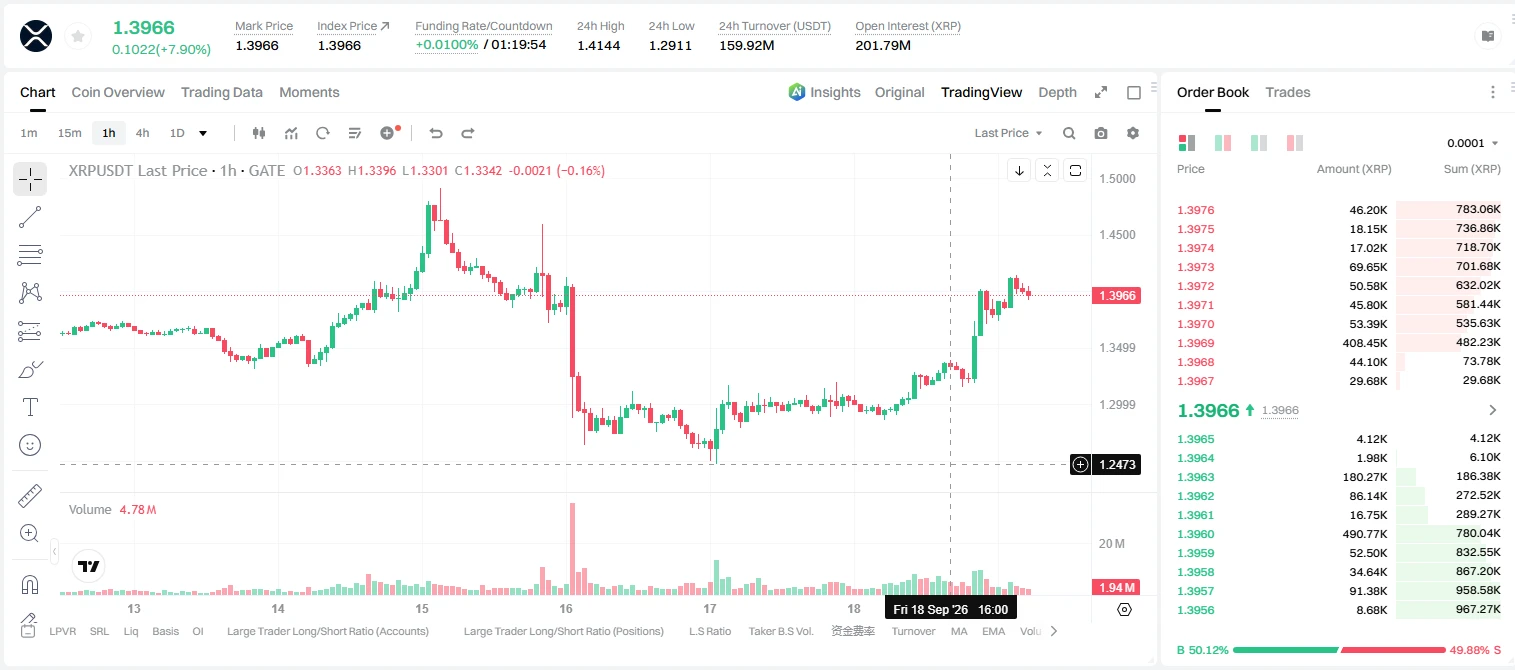
XRP is range-bound but the 1h ATR screams move is coming.

$XRP /USDT - SHORT

Trade Plan:
Entry: 1.3913 – 1.3997
SL: 1.4481
TP1: 1.3561
TP2: 1.3298
TP3: 1.2903

Why this setup?
Why now? The 1d trend is range and the 1h price is sitting at 1.3955, so any breakout will likely be violent. The 15m RSI at 56.84 shows momentum is neutral, not overbought, which means a short setup has room to breathe. The 1h ATR of 0.016855 confirms that a move of roughly 1.7% is normal within an hour, making the entry zone between 1.3913 and 1.3997 a precise place to sell. The first target is 1.3561, the second
post-image
XRP+7.75%
$AKE broke to a new high, yet there was no short squeeze or rapid surge with a long upper wick, showing that retail traders have gotten smarter—the liquidation price wasn’t at 0.04. Such smart retail traders.
post-image
AKE+113.80%
The CORE community is in uproar: some are All in for a 10,000-fold return, while others expect it to go to zero. Setting FOMO aside, an objective review of BTCFi’s make-or-break path

⚠️This article reviews only the fundamentals of the sector and project and does not constitute any investment advice

Open the CORE community, and the views are polarized to the extreme.
Bulls loudly proclaim that BTCFi is the biggest narrative of this bull market, relying on Bitcoin’s computing power and institutional entry expectations for lstBTC to go All in, convinced that a 10,000-fold return is within rea
post-image
CORE+8.11%
BTC+5.85%
STX+12.50%
MERL+9.14%
BABY+7.52%
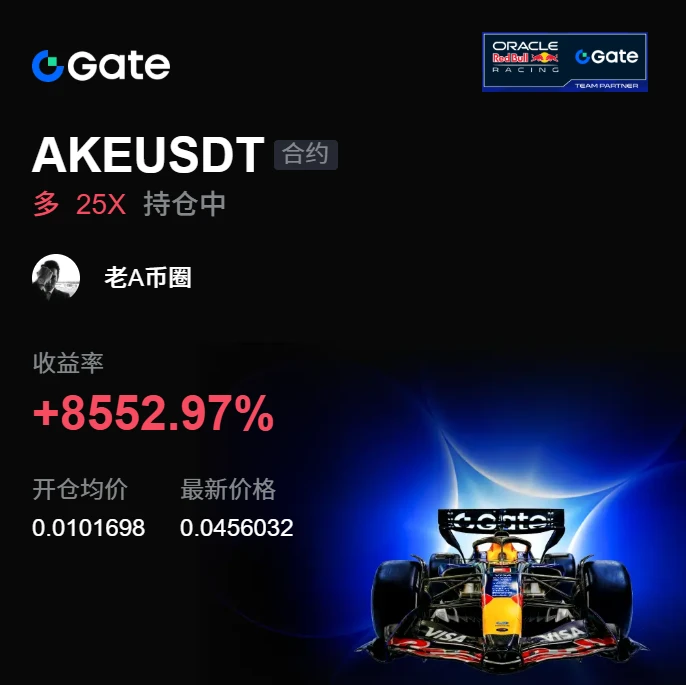
Some trades are just like this: the more you watch them, the less they move; the moment you turn away, they take off. As the price bottomed out intraday, $AKE funds quietly entered. The key level held, so I signaled opening longs and adding to the position in batches. From 0.0101698 to 0.0456435, +8550.8%—what a takeoff. That was a satisfying bite, and the wait was worth it.
I’d rather miss part of a rally than catch a falling knife and end up covered in blood.
Take 80% in profits first, protect the remaining 20% at the entry price, and let the profits run if it keeps surging.
Now is not the
post-image
AKE+113.83%
LAB+0.61%
DOGE+7.22%
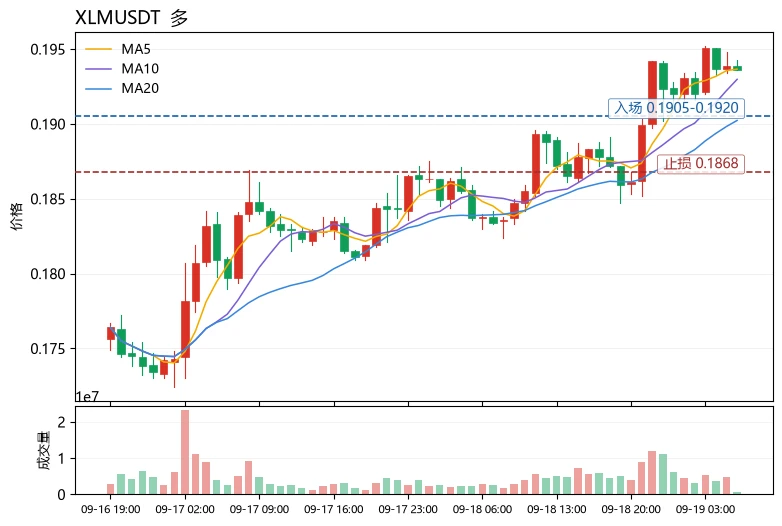
Fear & Greed Index 56, BTC stabilizes and rebounds. Is this bullish candle $XLM a catch-up rally or a genuine breakout? My answer: lean bullish, but only buy pullbacks and do not chase highs.
The broader market sentiment has recovered from fear to the greed range (56). The funding rate of +0.0100% shows that bulls have a slight edge but are not overheated. Sector rotation is evident—ETH leads with a 7.54% gain, driving a recovery among major coins, while XLM follows with a 5.39% gain and a trading volume of 24.0M USDT, representing moderate volume expansion and indicating passive capital infl
post-image
XLM+4.90%
ETH+6.73%
SYN+16.53%
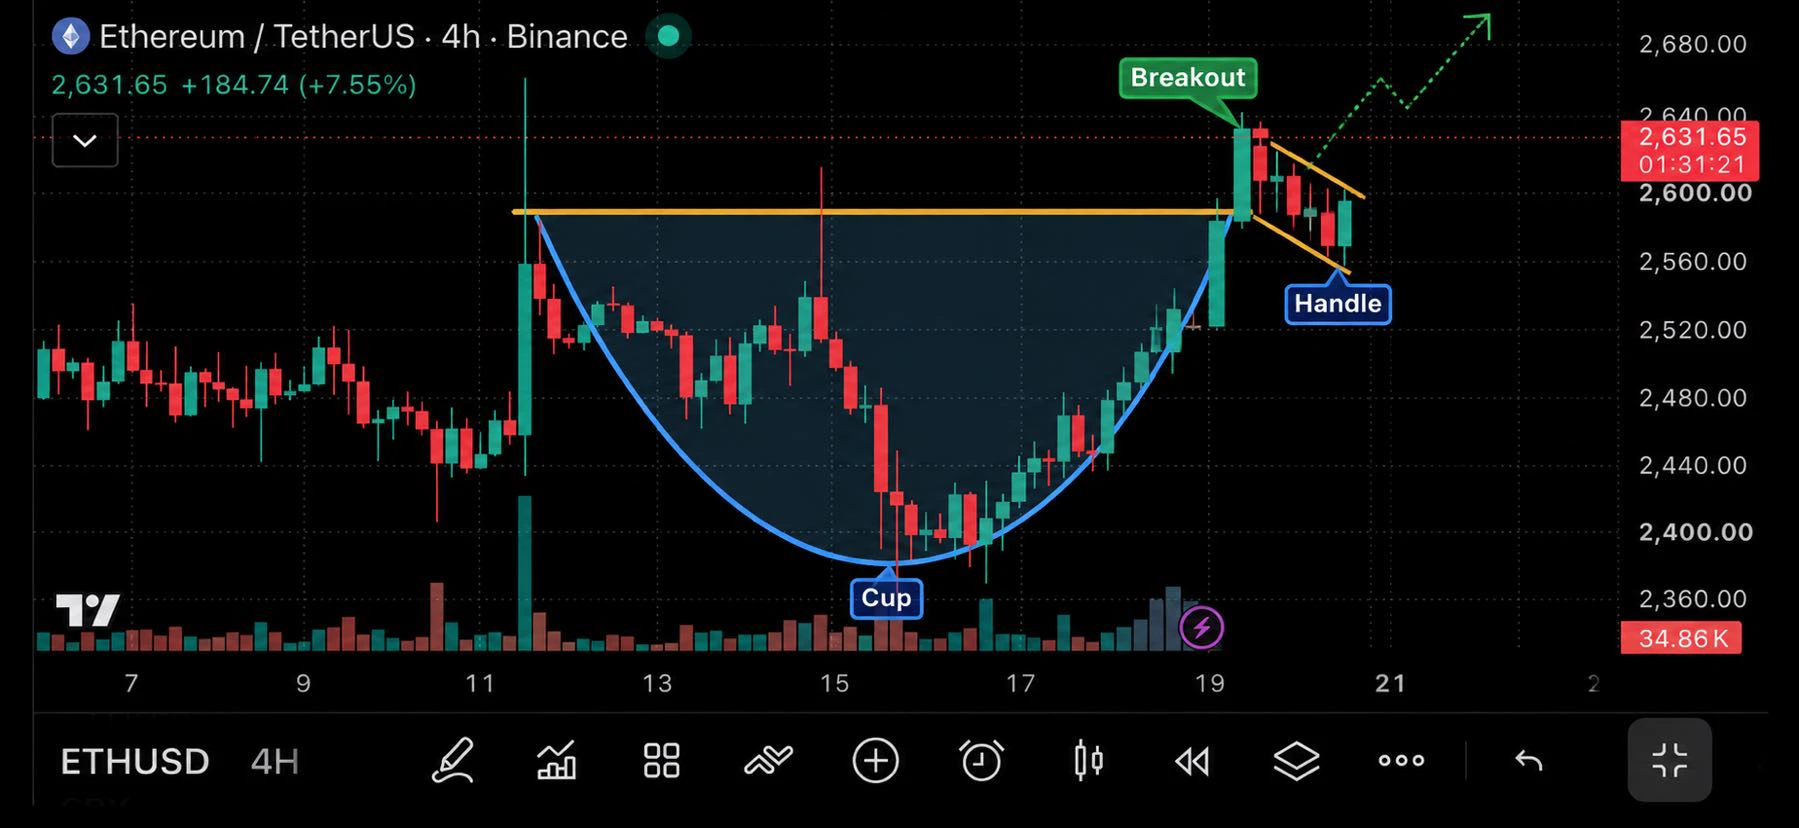
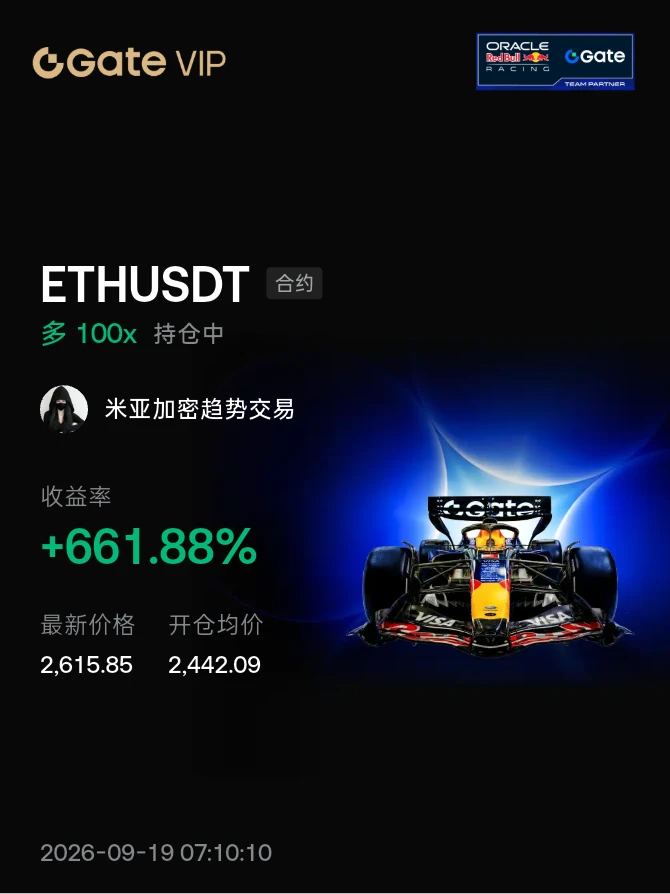
$ETH ‌ is showing a clean 4H cup-and-handle structure. 👀
The breakout above the ~$2,590 neckline is holding, while the current pullback is forming a tight handle instead of fully retracing.
A break above $2,635–$2,640 could open the path toward $2,680+. If ETH loses $2,560, the setup starts to weaken.
Bullish 🟢 while the breakout zone holds.
#Ethereum #ETH #Crypto #ETHAnalysis #GateSquareMidAutumnReunion
post-image
ETH+6.73%
  • 7
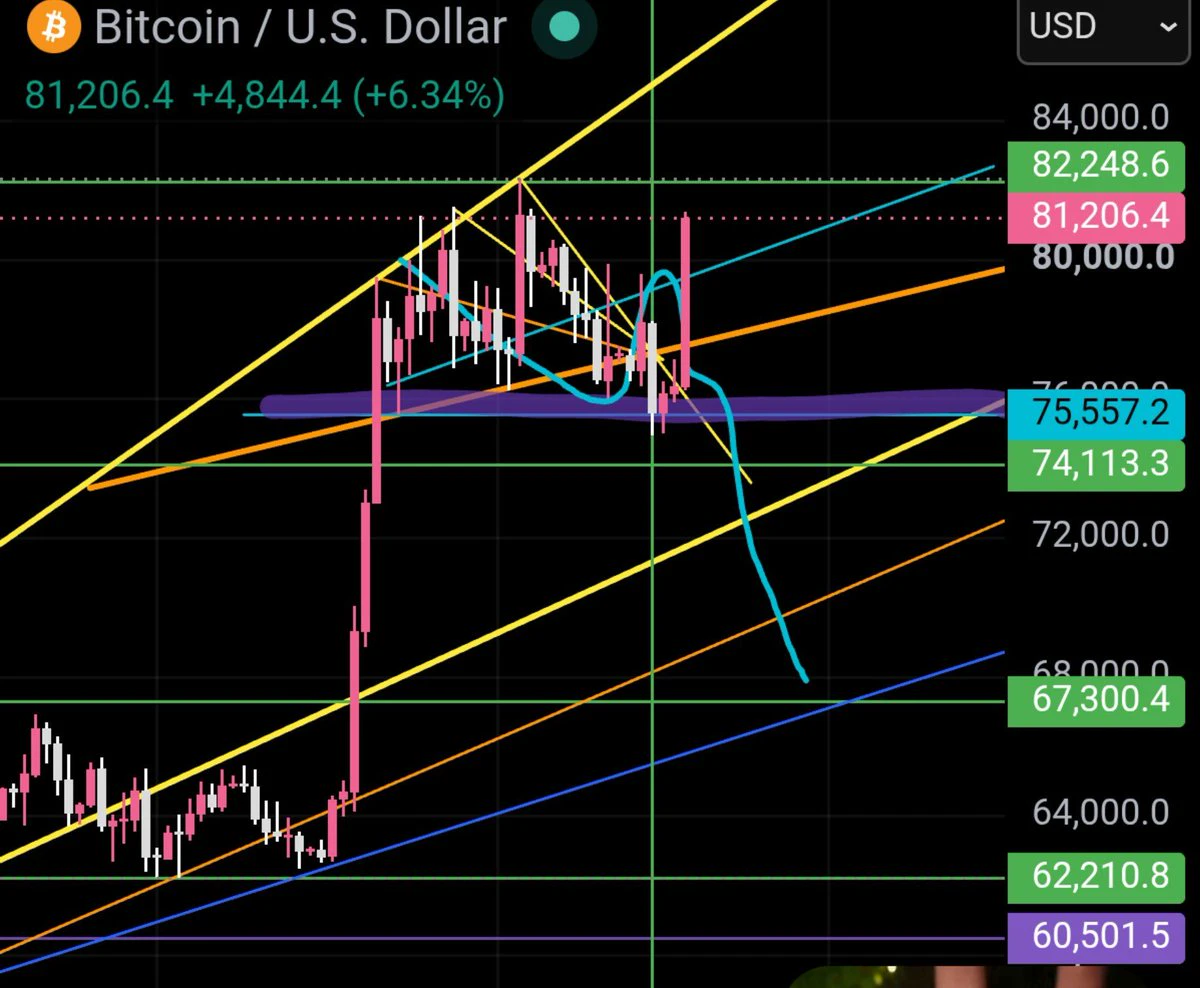
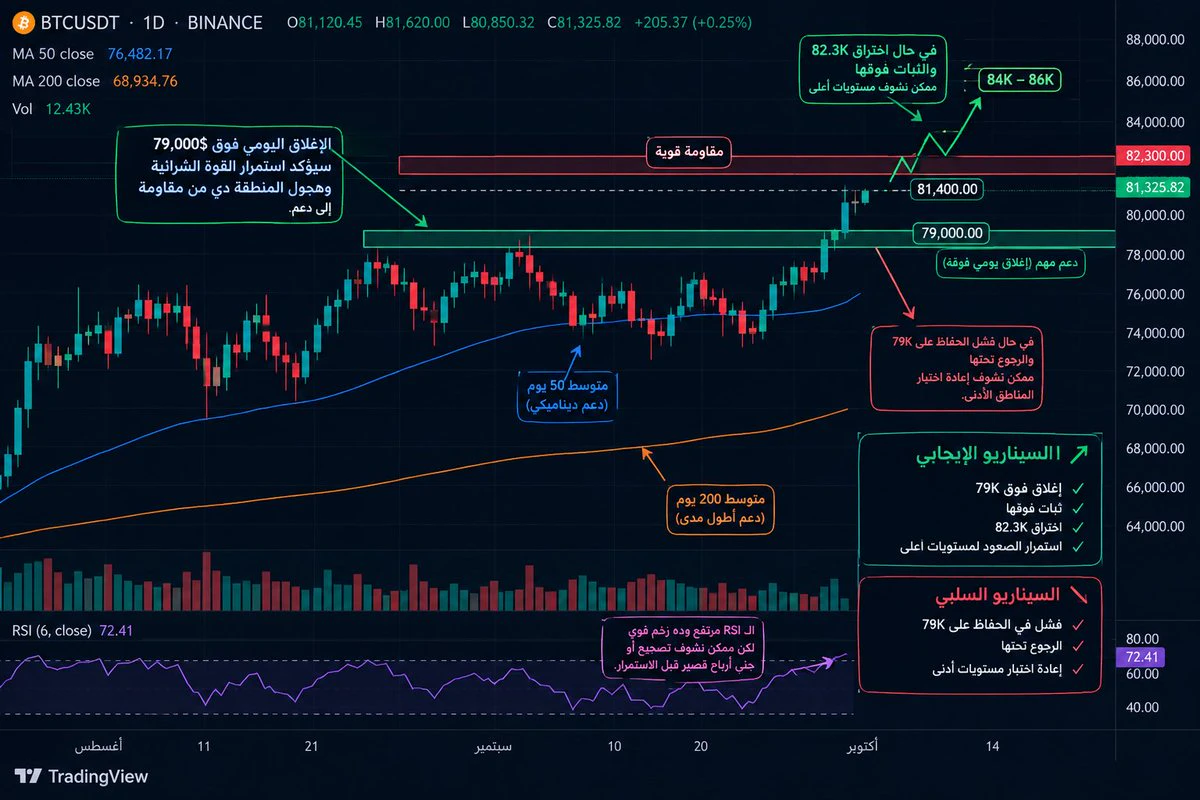
Closing $BTC above $79,000 could completely change the look of the move! 🚀📈
Take a look 👀👇
If Bitcoin manages to make a steady daily close above $79,000, that would be an important sign that buyers are still in control and that the $79K area is starting to turn from resistance into support.
🔥 What should we watch after the close?
🔹 $79,000 → the most important level right now, and holding above it is bullish.
🔹 $81,400 → the first area the price needs to hold above while continuing its buying pressure.
🔹 $82,300 → strong resistance, and a clear breakout close could open the way to high
post-image
BTC+5.85%
🔥A Major Overnight Shift! BTC/ETH, Gold and Silver, and MSTR Rally Together—Are the Big Four Tech Giants Losing Their Appeal?
The market sentiment shifted overnight📈BTC and ETH surged strongly, gold and silver gained momentum in tandem, and assets like MSTR and SanDisk also posted sharp gains.
Meanwhile, the picture reversed, with Apple, Microsoft, Tesla, and Meta all weakening.
Capital is fleeing high-flying tech giants and flowing into crypto, precious metals, and the storage sector for defensive positioning and upside.
This round is not a minor rebound, but a signal of rotation across maj
BTC+5.85%
ETH+6.73%
MSTR+16.35%
GLDX+0.77%
PAXG+0.62%
$2,550 is the gateway Ethereum must pass.
On September 18, Ethereum’s price recovered to around $2,500, with buyers holding support around $2,400. However, both the daily and 4-hour charts show that $2,550 is the main barrier to a larger breakout, with the target after the breakout pointing to $2,800.
The key point of this rebound is not the size of the gains, but the structure: the lows are rising and support has been repeatedly confirmed, indicating that selling pressure is gradually being absorbed. As long as $2,400 holds, the bulls still have the opportunity to keep testing $2,550.
Everyon
post-image
ETH+6.73%
#晒出我的持仓收益 After this run is over, it will take another break.
post-image
$AKE It's hard to put into words; you could say I made money too.
post-image
AKE+113.80%
Load More

Join 40 M users in our growing community

⚡️ Join 40 M users in the crypto craze discussion

💬 Engage with your favorite top creators

👍 See what interests you

Trending Topics

JapanRealEstatePowerChipStocksRise

58.75k Views3.64k Discussing

Japan's Nikkei extended gains on Sept 18, with real estate, power, and semiconductor sectors leading. Gate covers over 12,800 global stocks and ETFs, offering one-stop USDT trading across US, HK, Korean, and Japanese markets. [👉 Read more](https://www.odaily.news/en/newsflash/518749)

USAIConceptStocksRally

33.58k Views557 Discussing

GateTopsStockPerpetualCoverage

37.68k Views2.34k Discussing

View More