Square
Following
Hot
News
Notifications
Profile
Share your thoughts
placeholder
Article
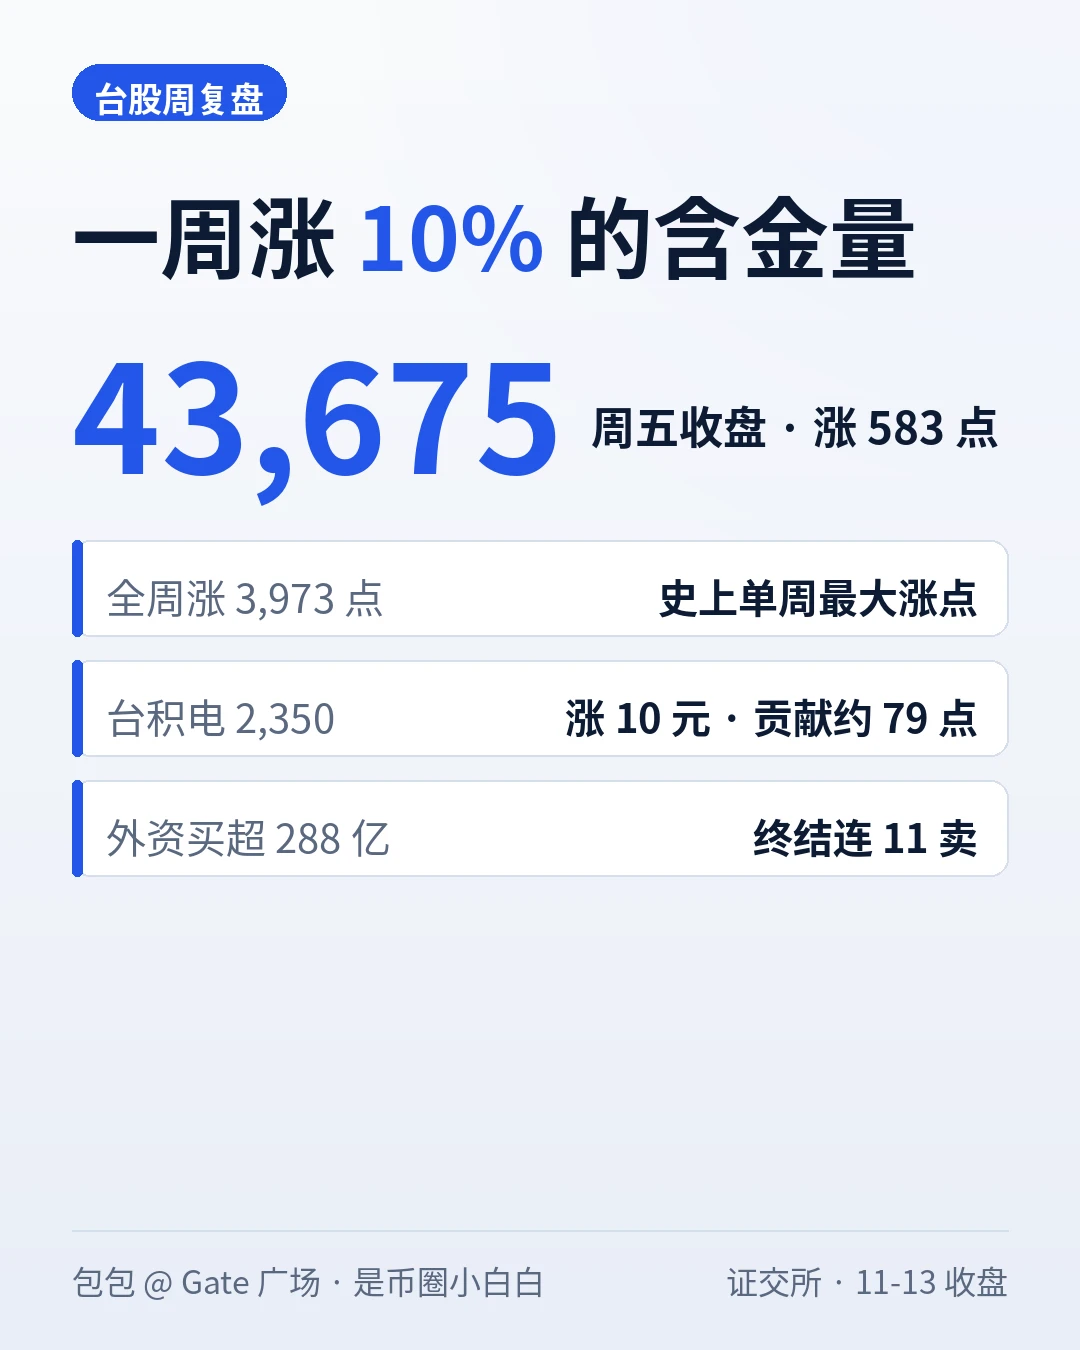
43,675 at the close, up 583 points Friday, and surging 3,973 points for the week (+10.01%): Taiwan stocks posted their biggest weekly point gain in history this week—they’ve truly recovered. #Gate上线台股交易

First, the numbers: Last Friday (11-06), Taiwan stocks briefly fell to 37,837 intraday, the largest intraday point drop in history; this Friday, they closed at 43,675, up 3,973 points for the week and ending a four-week losing streak. On Thursday, they had just fallen 1,165 points to close at 43,091.87. On Friday, they briefly surged to 44,489 intraday before pulling back 814 points; they cou
post-image
NVDA-1.92%
On a cool afternoon, I’d just taken a sip of lukewarm instant coffee and casually checked the latest fund flows. Good grief—the red and green figures nearly made me set my cup down crooked. Stop imagining a reversal from the candlestick chart; the big money’s true stance is all there in the numbers.
First, look at the short 1-to-2-hour window: spot and futures are both flashing green. $BTC futures saw net inflows of over 60 million, and $ETH spot saw inflows of over 90 million. At first glance, you might think the bull market is back and the dip buyers have stormed in, right? Don’t get excit
post-image
BTC-0.67%
ETH-1.26%
Trenches
mihao
m
bade
b
mihao
4Cxj...pump
Market Cap
$.
Change
.
24h Vol
$.
Holders
.
IDOL
I
bade
b
IDOL
0x3b...ab07
Market Cap
$.
Change
.
24h Vol
$.
Holders
.
FOOD
F
bade
b
FOOD
FTu5...pump
Market Cap
$.
Change
.
24h Vol
$.
Holders
.
Sakura
S
bade
b
Sakura
9sFG...pump
Market Cap
$.
Change
.
24h Vol
$.
Holders
.
AGT
A
bade
b
AGT
0x5d...e274
Market Cap
$.
Change
.
24h Vol
$.
Holders
.
Bitcoin’s $69k defense battle has begun! Three price levels will determine whether bulls can turn things around

Bitcoin now looks like soldiers defending a city, facing three key lines, each of which could shape the market’s next move.
The first is around $67,900, where the 200-week moving average sits. If the price holds, a short-term rebound remains possible.
The second is $63,000–$66,000. If the first line of defense breaks, this range could become a key area for the next bull-bear battle.
The third is around $57,000–$59,000. This is a level to watch in a deeper correction scenario, not a
BTC-0.67%
USIDX+0.00%
In BTC trading, many people see the price break through an important resistance level and immediately chase the rally, worried they’ll miss an opportunity to profit. But experienced traders often focus on another important signal after a breakout: the retest.

Why is a retest after a breakout worth paying attention to?

First, it helps verify whether the breakout is valid. After the original resistance level is broken, it may turn into new support. If the price pulls back to this area but does not break significantly below it, that may indicate the market is reconfirming this level’s role as s
BTC-0.67%
With this many people, I thought it was a buy-one-get-one-free Häagen-Dazs deal.
Turns out it’s a Pokémon GO raid.
post-image
🐋 WHALE WATCH : Strategy holds 850,364 BTC at an average buy of $75456.
Unrealized loss: $6.85B.
Saylors entire position is built on one conviction: dont sell. At this scale thats either the trade of the decade or the most expensive patience test in corporate history.
Still holding ?
post-image
BTC-0.67%
Market update
live-cover
LIVE5,799
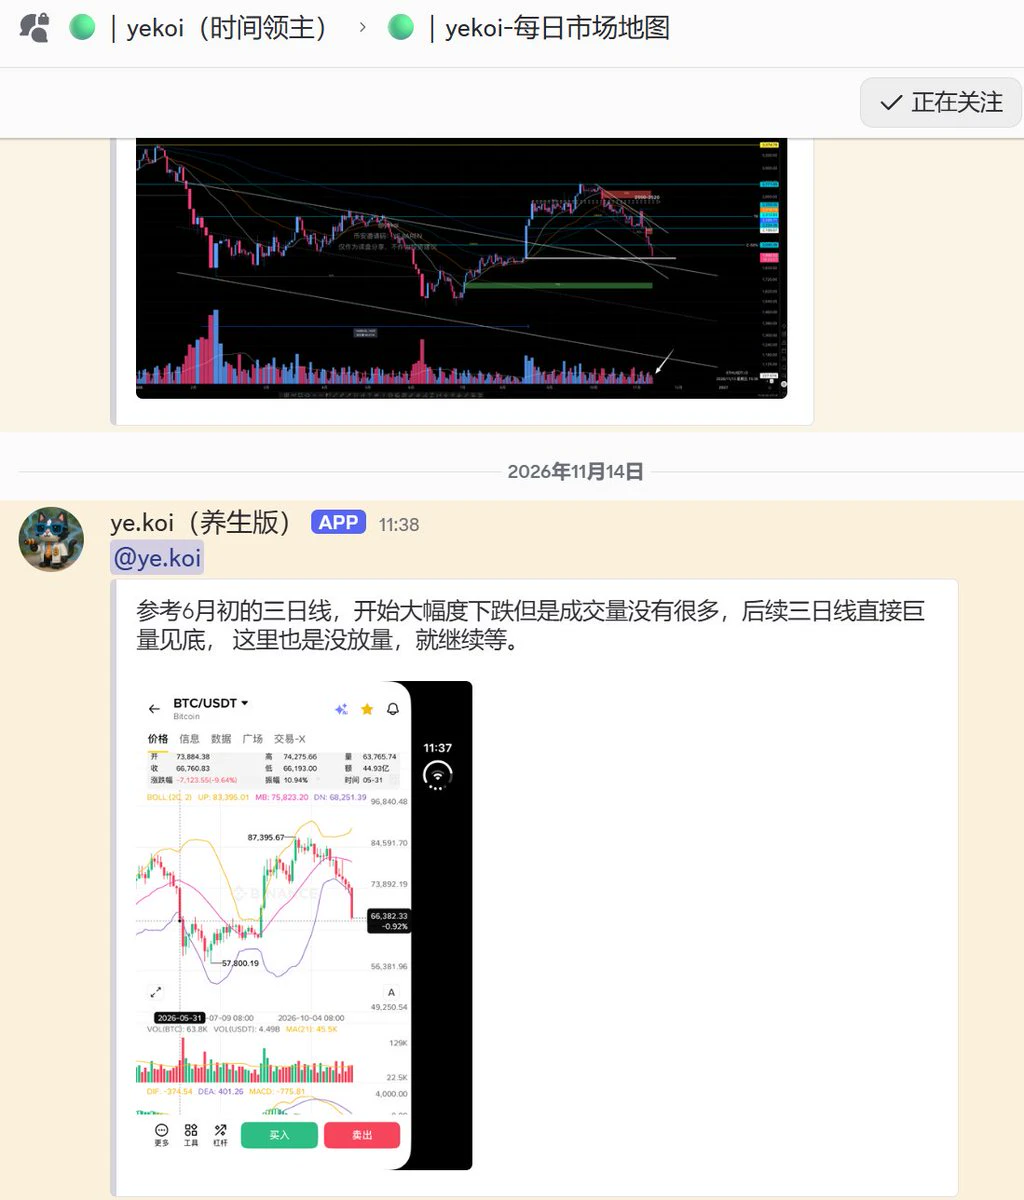
ye.koi: Looking at the 3-day chart from early June, it started dropping sharply, but volume wasn’t high. The following 3-day candle bottomed out on huge volume. There’s no volume spike here either, so keep waiting.
$BTC Current price: 67294; today’s high: 70217, low: 66449; down about 2.2% intraday.
67500 has been lost, weakening the short-term outlook. There’s been a small bounce off the low. First, watch whether it can hold 66400; if that breaks, it could fall toward 65,000. For spot, wait for it to stabilize before buying.
post-image
BTC-0.67%
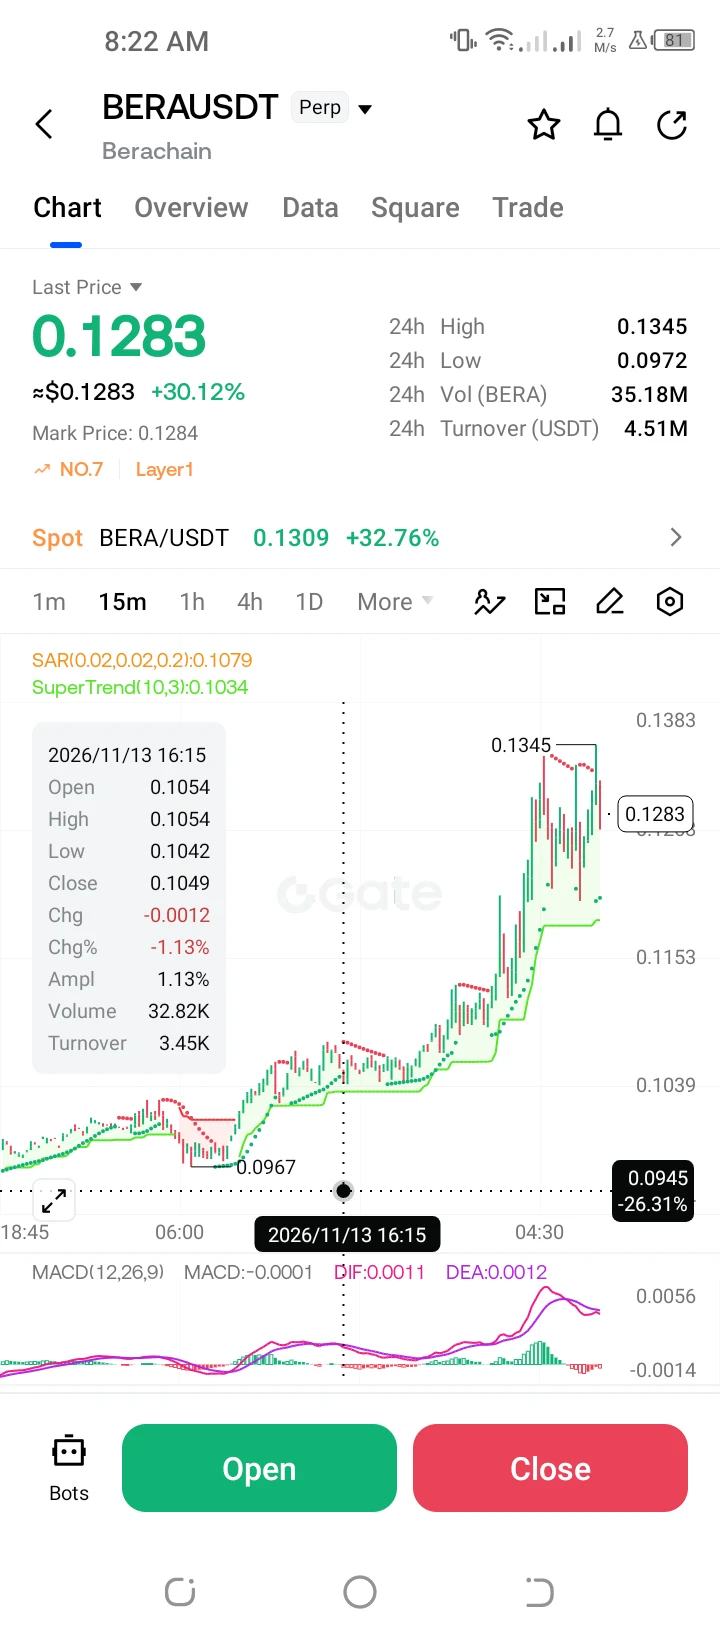
**$BERA /USDT Perp – "Strong Uptrend – Long"**
Trading Plan Long $BERA
Entry: 0.1283
SL: 0.1153
TP1: 0.1345
TP2: 0.1383
BERA is up +30.12% and trending strongly. MACD is elevated but bullish; targeting a continuation above the 0.1345 local high.
post-image
BERA-2.61%
MACD is a commonly used trend indicator in cryptocurrency trading, and many people treat a golden cross as a buy signal. But in actual trading, an MACD golden cross does not always mean the trend will rise, and may even be a buying trap.

This usually happens for several reasons:

First, during a downtrend. In a strong downtrend, prices may briefly rebound, and MACD may form a golden cross, but this is often just a corrective bounce and does not mean the trend has reversed.

Second, in a ranging market. When the market lacks a clear direction, MACD can frequently produce golden crosses and dea
post-image
#Analytics

#AKE Strong gains, but the price is overheated

AKE is trading at $0.01243 after rising 372.90% in 24 hours. On the four-hour chart, RSI 14 is 95.9 — extreme overbought territory. The assessment is mixed: the strength of the rally is clear, but the risk of a sharp correction is high. This RSI alone does not yet signal the start of a reversal.

The price is significantly above the EMA 20 ($0.00622784) and EMA 50 ($0.00556965), with the shorter average above the longer one. This supports a positive assessment of the trend, but the large gap from both averages underscores the overheat
post-image
AKE+6.07%
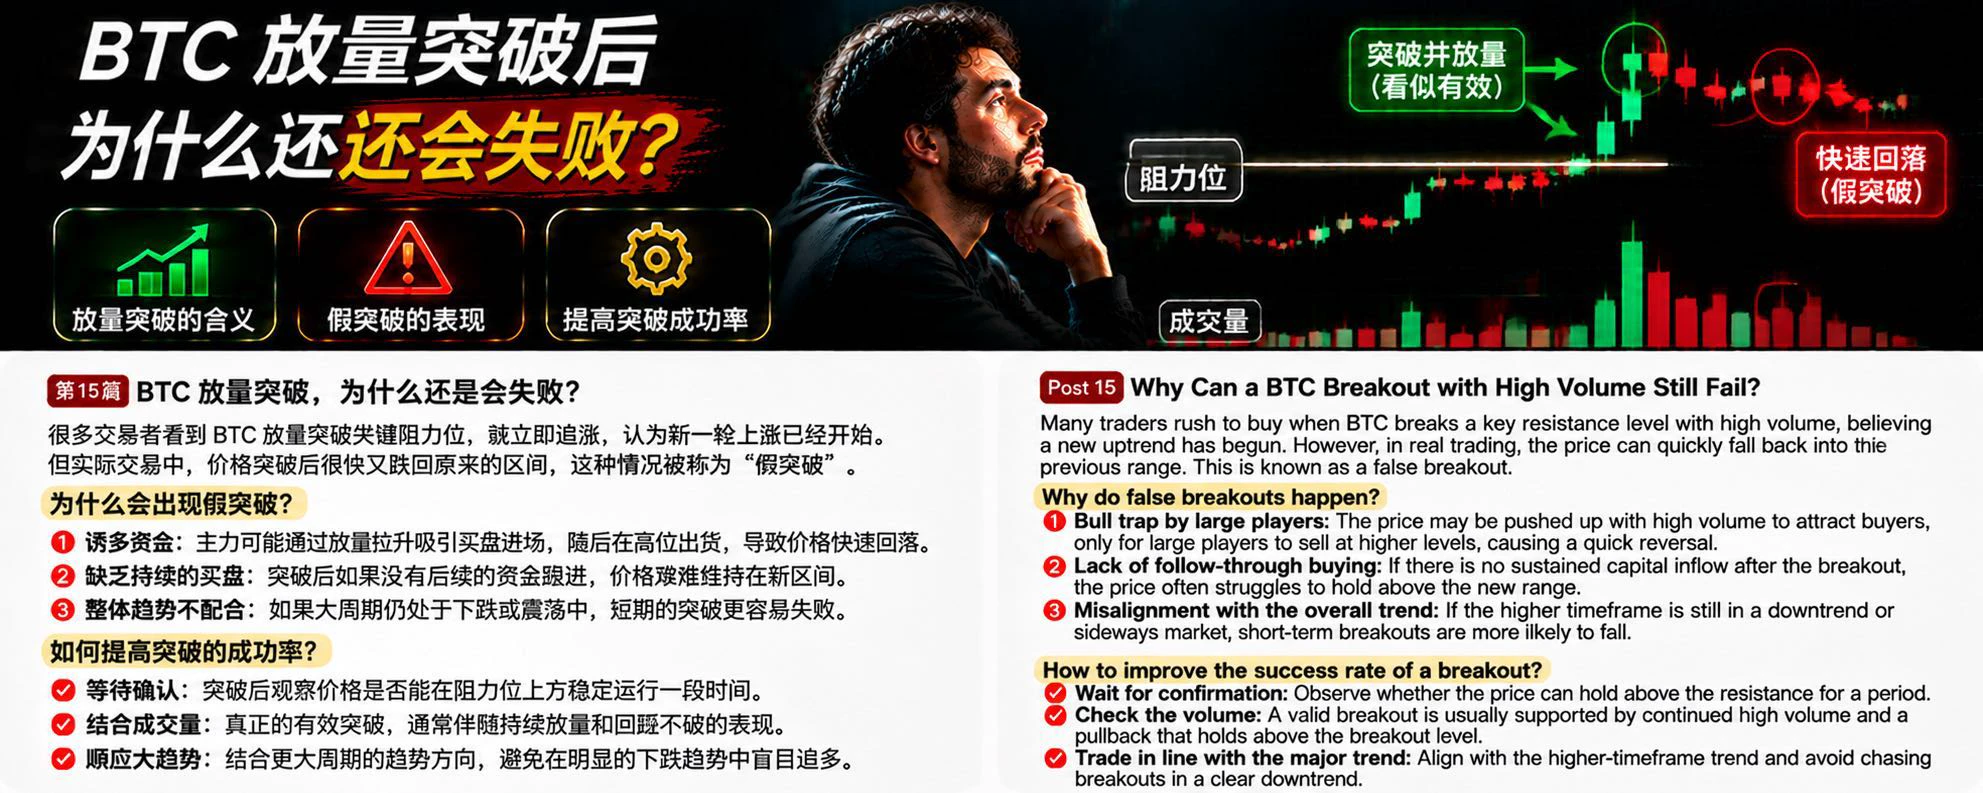
Many traders see BTC break through a key resistance level on high volume and immediately chase the rally, believing a new uptrend has begun. But sometimes, after breaking out, the price quickly falls back into its previous range, catching those who just entered off guard. This is commonly known as a false breakout.

Why can a high-volume breakout still fail?

First, buying lacks follow-through. A large amount of capital may enter at the moment of the breakout, but if no new buyers follow, it is difficult for the price to hold above resistance.

Second, there is significant selling pressure at
post-image
BTC-0.67%
In cryptocurrency futures trading, 10x leverage may not sound particularly high, but many traders underestimate the risks behind it.

Suppose you have 1000 USDT and use 10x leverage. This means you can open a notional position worth about 10000 USDT (though the exact amount also depends on the margin mode and trading fees).

If the market price moves 1% against you, your position will incur an unrealized loss of about 100 USDT, equivalent to 10% of your principal. If the price moves 5% against you, the theoretical unrealized loss could reach 500 USDT.

This does not include trading fees, fundi
post-image
People with high emotional intelligence have often been through a lot.
Cloud Computing Giants Secure More Energy To Expand AI Infrastructure
live-cover
LIVE1,141
Many people equate “a big drop” with “having bottomed,” and rush to buy the dip as soon as RSI nears 30—mistaking an oversold signal for a reversal signal. Oversold only means short-term selling pressure has been substantially released; it does not mean the trend has recovered. To assess whether the trend is healthy, look for the moving averages to first flatten out and then turn upward.

Take $FIL as an example: the current price is 0.6938, and MA5=0.69328 remains below MA20=0.715875, with the moving averages in a bearish alignment—a typical sign that the trend has not yet recovered. RSI=30.
post-image
FIL-1.99%
INJ-1.67%
BERA-2.60%
I have some good news to share with everyone!!
After years of hard work on X 💪,
I finally reached A1 level.
post-image
Is BTC suitable for dollar-cost averaging? Use time to invest at a more comfortable pace!

In the cryptocurrency market, many people hope to buy at the lowest point and sell at the highest. But in reality, even experienced investors find it difficult to accurately predict every market turn. Some make a lump-sum purchase and then face a sharp drawdown, while others keep waiting for a lower price and ultimately miss a long-term rally.

So, is BTC actually suitable for dollar-cost averaging?

First, it reduces the difficulty of timing the market. The key feature of dollar-cost averaging is invest
post-image
BTC-0.67%
$AKE With price moving sideways like this, it seems like they're luring everyone into shorting before pushing it higher again, right? Otherwise, if they were going to dump, they would have done it this morning. Let's try going long and see ;))
post-image
AKE+6.07%
  • 1
Load More

Join 40 M users in our growing community

⚡️ Join 40 M users in the crypto craze discussion

💬 Engage with your favorite top creators

👍 See what interests you

Trending Topics

GateIPOAccessAnthropic

303.4K Views2.8K Discussing

Gate IPO Access Phase 3 features Anthropic (ANT), with USDT subscription interest starting from 100 USDT. Successful allocations will be delivered as real shares to Gate Stock Accounts. Indicative price: $70–$78/share Subscription: Nov 12–17 (UTC+8) Allocation is not guaranteed. Please manage risk accordingly.

Dr.HanOxfordUnionSpeech

147K Views583 Discussing

USOctoberPPIBelowExpectations

460.5K Views1.4K Discussing

View More