
Square
Following
Hot
News
Profile
Share your thoughts
placeholder
Article
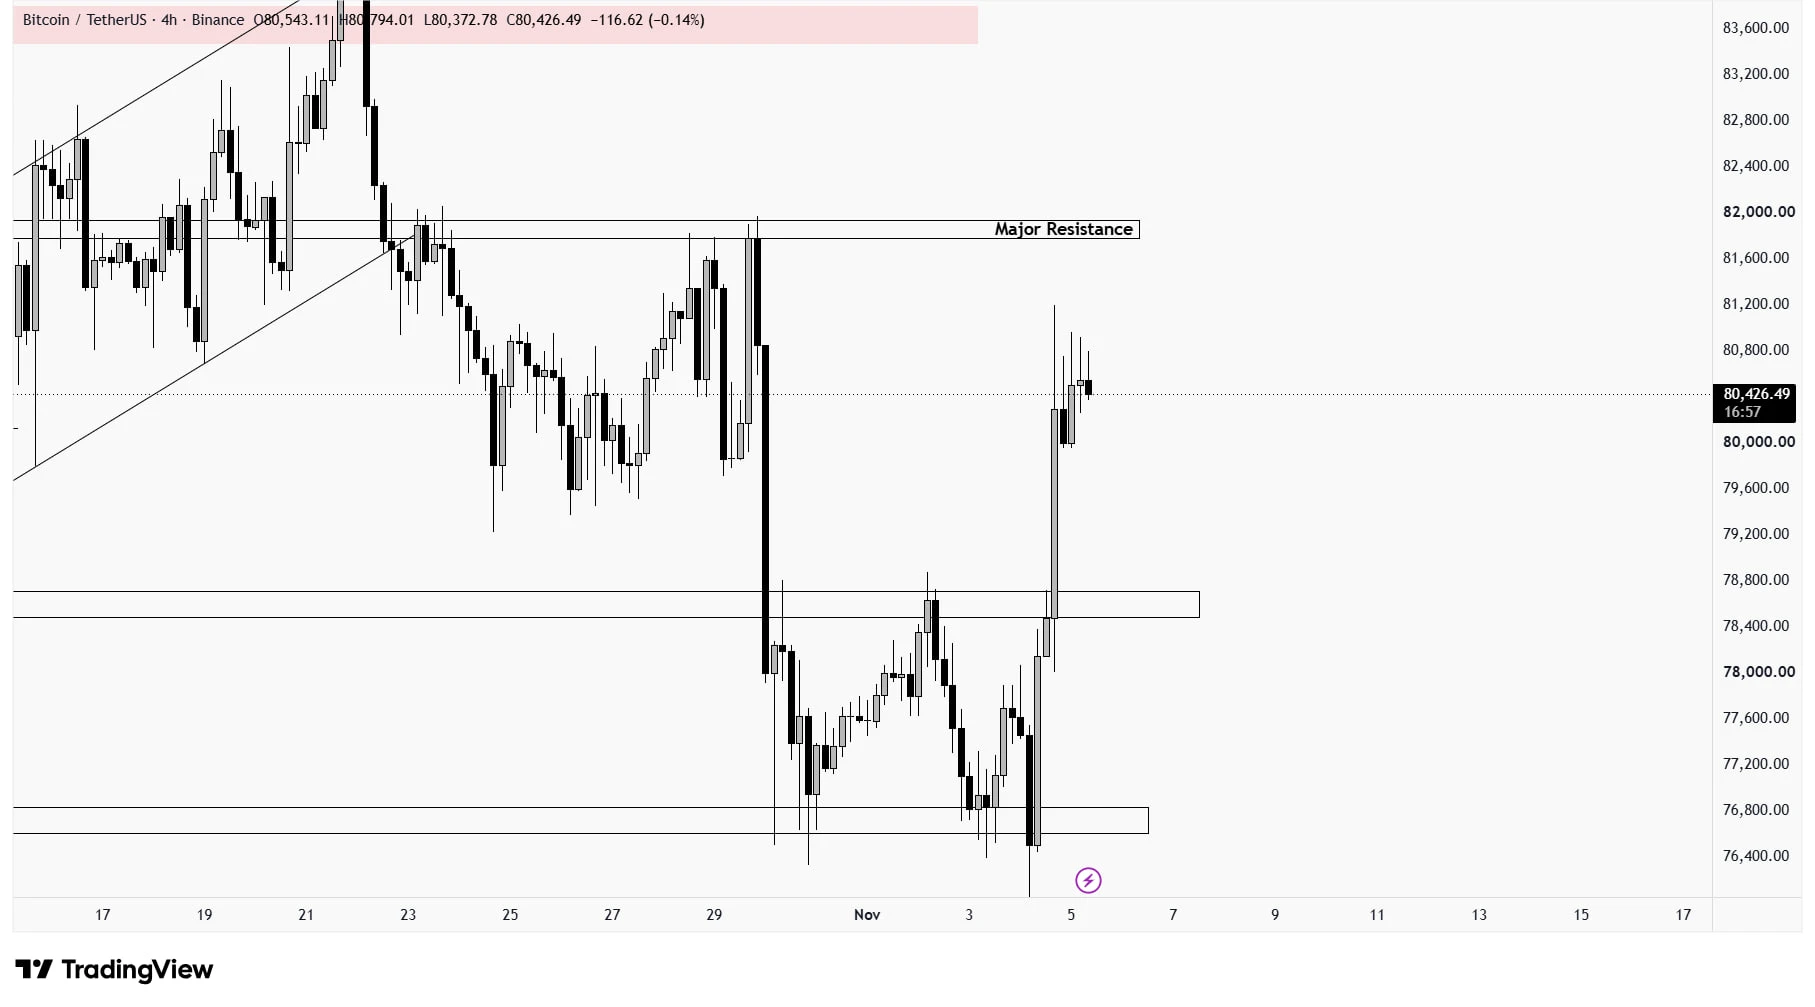
#BTC had a sharp pump in the market and nearly hit resistance, with the price moving sideways after that move. We have #NFP tomorrow, which can lead to either a rejection or a break above, so keep an eye on it.
$BTC ‌#BTCBackAbove80K #ShareWeekly
post-image
BTC-0.67%
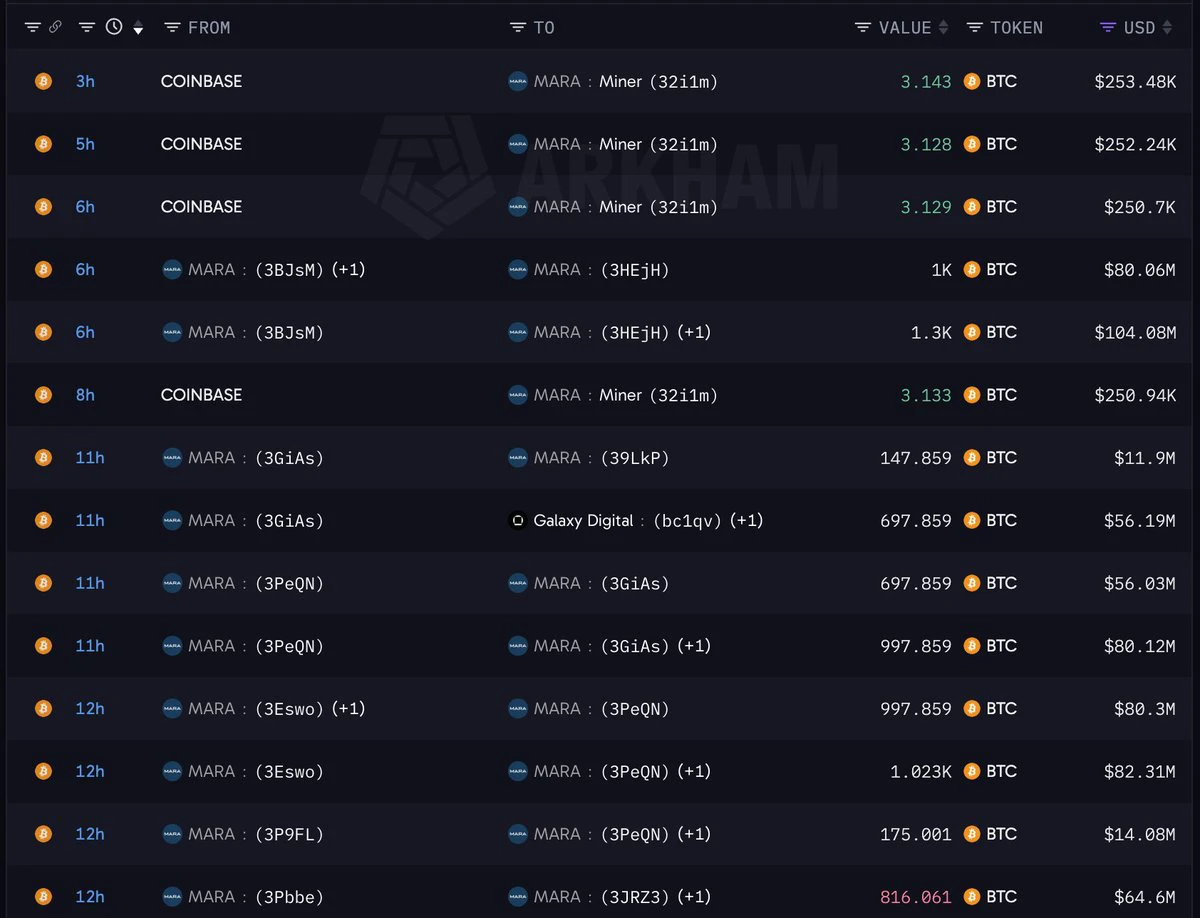
🚨 MARA MOVES $132.8M IN BITCOIN!
Bitcoin miner MARA has transferred 1,650 $BTC | $132.8M to Galaxy Digital, Copper, and other platforms in the last 12 hours.
After this big transfer, the fear of another round of selling in the market has increased..
post-image
MARA-4.24%
BTC-0.67%
GLXY-16.94%
Trenches
ZIG
Z
bade
b
ZIG
0x8c...1145
Market Cap
$.
Change
.
24h Vol
$.
Holders
.
BTC
B
bade
b
BTC
C5xp...pump
Market Cap
$.
Change
.
24h Vol
$.
Holders
.
HIGH
H
bade
b
HIGH
7ymF...high
Market Cap
$.
Change
.
24h Vol
$.
Holders
.
STONK
S
bade
b
STONK
6GmA...UNgx
Market Cap
$.
Change
.
24h Vol
$.
Holders
.
CORLA
C
bade
b
CORLA
0xba...7777
Market Cap
$.
Change
.
24h Vol
$.
Holders
[NEW STREAMER]market update
live-cover
LIVE1,747
Woke up feeling oddly bullish on the @base eco
post-image
Use a small investment to pursue big gains, and join my livestream at 21:00 tonight
post-image
  • 3
#Gate推出行业首个资金安全证明
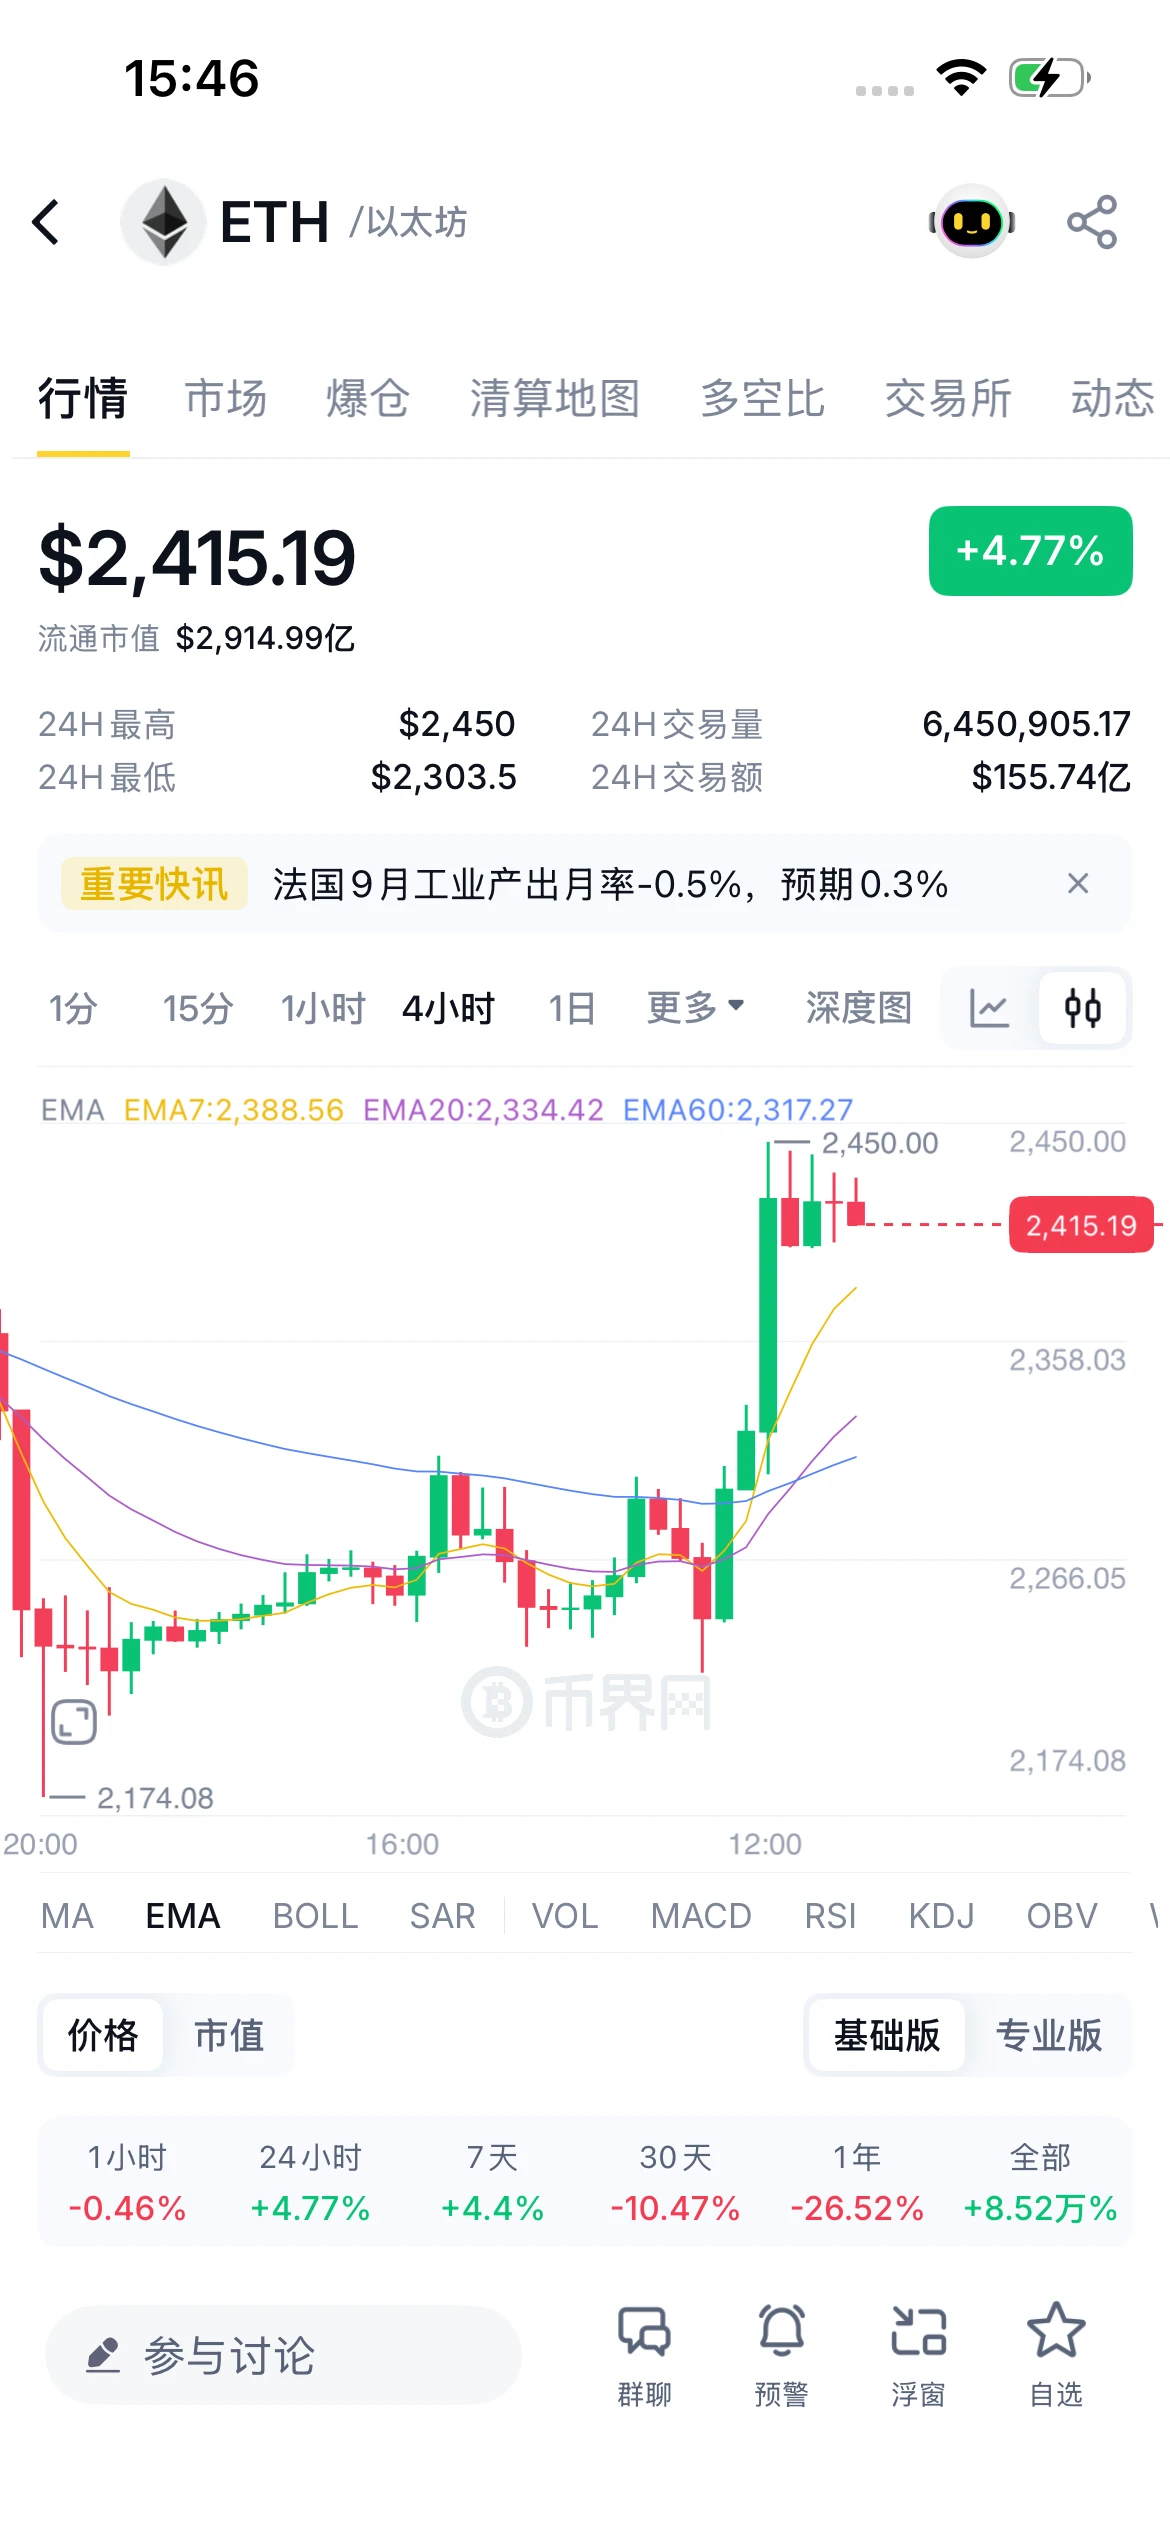
Firmly hold the ETH long. After the strong bullish candle, the EMAs are in bullish alignment. As long as the pullback holds above 2388, it is building momentum for a push to 2450; a break above the previous high could accelerate the move.
Market: After bottoming at 2174.08 on the 4H chart, ETH rebounded strongly and is now at 2415.19 (intraday +4.77%). It has moved above EMA7(2388.56)/EMA20(2334.42)/EMA60(2317.27), forming a bullish structure and building momentum as it approaches the 24H high of 2450. The 1-hour decline of -0.46% is a minor pullback at the highs and a healt
post-image
ETH-1.26%
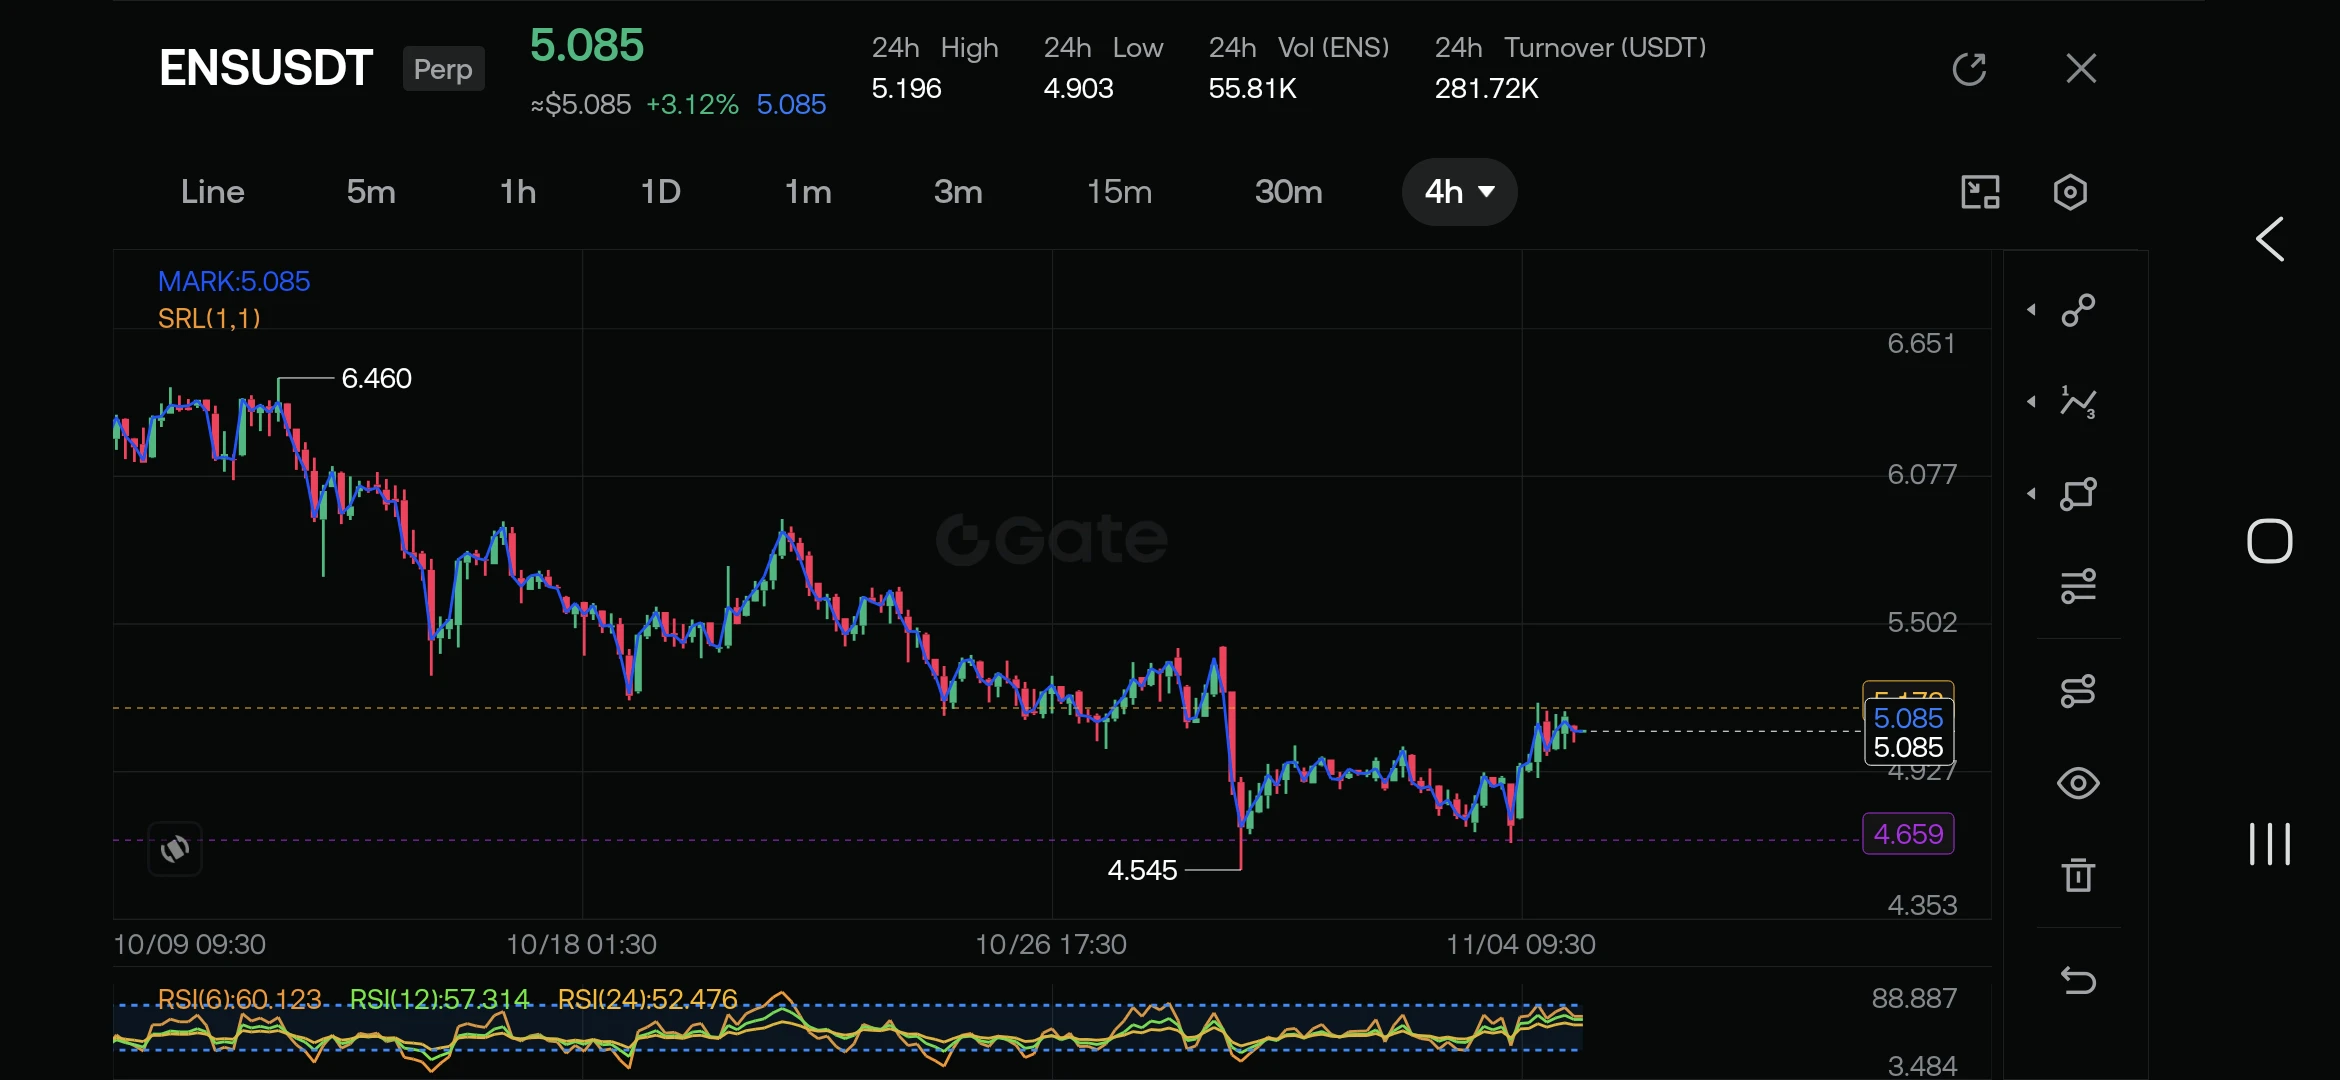
#BTCBackAbove80K #$ENS Technical Breakdown: Relief Rally or Reversal?
​ENS/USDT is showing signs of recovery on the 4-hour chart, trading around $5.085 (+3.12%) after carving out a local bottom at $4.545.
​Following a steady multi-week downtrend from the $6.460 high, the price found strong buyer support near $4.55, establishing a higher low around $4.66. The current bounce reflects renewed upside momentum as price action pushes back above the psychological $5.00 handle, testing immediate overhead resistance near $5.15–$5.20.
​Key Levels to Watch
​Support: Primary support rests at $4.66, with c
post-image
ENS-1.25%
  • 2
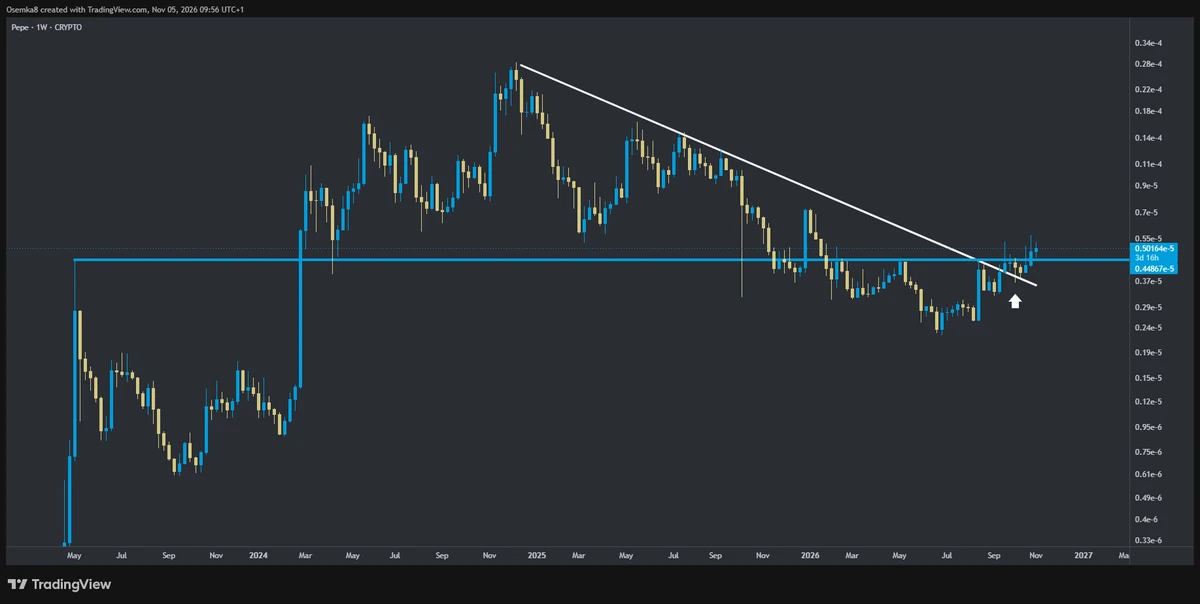
[ $PEPE ]
Look at how long PEPE has been below blue level. It has finally broken above while also retesting the white diagonal.
We'll have a runner pretty soon when 505 level is cleared
post-image
PEPE+0.97%
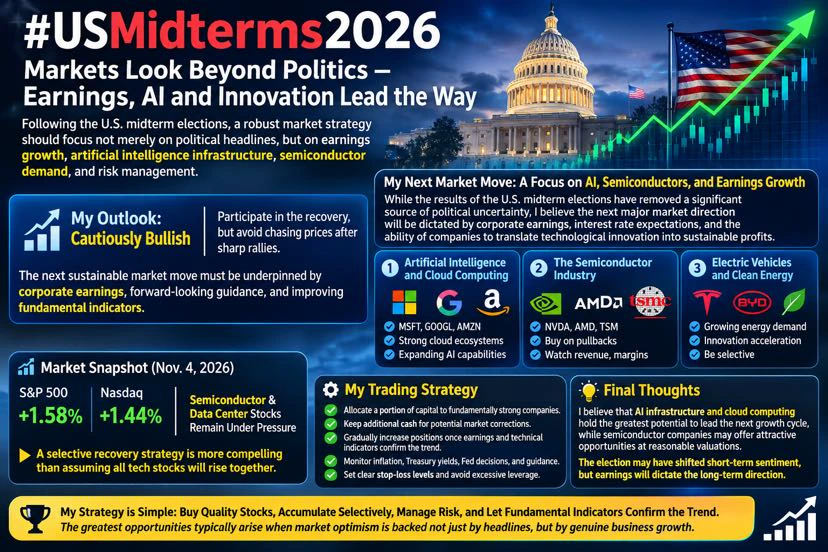
#USMidterms2026
Following the U.S. midterm elections, a robust market strategy should focus not merely on political headlines, but rather on earnings growth, artificial intelligence infrastructure, semiconductor demand, and risk management.
My approach would be cautiously bullish: participate in the recovery, but avoid chasing prices after sharp rallies. The next sustainable market move must be underpinned by corporate earnings, forward-looking guidance, and improving fundamental indicators.
My Next Market Move: A Focus on AI, Semiconductors, and Earnings Growth
While the results of the U.S.
post-image
AAPL+5.39%
MSFT+6.76%
NVDA-3.03%
AMD+0.88%
GOOGL+3.25%
  • 7
The “bull is back” calls are ringing out again, but last night’s market action didn’t really support blind optimism. BTC and ETH did see a rare rally, but the U.S. tech sector was sharply divided: hardware tech stocks like SNDK plunged, while AAPL held up relatively well. Tech stocks have usually rebounded in unison, but hardware clearly lagged this time—a detail we can’t ignore.
The reason may not be limited to earnings. The U.S. public is taking a tougher stance on data centers, as electricity and water prices rise and local opposition continues to build. Looking at the electoral map, many s
post-image
BTC-0.67%
ETH-1.26%
SNDK-7.93%
AAPL+5.39%
I'm trading on Gate, a top-tier exchange with a 13-year track record. Come join me and dive into the hottest events right now! https://www.gate.com/campaigns/6766?ref=VLARBF1YAG&ref_type=132
post-image
  • 1
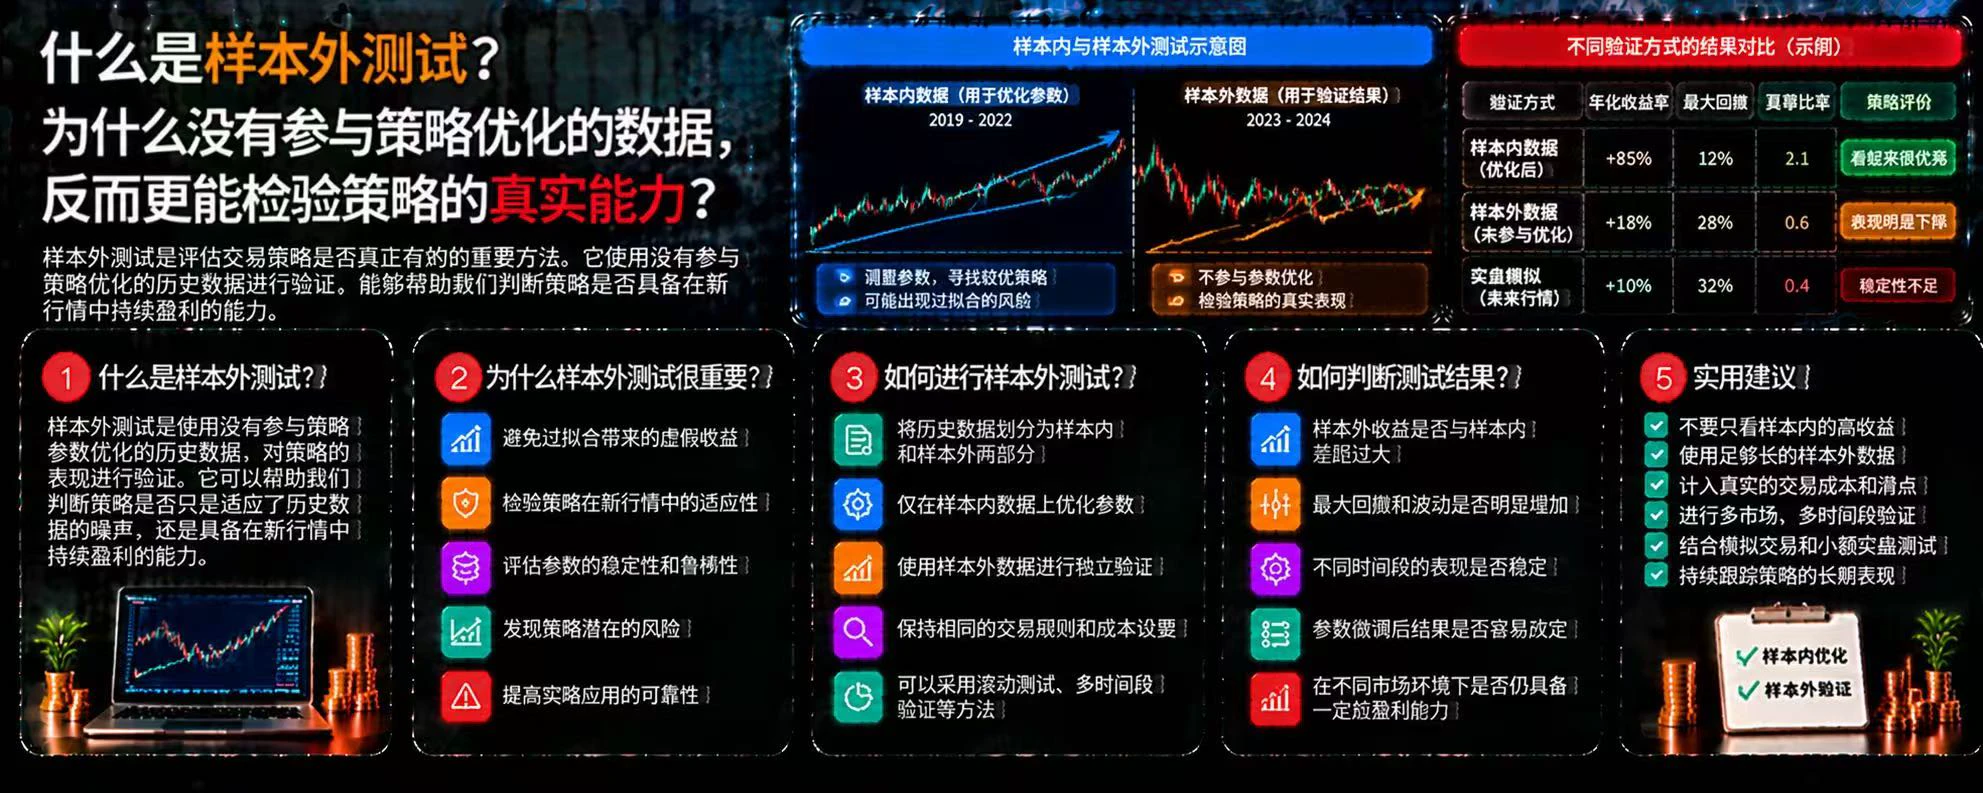
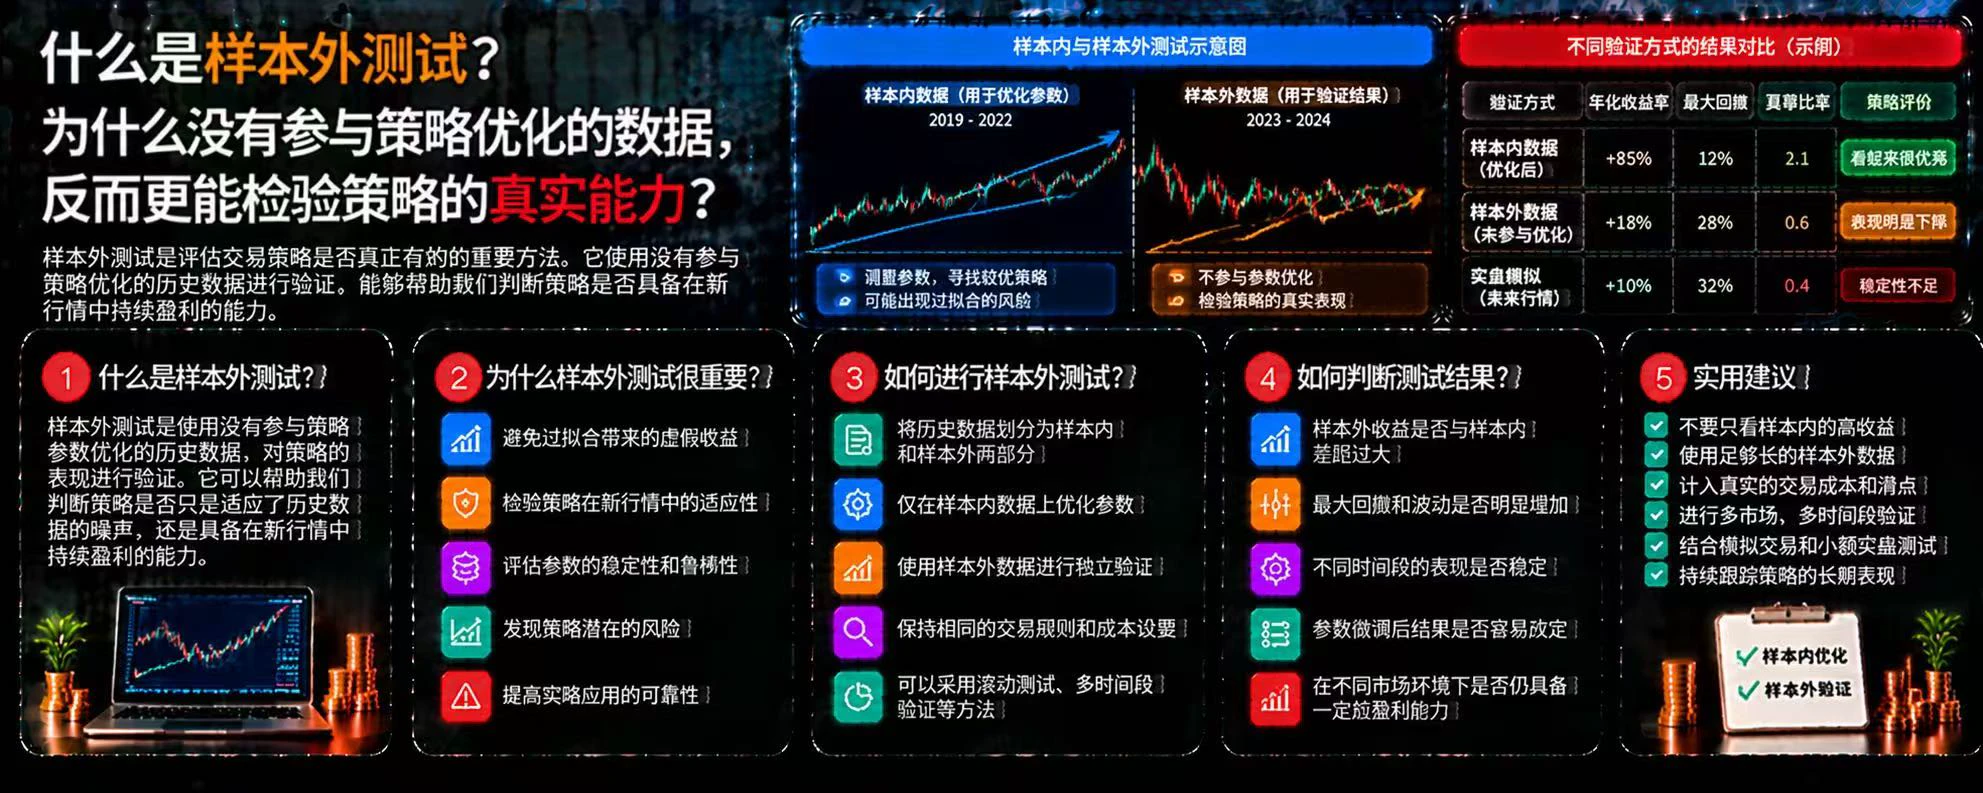
What Is Out-of-Sample Testing? Why Can Data Not Used to Optimize a Strategy Better Reveal Its True Capabilities?
In cryptocurrency trading, a strategy may perform well in historical backtests but quickly fail under new market conditions. The problem may not lie in the trading logic itself; the strategy may instead be overfitted to the historical data used for optimization. Out-of-sample testing is an important way to identify this issue.
First, what is out-of-sample testing?
Out-of-sample testing means using data that was not involved in strategy development or parameter optimization to indepe
post-image
BTC, ETH, GT, XRP, DOGE
live-cover
LIVE2,895
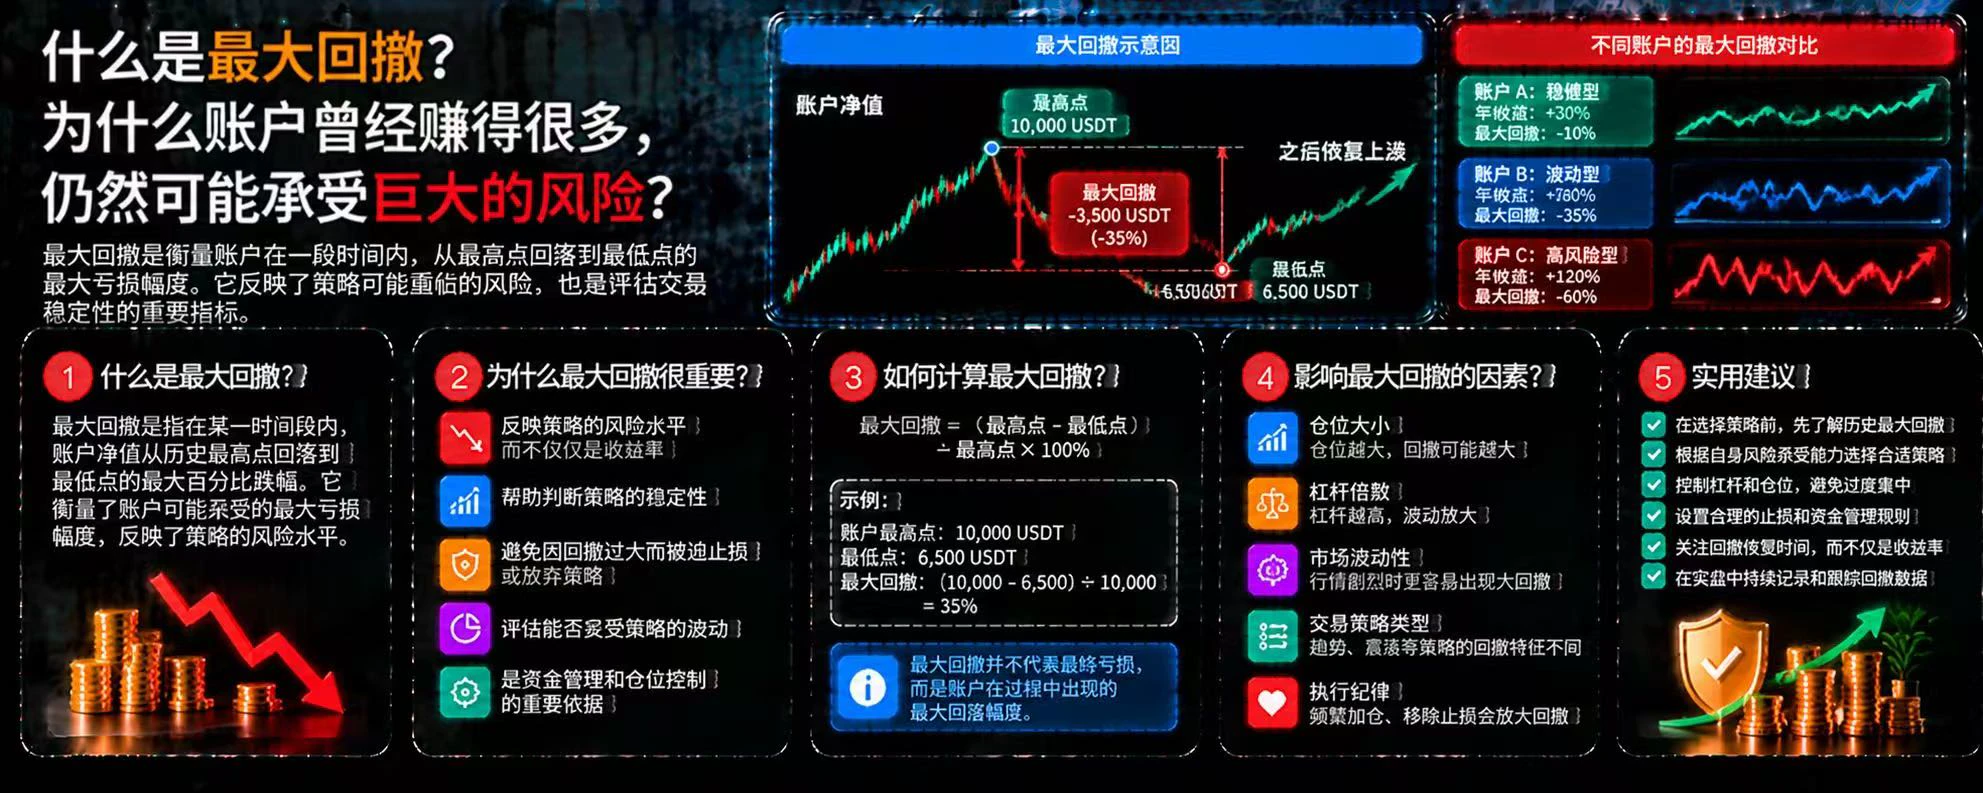
What Is Maximum Drawdown? Why Can an Account That Once Earned a Lot Still Face Huge Risks?
In cryptocurrency trading, looking only at how much an account ultimately earned can make it easy to overlook the risks it experienced along the way. Even an account that once generated very high returns may have gone through a severe drawdown and may even struggle to recover because of poor money management. Maximum drawdown is an important metric for measuring this risk.
First, what is maximum drawdown?
Maximum drawdown is the largest percentage decline in an account’s net asset value from a peak to a
post-image
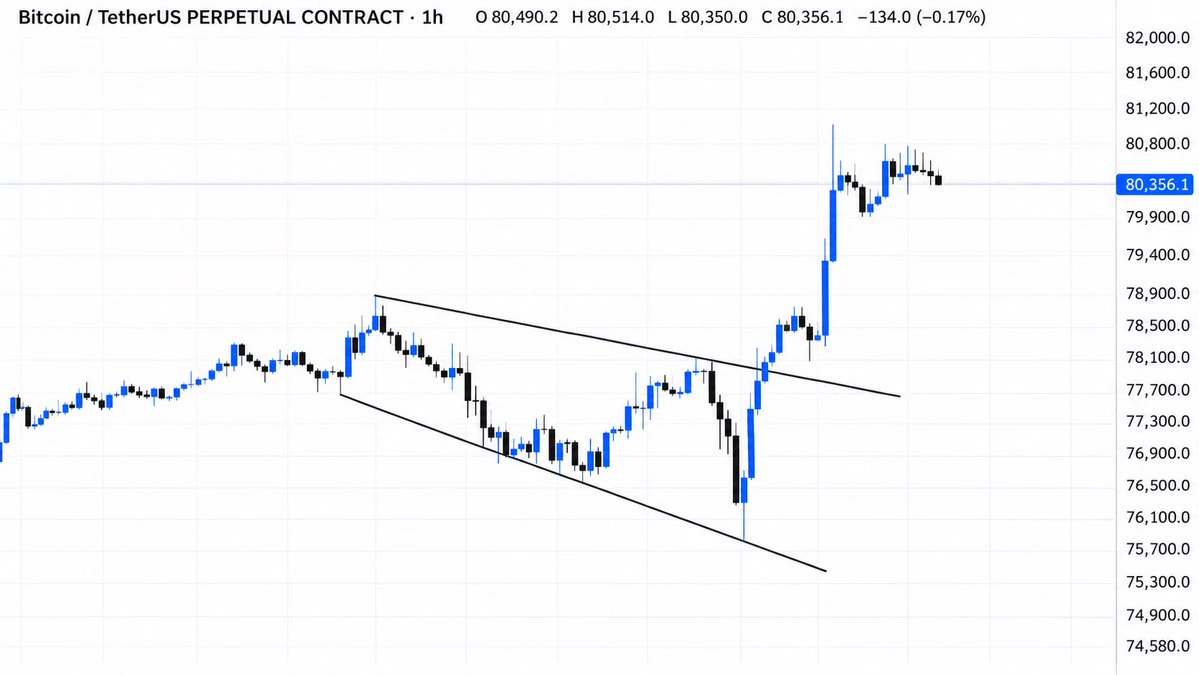
Bitcoin has broken out of the descending trendline, and the retest is now underway.
If buyers successfully defend this breakout level, we could see another strong move to the upside.
The key now is whether BTC can hold above the broken resistance and turn it into support.
bitcoin:native
post-image
BTC-0.67%
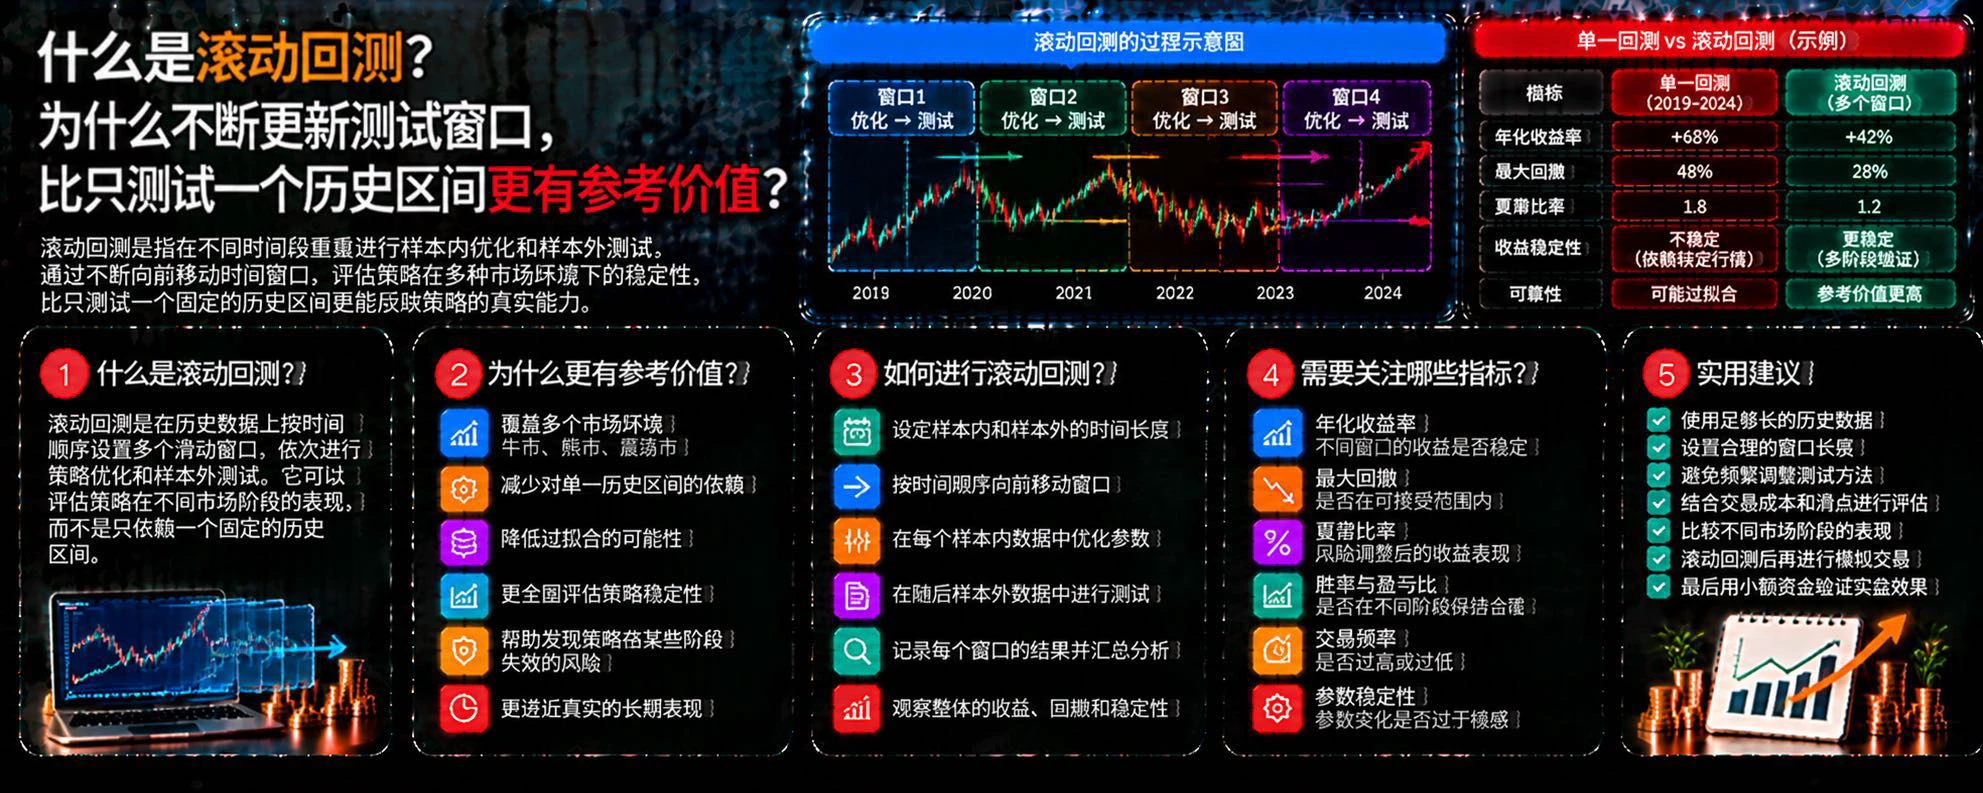
What is rolling backtesting? Why is continuously updating the test window more informative than testing just one historical period?
In cryptocurrency trading, a strategy may perform well only during a certain period of historical market data, yet fail to adapt to subsequent market changes. Testing only one fixed period can overlook how the strategy performs under different conditions. Rolling backtesting helps traders evaluate a strategy’s stability more comprehensively by continually updating the test window.
First, what is rolling backtesting?
Rolling backtesting divides historical data into
post-image
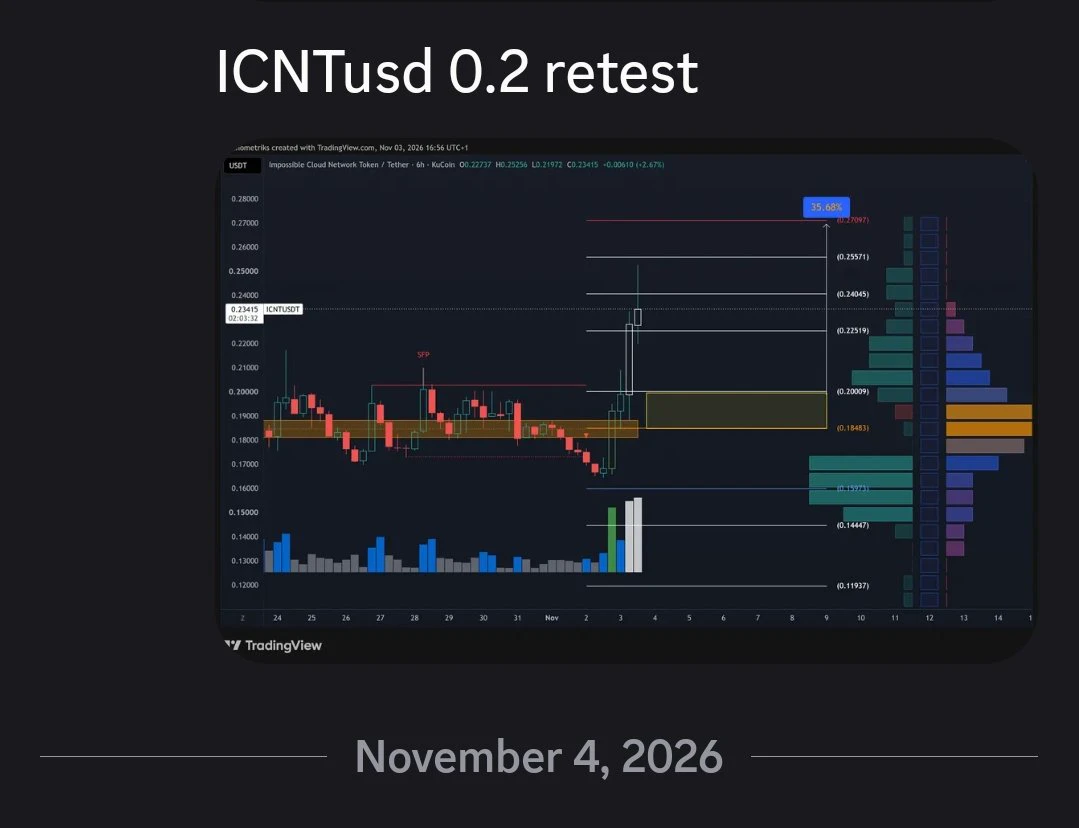
$ICNT u gud 2 days later ?
#icnt Money making made simple
#いい推しの日 #みんなでロカボ
post-image
ICNT-10.32%
What Is Out-of-Sample Testing? Why Can Data Not Used to Optimize a Strategy Better Test Its True Capabilities?
In cryptocurrency trading, a strategy may perform well in historical backtests but quickly fail in new market conditions. The problem may not lie in the trading logic itself; the strategy may instead be overfit to the historical data used for optimization. Out-of-sample testing is an important method for identifying this problem.
First, what is out-of-sample testing?
Out-of-sample testing means independently evaluating a strategy using data that was not used in its development or para
post-image
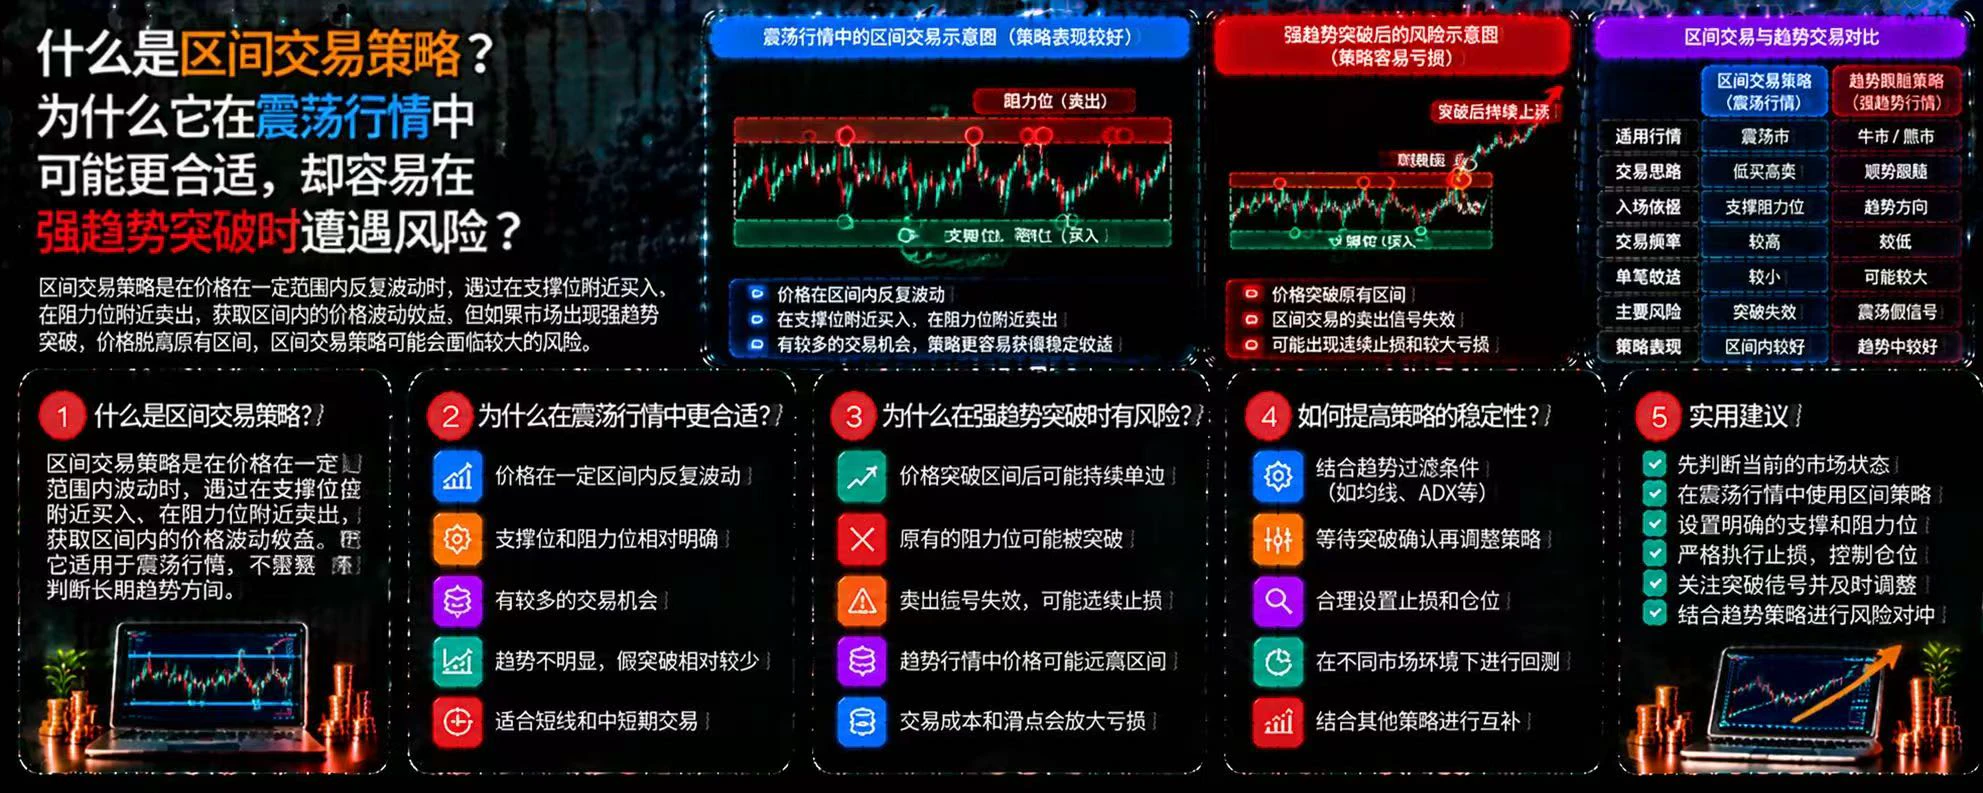
What Is a Range Trading Strategy? Why Might It Be More Suitable in a Range-Bound Market, Yet Risky During a Strong Trend Breakout?
In cryptocurrency trading, prices do not always rise or fall continuously. When the market lacks a clear direction and prices repeatedly fluctuate within a certain range, a range trading strategy may be useful. But once the price truly breaks out of the range, the original trading logic may quickly become invalid.
First, what is a range trading strategy?
Range trading involves identifying support and resistance areas where prices repeatedly fluctuate, looking for b
post-image
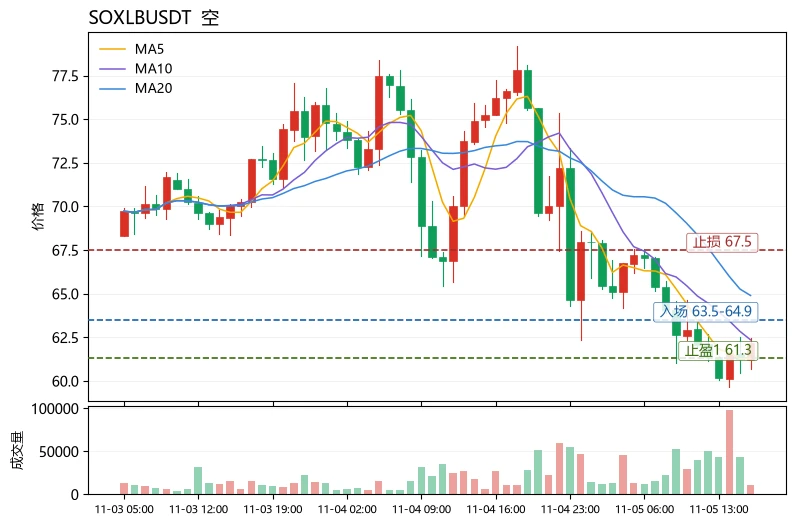
$SOXLB$SOXLB Bottom line: bears are in control; short rallies, don't chase lows. After plunging 19.12% in 24h, the price at 62.08 remains capped below MA5 (61.30) and MA20 (64.90), and the bearish moving-average alignment has not reversed; RSI is only 39.0, while the MACD histogram remains negative at -0.175, indicating a weak rebound rather than a reversal. On the funding side, the 30-candle range is as high as 31.44%, with clear signs of leverage being flushed out by sharp wicks. The neutral Fear and Greed Index reading of 50 means panic selling may not yet be over, and funds are more inclin
post-image
SKHYB
SKHYBSK Hynix
Pump.Fun
MC:$3.08KHolders:1
0%
BCH+1.05%
Load More

Join 40 M users in our growing community

⚡️ Join 40 M users in the crypto craze discussion

💬 Engage with your favorite top creators

👍 See what interests you

Trending Topics

GateLaunchesPoSECProofOfSecurity

239 Views455 Discussing

Gate has officially launched Proof of Security, or PoSEC, extending beyond Proof of Reserves by disclosing the distribution of cold-storage and hot-wallet assets and introducing a cold storage coverage ratio to measure protection under extreme-risk scenarios. Gate’s latest cold storage coverage ratio stands at 104.58%, with 88.26% of assets in cold storage and 11.74% in hot wallets. A coverage ratio of at least 100% means cold-storage assets alone would still be sufficient to cover all user assets even if hot-wallet assets were fully lost. Exchange security is not only about whether reserves are sufficient, but also how assets are stored and protected under extreme conditions. Could cold storage coverage become a new industry standard?[👉 Learn more](https://gate.com/proof-of-security)

BTCBackAbove80K

45.78k Views41.28k Discussing

DemocratsWinBothChambers

19.88k Views461 Discussing

View More