Share your thoughts
placeholder
Article
$SOL SOL/FDUSD: Dual Scenario Analysis — Wave B Top vs. Wave (5) Push
Here is an updated technical outlook for SOL/FDUSD on the 1H timeframe under our Posibility 2 macro structure.
Macro Wave Context:
Looking at the larger structure, the current price action aligns closely with a corrective green Wave B rather than a primary impulse Wave 5. There are two structural possibilities regarding this Wave B:
It is currently in its final sub-micro expansion towards $108.79 (1.0 Fib Extension).
Wave B may have already topped out around the $107.00 region, marking the early stage of a major corrective s
post-image
SOL+2.91%
I was just about to go to the forum and rant, but then I saw my balance. Never mind—the market is always right.

When the dump started in the early session, $PEPE made a token rebound to around 0.000003984. It couldn't even hold that level, with pathetically weak buying support. This feeble rebound was clearly handing me a pillow for my short. After entering, I set my stop-loss and left it alone.

Looking again now, the current price is 0.000003635, and the profit has already reached +677.34%. Time to have a good meal, brothers. It was truly sluggish earlier, but the outcome is truly sweet.
post-image
PEPE+0.20%
ZEC+15.76%
DOGE+2.09%
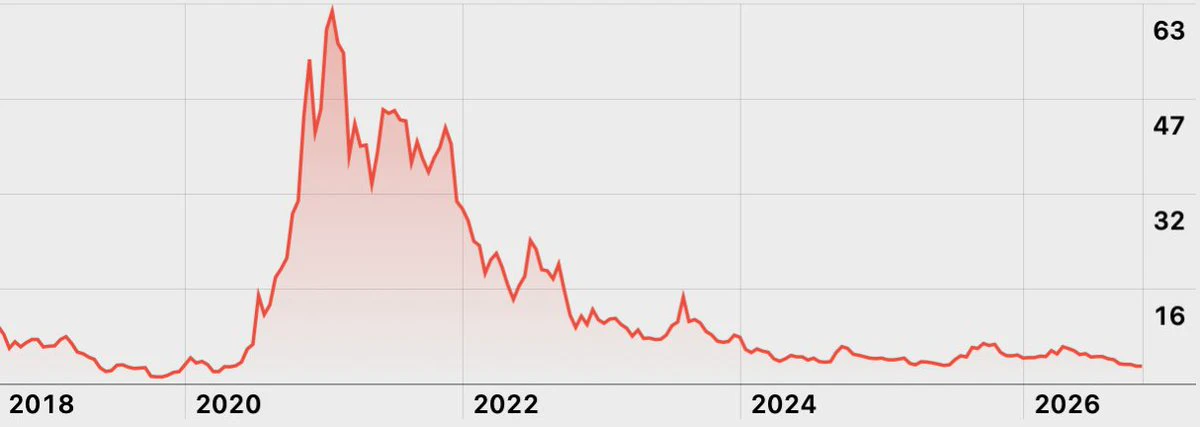
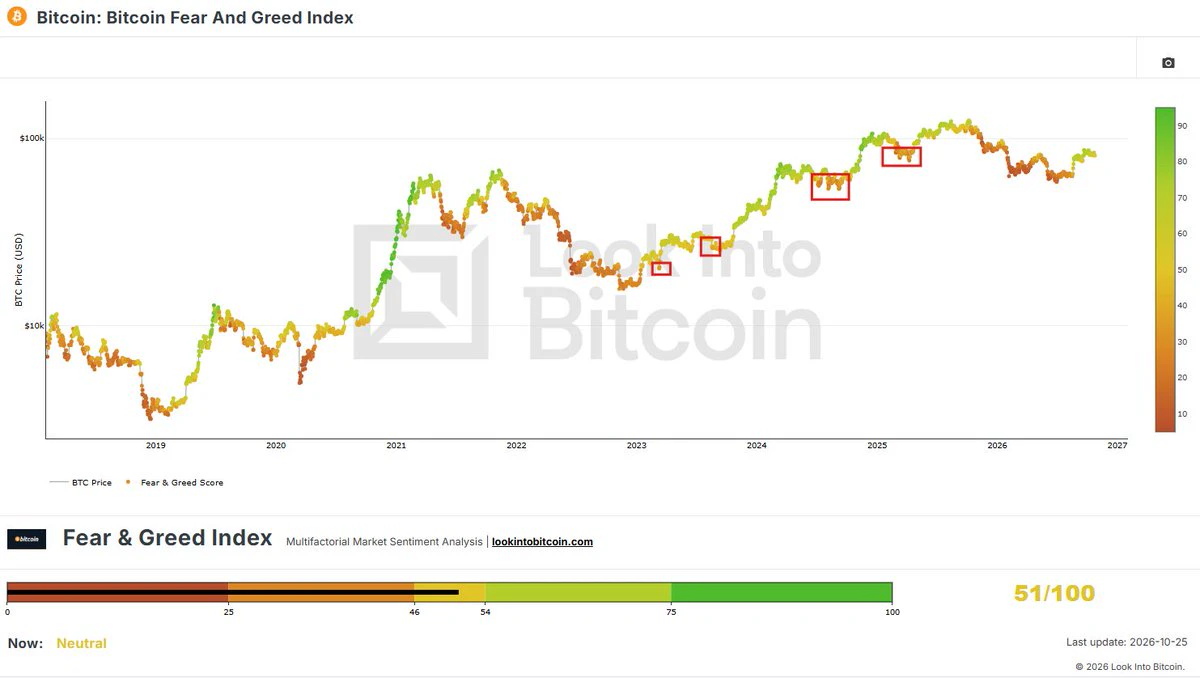
what part of the cycle is this
post-image
#‌$NVDA NVDA AT $231: NVIDIA REMAINS ONE OF THE STRONGEST AI STOCKS — FULL MARKET ANALYSIS, NFP IMPACT & TRADING PLAN
NVIDIA remains one of the most powerful names in the global technology market, and in my view NVDA continues to deserve serious attention because the AI infrastructure story is far from finished. With NVDA around the $231 area, the stock is sitting in an important decision zone where momentum, fundamentals, AI demand, macroeconomic pressure and valuation are all coming together. The latest verified Friday close was approximately $230.36, after NVDA traded as high as $234.76 and
Caught Ethereum at 382 last Friday and manually closed the position this morning, still making dozens of points. If there’s a wick on Monday, I’ll buy at the 0.5 or 0.618 level and take a position. The biggest resistance above is 2530. If it breaks through 2530 live with volume and without a wick, I’ll chase it directly at market price. Use this as a reference, brothers! Now I only have the remaining SK Hynix position in hand—watching 1350. #海力士 #闪迪 #以太坊
ETH+1.35%
SNDK+11.88%
$BSB has broke out ascending triangle on 1h timeframe 👀
Expecting 200%+ Bullish Rally 📈
Free Signals:
#Crypto #BSB #BSBUSDT #BSBCoin #cryptocurrency
post-image
BSB+5.16%
Today Crypto Markets News
live-cover
LIVE1,677
I did nothing—just went to the restroom, and when I came back, the candlestick chart had already done the work for me. During the repeated intraday swings, $UNI pulled back to a key level. It didn’t break through, and every dip was pulled back up by buying pressure. Once it held the retest, I judged that this was the opportunity and entered directly around 4.490. It then took off.
For a trade I’m not confident in, taking a look is clear-headed, but buying even one unit is foolish. I understood this trade, so I was able to hold it. The current price is 7.053, with returns reaching +2582.3%. It
post-image
UNI+12.45%
ADA+0.78%
ETH+1.34%
THE COMEBACK WILL BE EPIC
😎😎😎😎😎
post-image
EPIC+18.84%
Bonk Guys PONS holdings achieved returns of over 150x, while the portfolio surpassed $27 million to
live-cover
LIVE2,012
[ $GRT Signal] Short-term long + 1H order book absorption/negative funding support
$GRT The 1H pullback reached around 0.0197, with buy-side quote depth nearly 70% higher than sell-side depth and order book imbalance at 25.73%. RSI(1H) is 62.66, not yet in the overbought zone; the 4H MACD histogram is expanding positively, while the 1H histogram is contracting positively. Funding is negative at 0.0296%, open interest shows no sharp fluctuations, and the latest 1H candle was a pullback on declining volume.
🎯Direction: [Long]
⚡Entry/Limit order: [Place a long order in the 0.0196808 - 0.0197400
post-image
GRT+10.96%
BTC+0.09%
ETH+1.35%
SOL+2.84%
No big-picture thinking, couldn't hold on—the profits on this move were paper-thin, but I loved every bit of it. The last thing I saw before bed was $DOT still grinding at the highs; volume hadn't followed, and even if it moved higher, there was no one to take it. This kind of low-volume rebound is just playing with itself, so I placed a short order at 1.193 and went to sleep. When I woke up this morning, the current price had already moved to 0.975, with +1296.58% lying there nicely.

What you can take away is profit; what you can't take away is volatility.

Follow through with the positio
post-image
DOT+5.91%
ETH+1.34%
SNDK+1.29%
$ACE — What’s the next move? 👀
The 4H structure is still bearish. Since the rejection around $0.289, ACE has been printing a clear sequence of lower highs and lower lows.
Current price: ~$0.168
My read: ACE is sitting near support. If $0.160–0.165 breaks decisively, another leg lower becomes likely.
But if buyers reclaim $0.179–0.192 and hold it, that would be the first meaningful sign of a structure shift and could trigger a stronger relief rally.
So right now: bearish until proven otherwise. 📉
post-image
ACE-4.44%
Everyone’s staring at ETH’s 2500 pivot—but the 4h chart just whispered a secret the crowd missed.

ETH/USDT - SHORT

Trade Plan:
Entry: 2497.5 – 2502.9
SL: 2525.7
TP1: 2481.1
TP2: 2468.3
TP3: 2449.2

Why this setup?
- RSI 15m at 52.31 = zero momentum, just noise before the drop.
- ATR 1h at 10.6 shows volatility is compressing—breakouts sting.
- 1D trend is range, but our SHORT bias (55%) targets 2481 first, then 2468.
- Why now? Price is stalling under 2502.9 resistance while SL sits safely at 2525.7.

Debate:
Are we front-running a fake breakdown to 2468, or is this the calm before
ETH+1.35%
I just took profit on my long position, so I’ll review it while the memory is still fresh. At the time, the market was moving sideways, with the moving averages on the hourly chart converging tightly and volatility narrowing further, clearly indicating that positions were being compressed. I judged that the direction would most likely break upward, so I first accumulated part of the long position near the lower edge of the range.

The move started slightly later than I expected, with even several false dips along the way. However, none of the dips broke down the range structure, and the key l
post-image
XRP-0.25%
ZEC+15.76%
Everyone’s long gold at 4436—but the 4h tape just whispered a word you didn’t hear: fade.

$XAU /USDT - SHORT

Trade Plan:
Entry: 4435.35 – 4437.55
SL: 4446.97
TP1: 4428.56
TP2: 4423.31
TP3: 4415.42

Why this setup?
- 1D trend is *range*, not breakout—so buying tops here is a donation.
- RSI 15m at 52.8 shows zero momentum behind the push; we’re stalling mid-range.
- ATR 1h at 4.38 means the real move is a snap-back, not a stretch.
- SHORT bias (55%) targets TP1 4428 and TP2 4423—only 0.3% away, but that’s where liquidity sits.
- Why now? The waiting status + tight entry (4435–4437)
XAU-0.04%
Name one stock that will 100% do this.
post-image
  • 3
Load More

Join 40 M users in our growing community

⚡️ Join 40 M users in the crypto craze discussion

💬 Engage with your favorite top creators

👍 See what interests you

View More