Share your thoughts
placeholder
Article
Everyone’s watching 80K, but I’m watching the 4h chart bleed—$BTC /USDT is about to fake you out.

$BTC /USDT - SHORT

Trade Plan:
Entry: 79698.9 – 79816.3
SL: 80321.3
TP1: 79334.9
TP2: 79053.0
TP3: 78630.3

Why this setup?
Why now? The 1D is rangebound, yet the 4h structure is cracking. RSI on the 15m is at 43 and falling—no bounce fuel. ATR is tight (234), meaning the breakout is coming, not optional. Entry at 79,757 with TP2 at 79,053 is a 0.9% scalp, but the real edge is the invalidation at 79,079. If that breaks, the short thesis is dead. This is a low-confidence trap (55%), so size do
BTC+0.08%
Crypto Signals and Trding Insights
live-cover
LIVE24
Lacking perspective, I can't hold on; the profit on this trade is as thin as paper, but I love it. A few days ago, the last thing I checked before bed was the market. $BMNR had clearly moved sideways around 24.39 all day, and every time it was pushed down, buyers happily stepped in to catch it. The signs of bottoming consolidation were plain to see. While others were fearful, I was greedy. I figured there wasn't much room to fall further from that level, so I opened a long position and got in early.
When I opened the app this morning, wow—it had been pushed straight up to 25.26, and at the key
post-image
BMNR+1.04%
SNDK+2.04%
LAB-0.12%
The opportunity is still there, be patient.

$ADA $SOL
post-image
ADA+3.89%
SOL+1.23%
Is this even a rebound, or CPR for my empty account? But now is definitely not the time to act impulsively. When I checked the chart after lunch, $XAUT surged to the highs on no volume, with clearly insufficient buying support. I tried shorting around 4486.7: volume didn’t follow, and with no one taking the other side, it naturally had to come back down.
The current price of 4427.9 has already given the answer—+121.82% secured. It dragged its feet earlier, but the result is truly satisfying.
Don’t mess with your position either: take 80% off the table first, move the stop-loss on the remainin
post-image
XAUT+0.02%
LAB-0.12%
XRP+1.13%
Everyone’s chasing PEPE longs—but my 4h tape just flipped a quiet SHORT signal.

PEPE/USDT - SHORT

Trade Plan:
Entry: 0 – 0
SL: 0
TP1: 0
TP2: 0
TP3: 0

Why this setup?
Why now?
- Range-bound on the daily = no trend to trust, only mean reversion.
- 15m RSI at 59.24 shows mild bullish pressure, but that’s exactly the trap before a dump.
- Confidence sits at 55.4—not screaming, but enough to fade the next pump.
- With ATR near zero, volatility is coiled; the breakout direction is down.
- Status: “Waiting”—so we’re early, not late.

Debate:
Is PEPE dropping to retest range lows, or
PEPE+2.72%
$ETH Signal】4H bearish continuation + 1H rebound under pressure, target pullback short
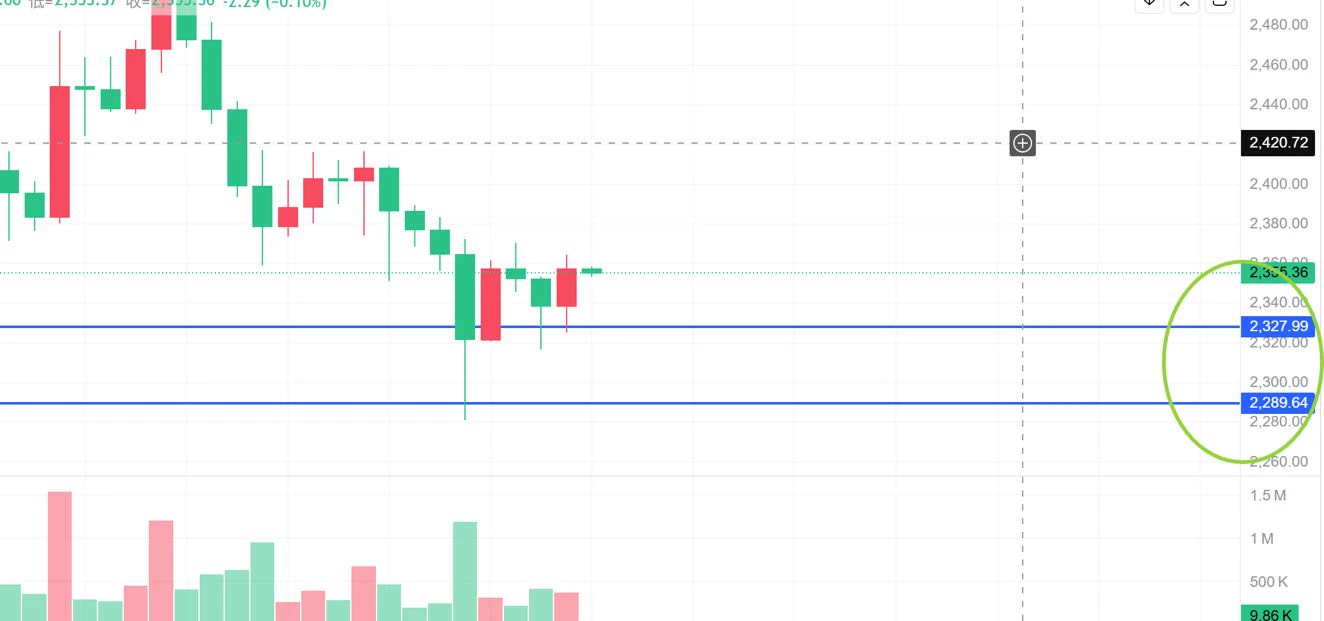
$ETH Order book depth imbalance -14.95%, with the buy side clearly weak. The 1H rebound to 2461 quickly retraced, the MACD 4H bearish histogram continues to expand, OI remains stable, and the funding rate of 0.0027% shows no signs of overheating. The current rebound is weak, with bears in control; the 1.5 risk-reward ratio is worth targeting.
🎯Direction: Short
⚡Entry/limit order: 2449.2801 - 2456.6500
🛑Stop loss: 2481.2165
🚀Target 1: 2419.8003
🚀Target 2: 2401.3754
🛡️Trade management: - Execution strate
post-image
ETH+1.02%
BTC+0.08%
I don’t chase after a volume-backed surge; that’s a rule I set for myself. When $ETH surged to 2485.57, volume did indeed pick up, but such a sudden expansion often means short-term divergence is intensifying, and chasing in makes it easy to get stuck at the top.

I entered my long position earlier, when the price repeatedly tested the key level around 2394.32. The key level held each time, and the rebounds after each pullback kept getting faster. I got the feeling that someone was accumulating at lower levels, so I followed and went long.

After the move played out, I still took profit on
post-image
ETH+1.02%
ZEC-1.17%
ADA+3.89%
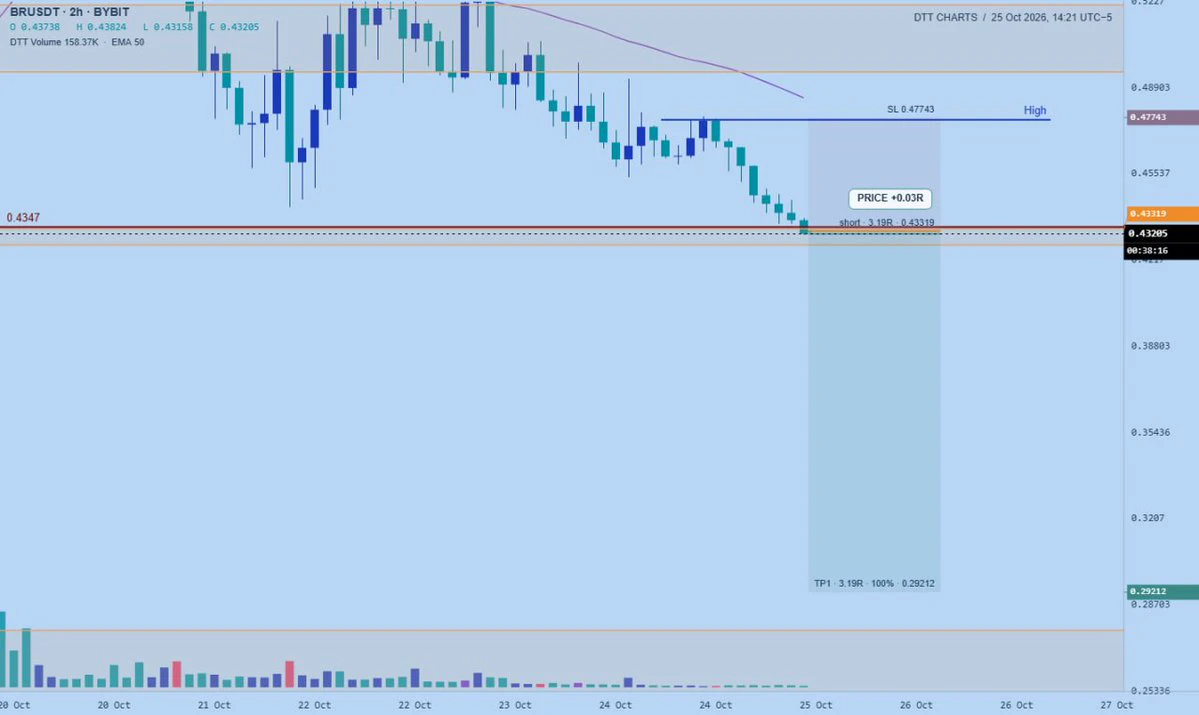
I originally wanted to cut my losses and sacrifice to the heavens, but the sacrifice never happened—the meat cooked itself. When the market plunged, the move hadn't fully gotten underway yet. I watched the volume for several minutes; no matter how hard the price tried to surge, it couldn't break higher, while sell orders kept coming in wave after wave. This kind of market is just handing points to the bears, and hesitating only makes it easy to miss out.
I'd rather miss a limit-up than catch a falling knife and end up with blood all over my hands.
So I placed a short order at 0.43133 and waite
post-image
DOGE+6.00%
BTC+0.08%
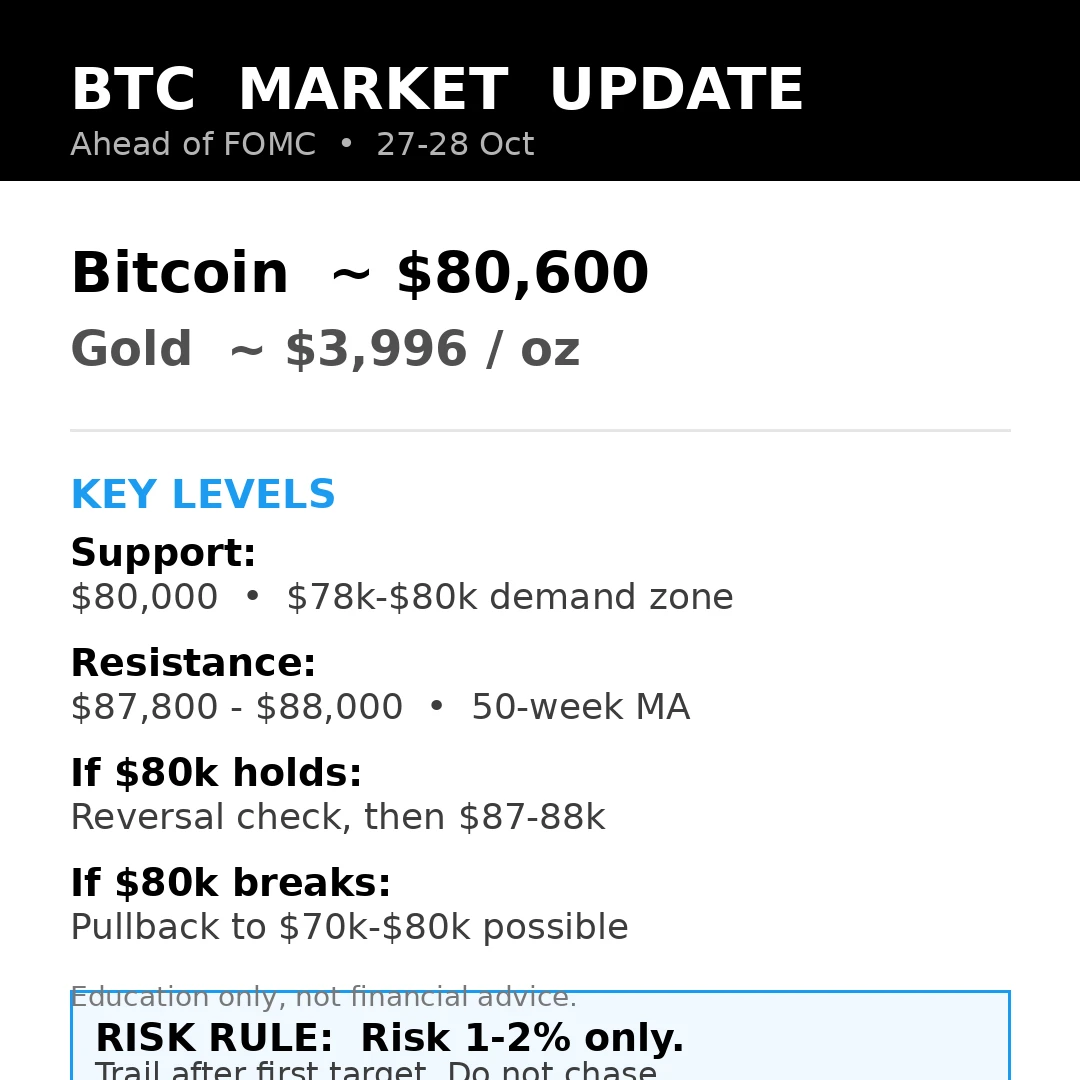
The probability of a Fed rate hike in September fell from 66% to 50% in just a few days. Fed Chair Christopher Waller sent a clear dovish signal, saying that if inflation slows further, he would support keeping rates unchanged in September. Bitcoin broke above $82,000, gold rose above $4,500, and U.S. stocks posted their biggest gain in nearly a month. What does such a sharp drop in expectations mean? How is the logic of crypto market pricing being reshaped?
It is meme season.
Make money 💰 from memes and hold solid coins.
MEME+2.80%
SKYAI’s 95% short signal just armed—but the real trap is waiting below 0.05828.

SKYAI/USDT - SHORT

Trade Plan:
Entry: 0.05894 – 0.05954
SL: 0.06208
TP1: 0.05711
TP2: 0.05569
TP3: 0.05356

Why this setup?
- 4H bias is SHORT with a 95% confidence score—this isn’t a coin flip.
- Daily trend is bearish, and RSI on 15m sits at 41.12, still room to drop before hitting oversold.
- Entry zone 0.05924–0.05954 aligns with ATR’s 0.001184 volatility—tight risk for a 3-TP cascade down to 0.05356.
- Why now? Price is hugging the 1H pivot while momentum bleeds; the invalidation at 0.05828 is your
SKYAI+6.30%
Bull-Bear Divide Deepens Around $82K! B.TOP Founder Sells All His BTC
live-cover
LIVE50
First signs of weakness on this massive PONS move. I think it would be good if it consolidated/pulled back here, that money flows into other tokens on RH chain and then we repeat with another leg up later.
Same as the BTC stalls > alts run loop we usually do, but RH specific.
post-image
PONS+31.40%
BTC+0.08%
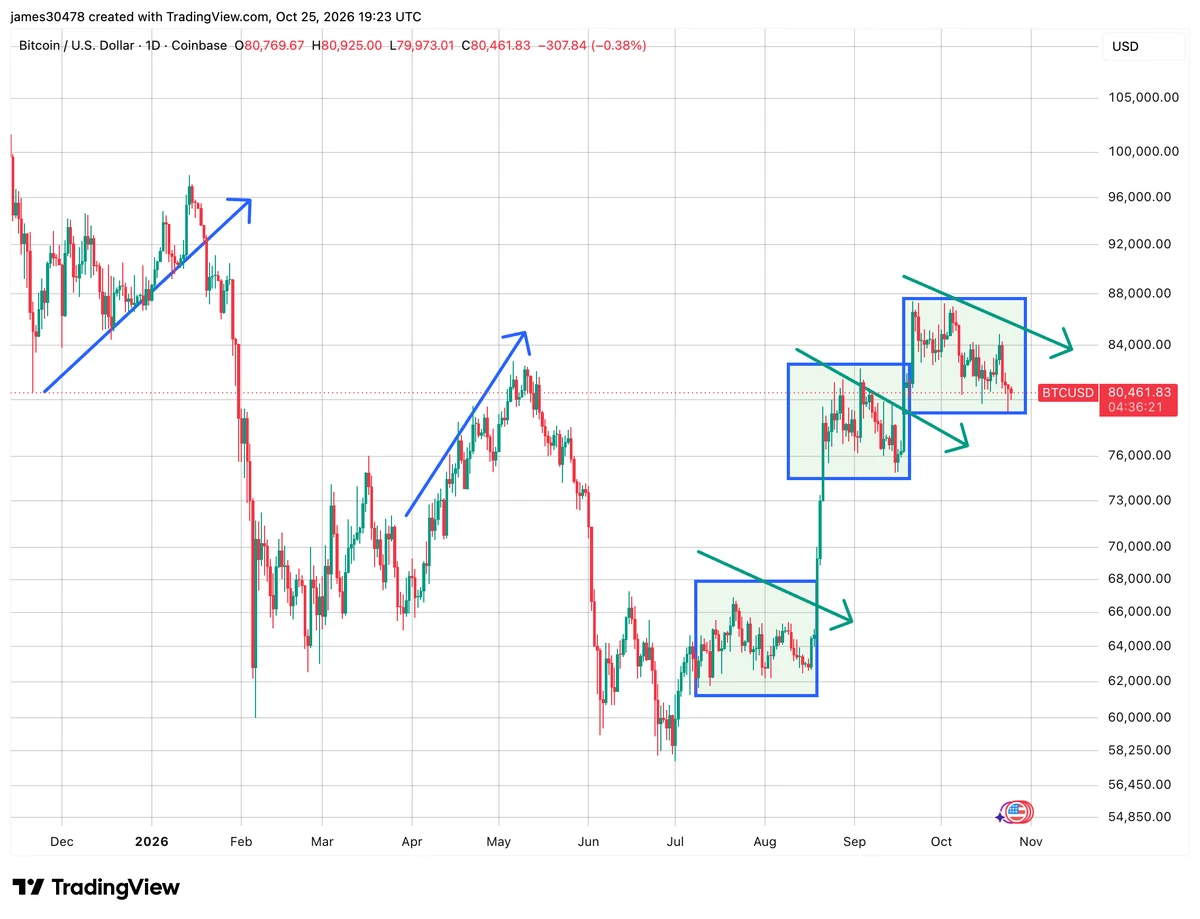
$BTC 's Recent bear market trend has seen a -54% drawdown top to bottom.
This was while all other markets were rallying hard, which is a good argument as to why it was "just" -54% this time around. Arguably, price would see a much larger drawdown if stocks and everything were down a lot too during this time.
This was a very isolated bear trend this time around.
#Gate60MillionUsers #BTCReclaims80K
post-image
BTC+0.08%
  • 7
$MU $SNDK $EWY $DRAM closed the week with a BREAKOUT 💥
MU+5.89%
SNDK+11.88%
A few days ago, I placed a limit order for $ZEC , which filled at around 828.40. I wasn’t expecting much, but when I woke up, I found that the market had already started moving in the direction I expected. After confirming that the candlesticks and volume were moving in sync, indicating that the upward move was not weak, I held the long position and observed.
After the price surged to the key level, a rapid wick appeared, and short-term divergence began to increase, reminding me not to get greedy. Without clinging to all the unrealized profits, I took profit on 80% first and moved the protectiv
post-image
ZEC-1.17%
BNB+6.16%
SOL+1.23%
I originally just wanted to freeload a breakfast, but the market ended up wrapping me in dumplings for half a year.
During the repeated intraday oscillations, the bottom never broke down. Someone stepped in to buy every pullback, while capital quietly entered the market. I judged that the bottoming process was nearly over, so I directly opened a long near 833.19.
The price has now climbed to 1018.4, $ZEC this move really delivered the answer, with the return on the position reaching +1578.39%. Those who stayed on board should be grinning in their sleep. It was truly sluggish at first, but the
post-image
ZEC-1.17%
ADA+3.89%
ETH+1.02%
Everyone’s buying gold’s dip—but XAUT’s 4h just armed a trap most won’t see.

$XAUT /USDT - SHORT

Trade Plan:
Entry: 4426.6 – 4429.0
SL: 4437.1
TP1: 4420.8
TP2: 4416.2
TP3: 4409.3

Why this setup?
Why now?
- 1D trend is **range**, not breakout—so chasing longs is gambling.
- RSI 15m at 48.7 shows zero momentum; price is stalling under 4427.8 resistance.
- ATR 4.6 on 1h means volatility is thin—perfect for a quiet grind to TP2 at 4416.
- With 55% confidence, this is a probability play, not a certainty—risk is defined at 4437.

Debate:
If XAUT slips below 4426, do you trust TP2 at 4
XAUT+0.02%
$GT is showing strong bullish momentum on the daily chart.
Price is up over 10% around $9.28 after breaking out from the recent $8.00 area.
Key levels I’m watching:
• Resistance: $9.67–$10.00
• First support: $8.80–$9.00
• Major support: $8.00–$8.20
If $GT can hold above $9.00 and break the recent $9.67 high, the next leg higher could open up.
For now, buyers clearly have momentum, but after such a strong move, a retest would be normal.
#GT #GateToken #Crypto
GT+10.72%
  • 6
  • 1
Load More

Join 40 M users in our growing community

⚡️ Join 40 M users in the crypto craze discussion

💬 Engage with your favorite top creators

👍 See what interests you

View More