


Square
Following
Hot
News
Notifications
Profile
Share your thoughts
placeholder
Article
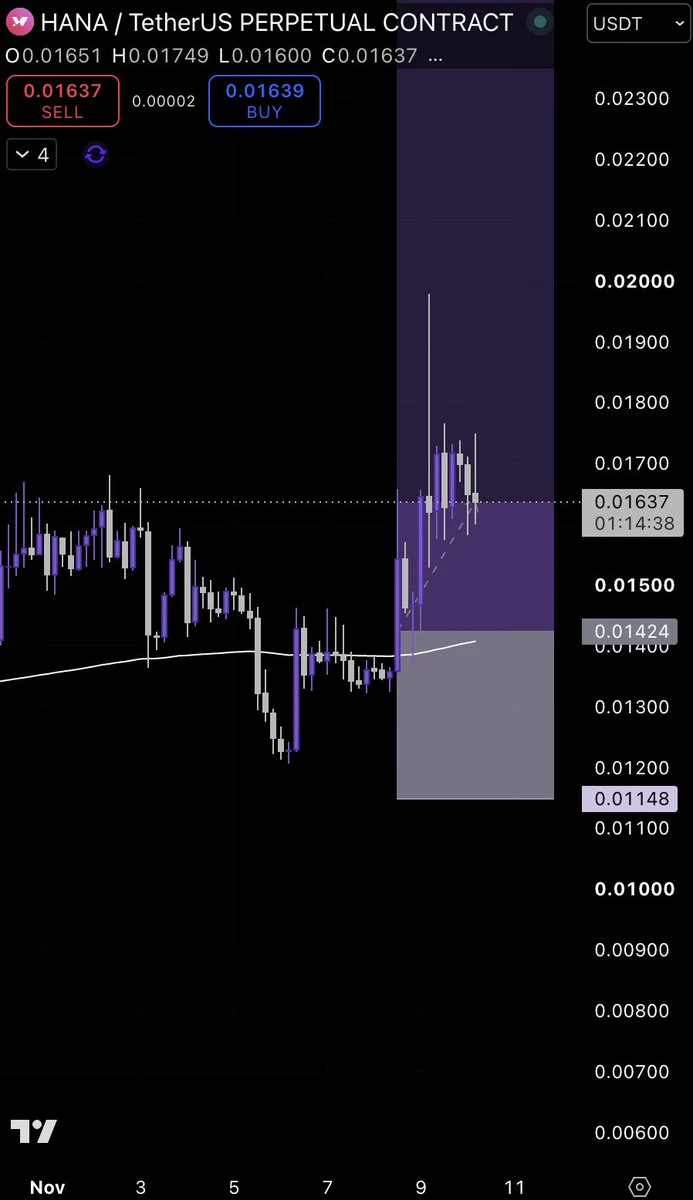
$HANA +40% in VIP 🔥
Price broke out of the consolidation zone around $0.014–$0.0145 and delivered a strong impulsive move toward $0.0175–$0.018.
Now we're seeing consolidation above the breakout area, with buyers still defending the $0.016 zone.
As long as price holds above $0.0142, the bullish structure remains intact. A continuation above $0.0175 could open the way toward $0.019–$0.020.
If the breakout level fails, watch for a deeper retest toward $0.0142.
Strong move so far — now let's see if buyers can keep control. 👀
post-image
HANA-3.22%
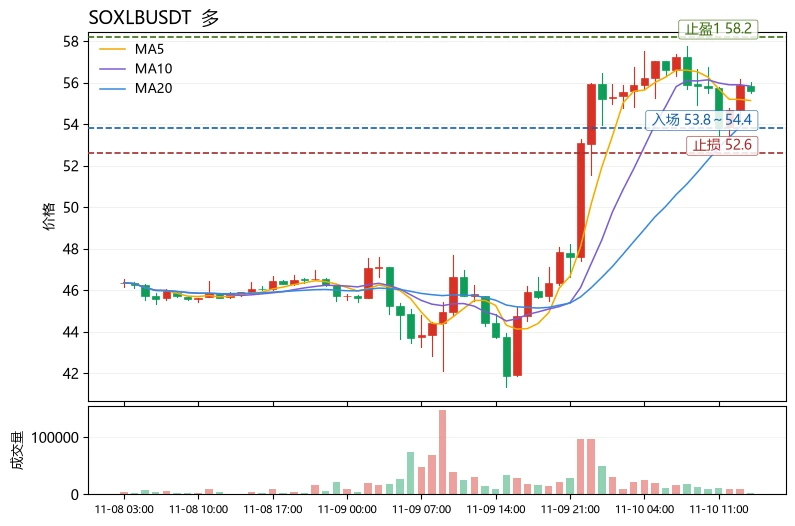
The most unusual detail in today's market is that while $SOXLB$SOXLB surged 25.07% in 24 hours, the MACD histogram remained bearish at -0.2977—the price made a new high, but the momentum indicator did not confirm it. This is a classic “sentiment leads, indicators lag” pattern. The range across 30 candlesticks has already reached 29.58%, with volatility in an extreme range, so the risk-reward ratio for chasing longs has clearly worsened. The Fear and Greed Index is only 32, and the broader market remains fearful, suggesting this rally is driven by localized buying rather than a broad recovery i
post-image
ENA+8.04%
Trenches
牛逼
牛
bade
b
牛逼
0x96...7777
Market Cap
$.
Change
.
24h Vol
$.
Holders
.
PIEVERSE
P
bade
b
PIEVERSE
0x0e...25a9
Market Cap
$.
Change
.
24h Vol
$.
Holders
.
STONK
S
bade
b
STONK
6GmA...UNgx
Market Cap
$.
Change
.
24h Vol
$.
Holders
.
ON
O
bade
b
ON
0x0e...1d48
Market Cap
$.
Change
.
24h Vol
$.
Holders
.
FLOAT
F
bade
b
FLOAT
Bv1a...BMmr
Market Cap
$.
Change
.
24h Vol
$.
Holders
.
Samsung and SK hynix emerge as the day's two top gainers! South Korean stocks stage a 5% comeback—who is the biggest winner?

South Korea's stock market put on a dramatic reversal today. The KOSPI rose more than 5% intraday, Samsung Electronics gained over 5%, and SK hynix climbed even more, with AI semiconductors once again becoming a market favorite.
Why are these two companies so important? Put simply, AI isn't just a chip game; it's also a memory war. As AI models grow larger, demand for data transmission and storage continues to rise, naturally increasing the importance of HBM.
SK hynix h
SPCX+5.90%
BTC | ETH | Gold | Crude Oil
live-cover
LIVE3,200
☀️ GM! Stocks are bouncing. BTC is still waiting. ☕
Nasdaq +2.74% last session, while BTC remains under pressure. US CPI drops at 8:30 AM ET. 👀

📌 Today's topic: CPI — hot or cool?
🔥 Hot: More pressure on BTC and stocks?
🧊 Cool: Could markets bounce?
👀 Your move: Position early or wait for the data?

🎁 Share your CPI outlook on Gate Square. Post to claim a red packet, with bigger rewards dropping at random.
👇 Share your prediction:
https://www.gate.com/post

Gate_Square
☀️ GM! Stocks are bouncing. BTC is still waiting. ☕
Nasdaq +2.74% last session, while BTC remains under pressure. US CPI drops at 8:30 AM ET. 👀

📌 Today's topic: CPI — hot or cool?
🔥 Hot: More pressure on BTC and stocks?
🧊 Cool: Could markets bounce?
👀 Your move: Position early or wait for the data?

🎁 Share your CPI outlook on Gate Square. Post to claim a red packet, with bigger rewards dropping at random.
👇 Share your prediction:
https://www.gate.com/post
repost-content-media
BTC-0.67%
NDAQ+1.29%
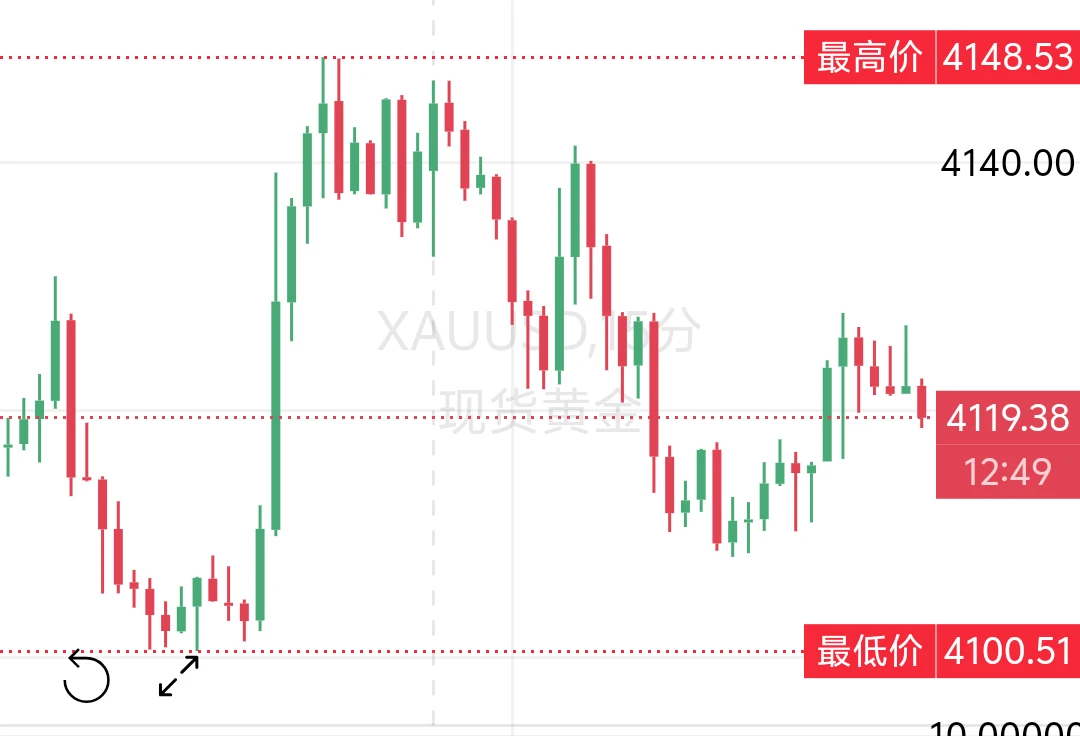
Nov. 10, Monday afternoon: Zhong Ling’s gold outlook

Gold pulled back in the morning, falling steadily from around 4139 at the open to a low of 4108. It is currently fluctuating around 4122, down about $19 from yesterday’s close, a decline of 0.45%.

The chart is clear: resistance around 4146 is indeed strong. After two consecutive attempts to break higher failed, prices naturally came under pressure and pulled back as bulls took profits. This is a normal correction and consolidation after a sharp rally; the broader trend has not turned bearish, and price is simply fluctuating at elevated lev
post-image
XAU+0.38%
BTC-0.65%
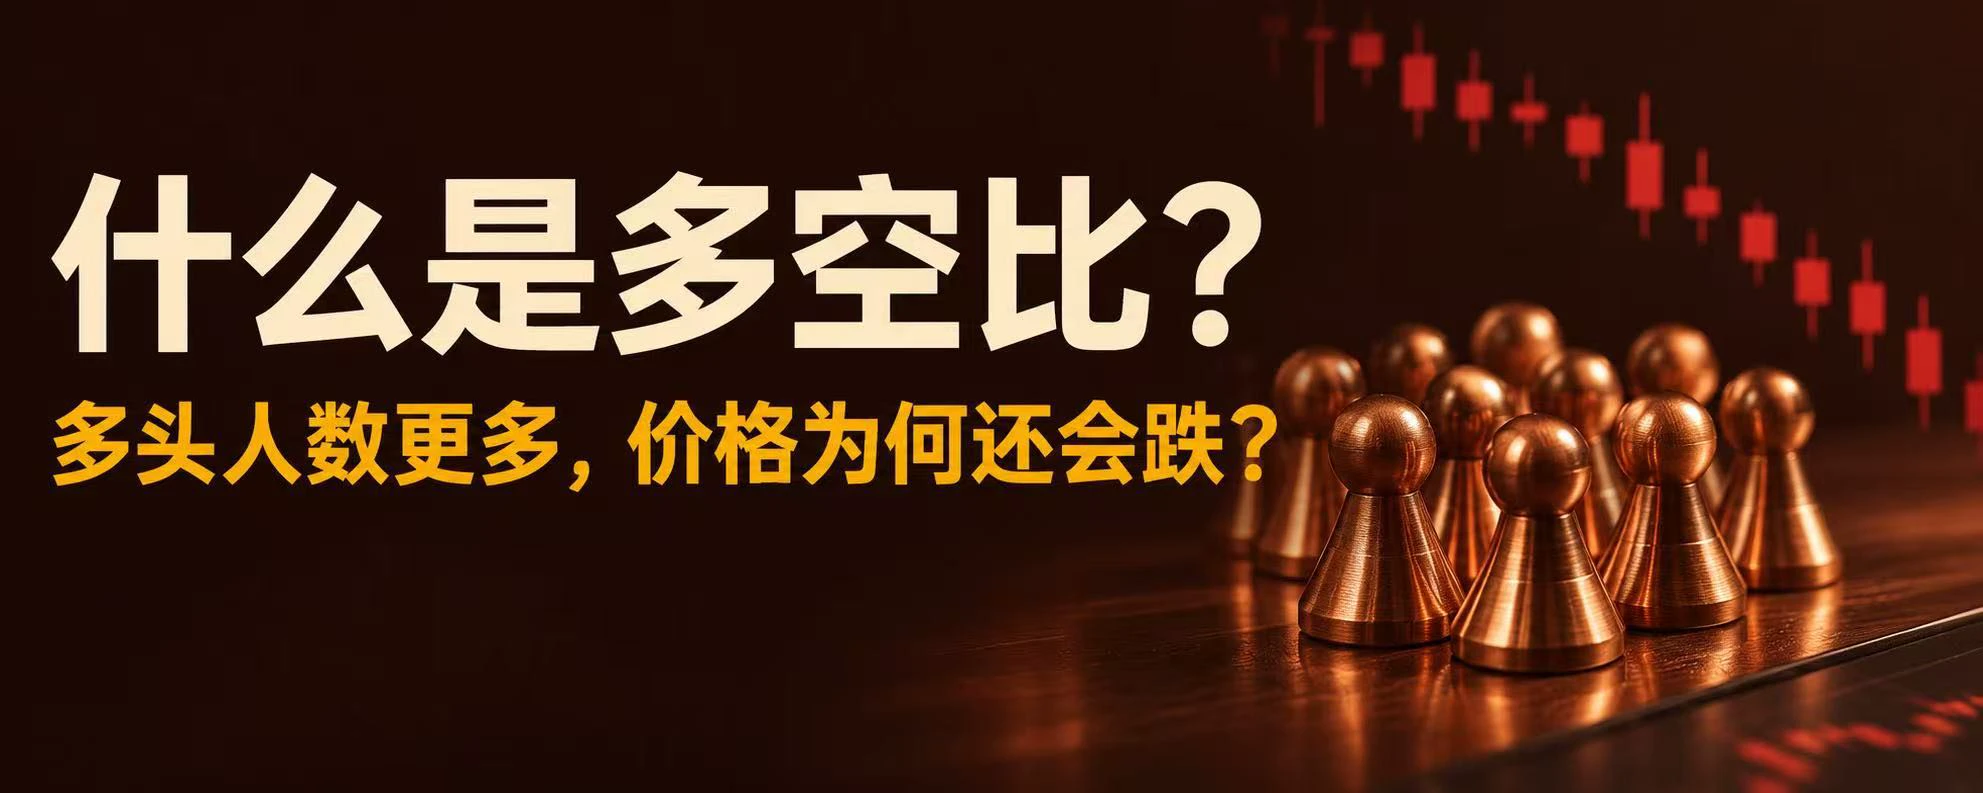
What Is the Long-Short Ratio? Why Can Prices Still Fall When There Are More Longs?

In crypto futures markets, many traders watch the Long-Short Ratio to gauge market sentiment. When data shows significantly more longs than shorts, some believe prices should rise. But that is not necessarily the case, because the Long-Short Ratio reflects the distribution of positions under a specific calculation method, not a definitive direction for future prices.

First, what is the Long-Short Ratio?

The Long-Short Ratio is generally used to compare the number of long and short accounts, the proportion of
post-image
BLSH+2.72%
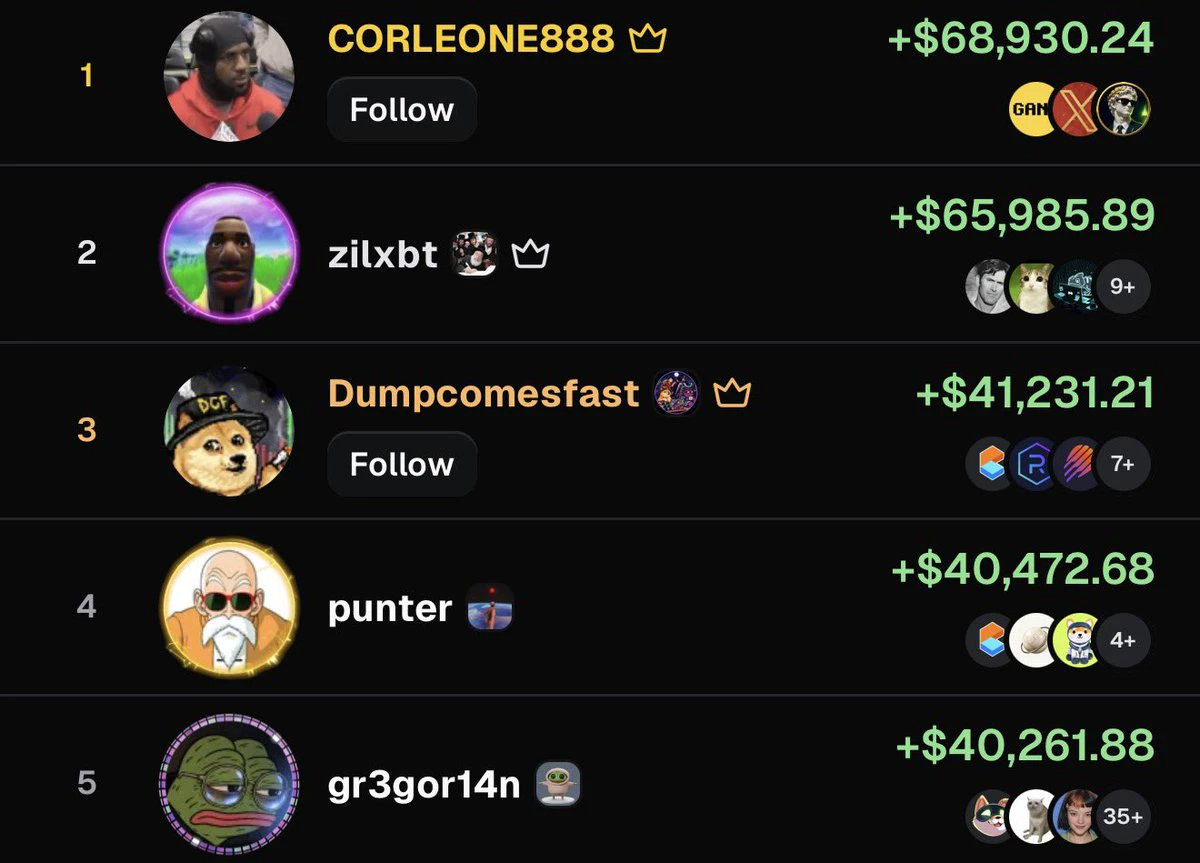
Genuinely curious how these guys are making $30,000+ a day on memecoins.
This market is brutal.
post-image
ON+4.77%
BTC ETH PREDICTION MARKET UPDATE
live-cover
LIVE1,567
Gold Holds Above $4,140 Ahead of CPI; The Key to $4,200 Lies in Core Monthly Inflation

Gold is in a much more comfortable position than BTC right now. Spot gold is near $4,140 per ounce, up nearly 2% on Monday, after briefly hitting a high above $4,134. A weaker dollar and a sharp drop in oil prices, which eased inflation concerns, were the direct catalysts.

Technically, gold is currently rebounding while holding above its 5-day moving average. The upper Bollinger Band region overhead is around $4,200 to $4,220. Whether gold can test this range after tonight’s CPI release depends on where th
MU+6.42%
$UNI ’s price action lately has really been giving “other people’s kid” vibes—when $BTC pulled back, even $HYPE couldn’t hold key support, while UNI stood firm. My view is that once BTC finds a floor and stabilizes, then resumes its main uptrend, UNI will likely have significant upside, and could even outperform HYPE.
Looking at the weekly chart over a longer timeframe, UNI has actually been forming a multi-year flag pattern since its 2021 all-time high. My projection is that it may first pull back toward $4 in the short term, then gradually test $15, $30, $45, and even $50.
If sentiment tur
post-image
UNI+3.05%
BTC-0.67%
HYPE+0.24%
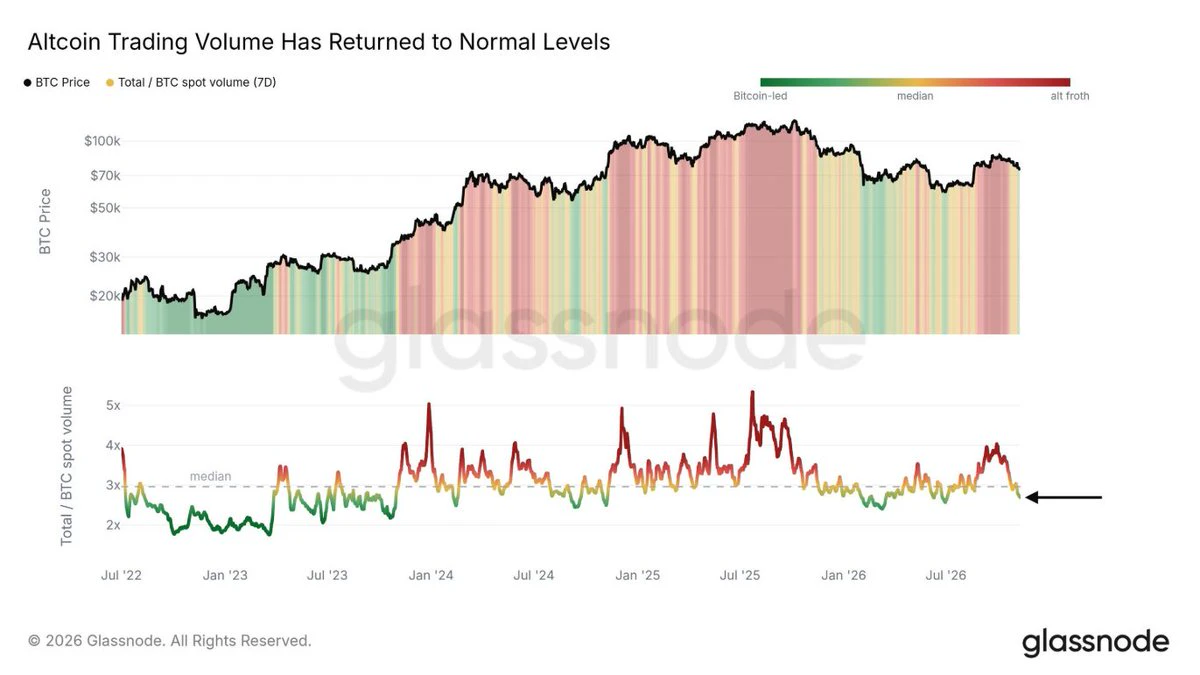
🐋 WHALE WATCH : Classic market cycle mechanics at play
Back in September altcoin volume exploded to 4x BTC volume right as Bitcoin tapped its local top near $87K. Total euphoria.
Fast forward to today: @glassnode data confirms alt volume has cooled back to normal baseline levels.
Historical takeaways:
=> Overheated alt volume = local tops/structural exhaustion
=> Volume normalization = health check&consolidation phase
=> Quiet markets precede major directional moves
Are we prepping for the next leg up or another sweep lower ? Drop your take below
post-image
BTC-0.67%
$AAPLB $NVDA What would happen to Nvidia if Jensen Huang left?
post-image
AAPLB
AAPLBApple
Pump.Fun
MC:$3.12KHolders:1
0%
NVDA-4.34%
#韩股涨超5% #每周来晒 KOSPI surged 5% in a single day, but this is not the start of a “new rally” 🐱

First, a fact that’s been overlooked: this rebound came from a deep hole, not from the foot of a mountain.

On May 11 this year, KOSPI hit a record high of 7,822 points, at one point gaining 85.6% year to date and leading global markets. Before today’s open, the index was just above 5,000 points—down more than 30% from its peak. So today’s big bullish candle is essentially an oversold recovery, not the start of a trend.

What happened today

On November 10, KOSPI opened up 4.55% at 5,247 points, with
SPX+0.33%
NAS100-0.07%
AMD+13.35%
AVGO+8.99%
  • 4
$SNDK Sandisk's long-to-short ratio is terrifying, with a tenfold difference. I bought the dip—isn't it easy for it to get back above 1000?😎
post-image
SNDK+6.27%
  • 1
#SP500PostsBiggestGainIn7Months $SPX $AVGO $MSFTG
S&P 500 Posts Biggest Gain in 7 Months: Is the Market Ready to Recover?

A 2.3% daily gain in the S&P 500 is significant, especially after the heavy selling pressure seen last week. The Nasdaq added around 2.7%, and semiconductor stocks recorded an even stronger recovery.

But I think the most interesting part of this move is not the size of the rally. It is what happened beneath the surface.

Investors were buying across a much wider part of the market, even while one of the biggest names in the AI trade continued to fall. That tells us the r
SPX+0.33%
AVGO+0.32%
MSFTG+0.57%
  • 1
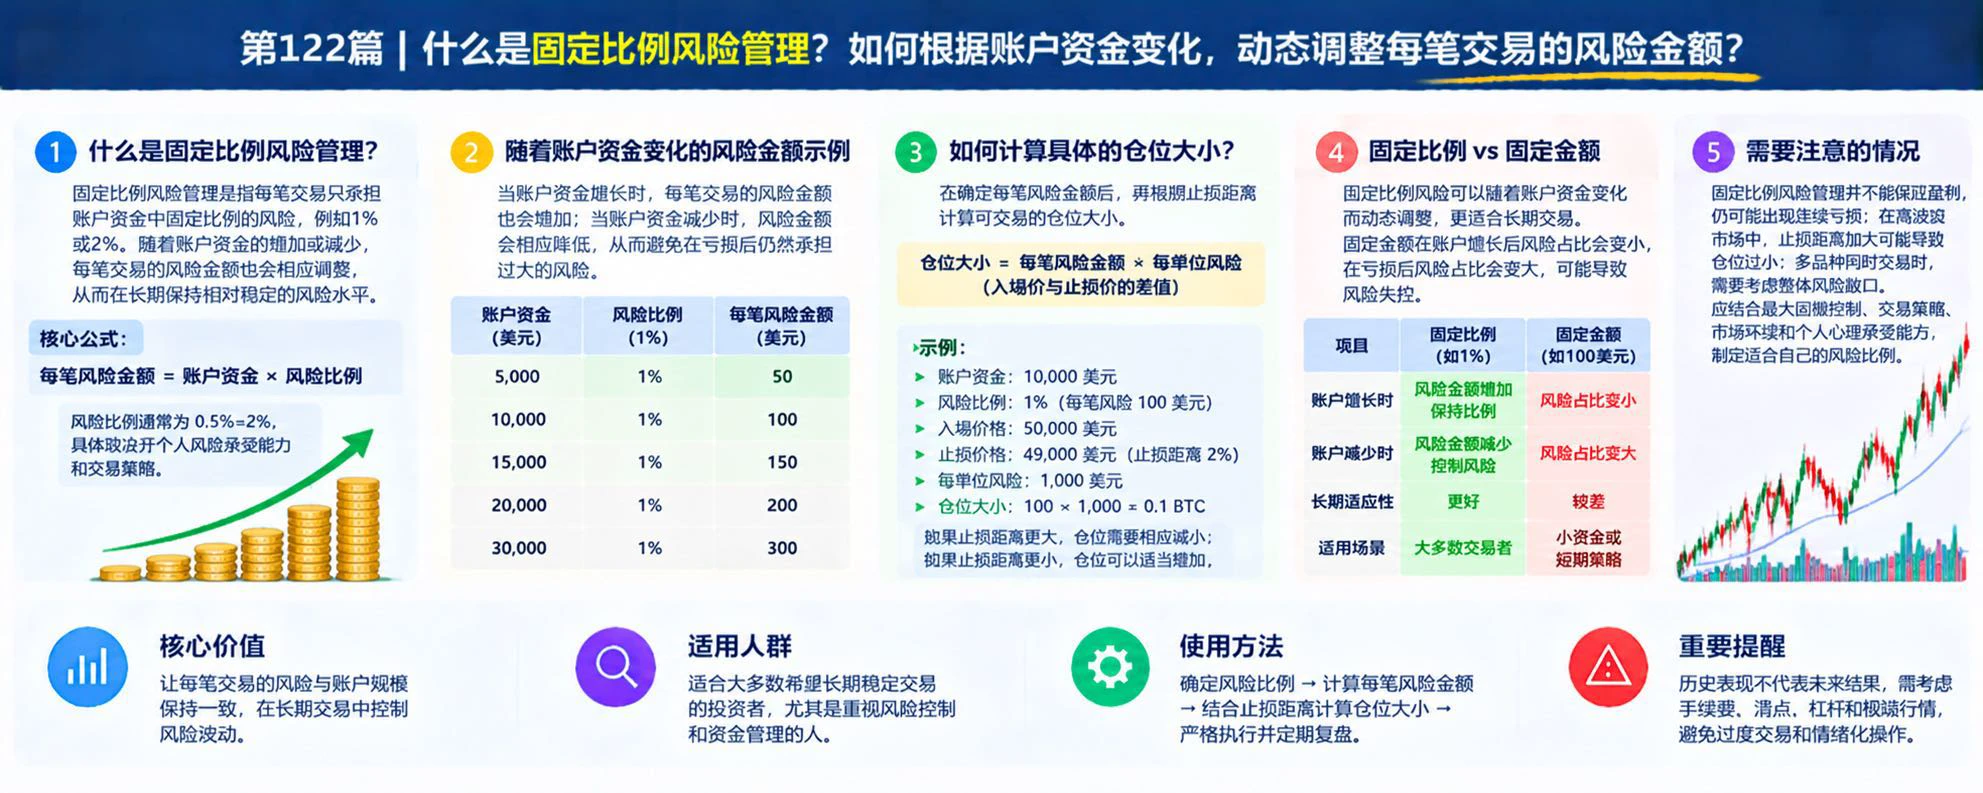
What is fixed-fractional risk management? Why should every trade have a clearly defined loss budget?

In cryptocurrency trading, some people keep increasing their position sizes after a streak of wins, then rush to double down after a streak of losses in hopes of making their money back quickly. This can easily cause account risk to spiral out of control. The core of fixed-fractional risk management is setting a clear risk budget before each trade, rather than deciding on the amount to invest on impulse.

First, what is fixed-fractional risk management?

It generally means that the planned ris
post-image
Samsung is up, and SK hynix is up too! The Korean stock market’s rebound is most at risk not from a drop, but from investors chasing the rally!

The Korean stock market put in an impressive performance today, with the KOSPI up more than 5% intraday. Samsung Electronics and SK hynix were the main drivers of the gains.
But I want to pour a little cold water on excited investors: a sharp rally doesn’t mean there’s no risk, especially after the extreme volatility seen earlier.
This rebound was mainly driven by a recovery in U.S. semiconductor stocks, bargain hunting, and an improvement in risk app
SNDK+6.27%
What Is Forced Liquidation? Why Might Leveraged Traders Be Forced Out Before a Price Rebound?

In crypto futures trading, some traders correctly predict the eventual direction but still exit at a loss. This may happen because, before reversing, the price first reaches a risk threshold the account cannot withstand, triggering the platform to forcibly close the position.

First, what is forced liquidation?

Forced liquidation occurs when a margin account no longer meets the platform’s maintenance margin requirements, and the trading platform closes part or all of the position according to its ru
post-image
Nuke the chain bro wtf 😭
post-image
Load More

Join 40 M users in our growing community

⚡️ Join 40 M users in the crypto craze discussion

💬 Engage with your favorite top creators

👍 See what interests you

Trending Topics

USCPIDataIncoming

51.68k Views2.23k Discussing

The U.S. October CPI report will be released on November 10 at 8:30 a.m. ET. September CPI came in at 3.7% year over year, and markets will be watching closely for signs that inflation is cooling, especially in core CPI. A softer-than-expected reading could strengthen rate-cut expectations, while hotter inflation may pressure risk assets through higher Treasury yields and a stronger dollar. How do you think this CPI print will move $BTC, U.S. stocks and gold?

USIranTalksShowNewProgress

7.75k Views1.27k Discussing

KoreanStocksJumpOver5%

4.22k Views4.88k Discussing

View More