Square
Following
Hot
News
Notifications
Profile
Share your thoughts
placeholder
Article
$ETH I’ve seen enough of this act. Damn market makers, quit playing coy—if you want to dump the market, just do it. Stop dragging it out. $ZEC I placed two short orders at 865 and have been holding on for over three months. Now I’m less than 200 points away from breaking even. Could you give me one big bearish candle so I can turn things around? Only those who’ve been stuck in a losing position know how it feels. As long as we don’t get another big rebound, I can live with anything. (The above is solely my personal opinion and does not constitute investment advice. Please assess market risks
post-image
ETH-1.26%
ZEC+1.16%
📣 Gate Square Daily Standouts: November 10
Can BTC hold support, and can the stock rally last? Four creators explore the signals worth watching 👇

🔹 @TheBuzzingBee
BTC support, momentum and rebound scenarios.
🔹 @discovery
S&P 500 market breadth: does the rally have staying power?
🔹 @HighAmbition
KOSPI’s chip leaders, investor flows and participation beyond semiconductors.
🔹 @asiftahsin
BTC’s EMA and Fibonacci resistance: what needs to improve for a stronger recovery?

💬 Which take would you challenge—and why?
Read the posts and join the discussion on Gate Square👇
https://www.gate.com/p
Gate_Square
📣 Gate Square Daily Standouts: November 10
Can BTC hold support, and can the stock rally last? Four creators explore the signals worth watching 👇

🔹 @TheBuzzingBee
BTC support, momentum and rebound scenarios.
🔹 @discovery
S&P 500 market breadth: does the rally have staying power?
🔹 @HighAmbition
KOSPI’s chip leaders, investor flows and participation beyond semiconductors.
🔹 @asiftahsin
BTC’s EMA and Fibonacci resistance: what needs to improve for a stronger recovery?

💬 Which take would you challenge—and why?
Read the posts and join the discussion on Gate Square👇
https://www.gate.com/post
🎁 Selected creators get a 3-day traffic boost + featured placement.
Share your own insights. Your next post could be featured.
Authors’ views. Not investment advice.

repost-content-media
GT-2.41%
SOL-0.77%
Trenches
PIEVERSE
P
bade
b
PIEVERSE
0x0e...25a9
Market Cap
$.
Change
.
24h Vol
$.
Holders
.
X
X
bade
b
X
9VZe...pump
Market Cap
$.
Change
.
24h Vol
$.
Holders
.
牛逼
牛
bade
b
牛逼
0x96...7777
Market Cap
$.
Change
.
24h Vol
$.
Holders
.
DacityCoin
D
bade
b
DacityCoin
DKYc...pump
Market Cap
$.
Change
.
24h Vol
$.
Holders
.
DESSA
D
bade
b
DESSA
npz2...pump
Market Cap
$.
Change
.
24h Vol
$.
Holders
.
$PYTH — Short entry: 0.06440 Take-profit 1: 0.06310 Take-profit 2: 0.06150 Stop-loss: 0.06650 Recent attempts to push higher have all failed to form a sustained breakout. PYTH remains vulnerable to weakness while trading below the 0.0665 supply zone.
post-image
PYTH+3.23%
CPI data came in hot: +0.4% month over month, above the expected 0.3%; core CPI also exceeded expectations at +0.3%, versus 0.2% expected—exactly hitting the 50-basis-point rate hike threshold Waller had previously set.
The latest CME FedWatch pricing shows a December rate hike is virtually certain, with the probability nearing 100% (25 basis points at 89%, 50 basis points at 11%), up sharply from 76% last Friday.
$BTC rebounded after plunging from 74.8K to 72.7K; $ETH recovered to 2057 after testing the 2000 level. Two hours remain before the daily close. Not investment advice.
Is this a re
post-image
BTC-0.67%
ETH-1.26%
#BTC
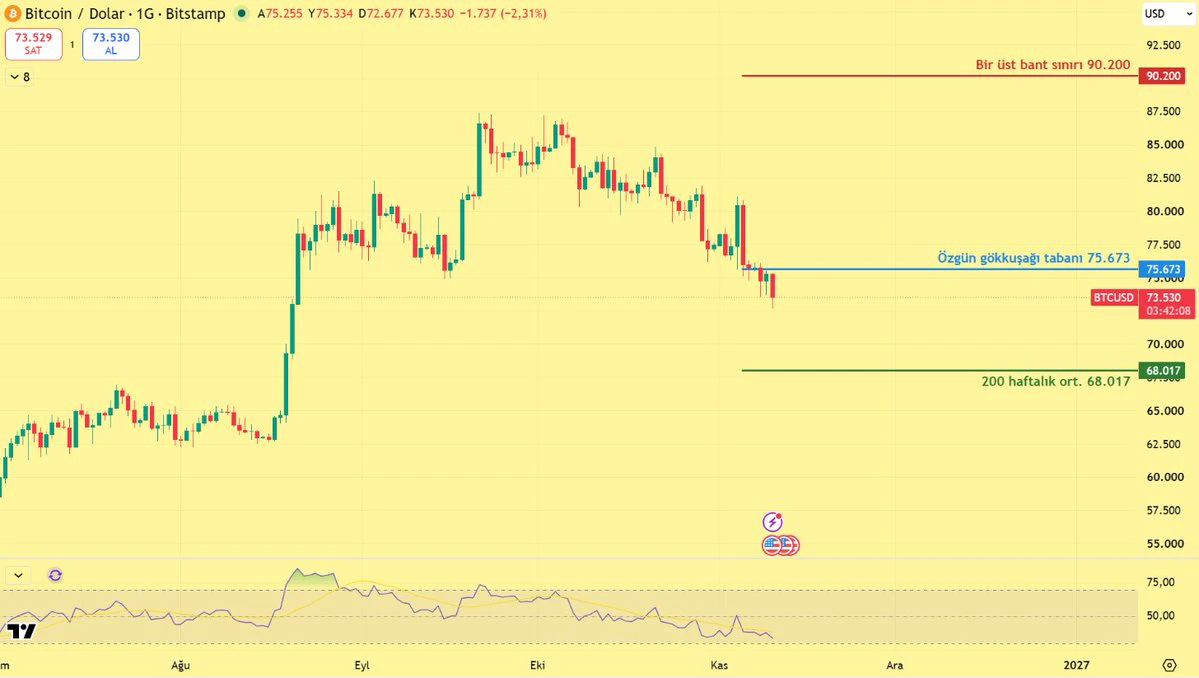
The lowest band on the Rainbow Chart.
Folks, Bitcoin $BTC is trading in the lowest band of the long-term Rainbow Chart.
In Blockchaincenter's current model, the price has been in the lowest "fire sale" band for 50 days. It would take a rise of approximately 23%, to around 90,200, to move into the next band. The price is 68% below the model's midline.
In the original Rainbow Chart, the floor of the lowest band is at 75,673. The price is also about 3% below that floor, meaning it has moved outside the chart.
The Rainbow Chart is not a price prediction, but a curve fitted to historical price
post-image
BTC-0.67%
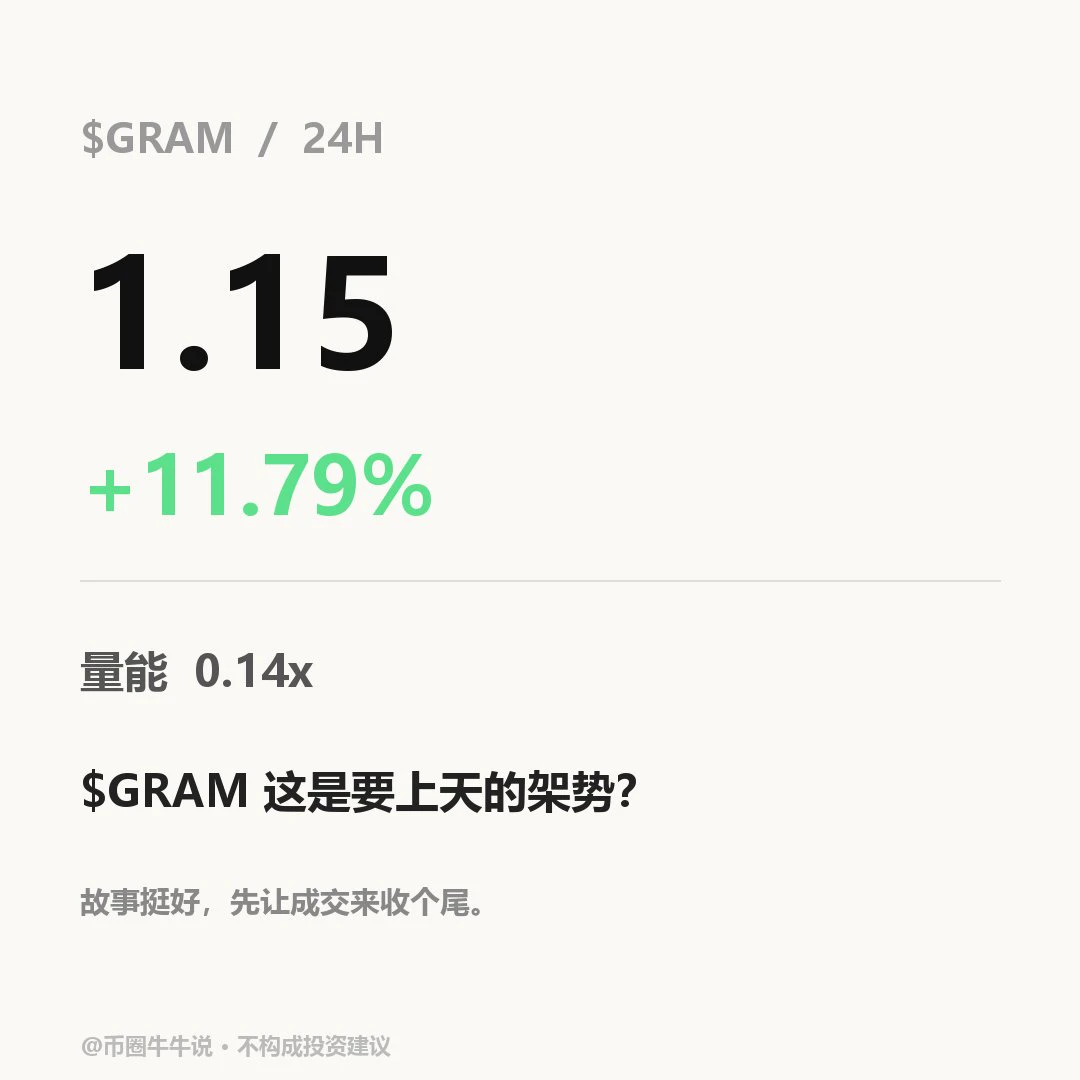
the-open-network:native is currently trading at 1.147, up 11.79% over 24H. The 1H trend is bullish, with EMA20 at 1.102 and RSI at 67; resistance is at 1.161 and support at 1.03. The 4H trend is bullish, with EMA20 at 1.080 and RSI at 67; resistance is at 1.161 and support at 0.992. Trading volume is only 0.14x the average. If the price holds above 1.161, watch for further upside; a break below 1.03 would weaken the short-term outlook. In the next review, watch whether the price can hold above 1.161 and reclaim 1.03 if it breaks below; the 0.14x volume still needs confirmation. Market volatili
post-image
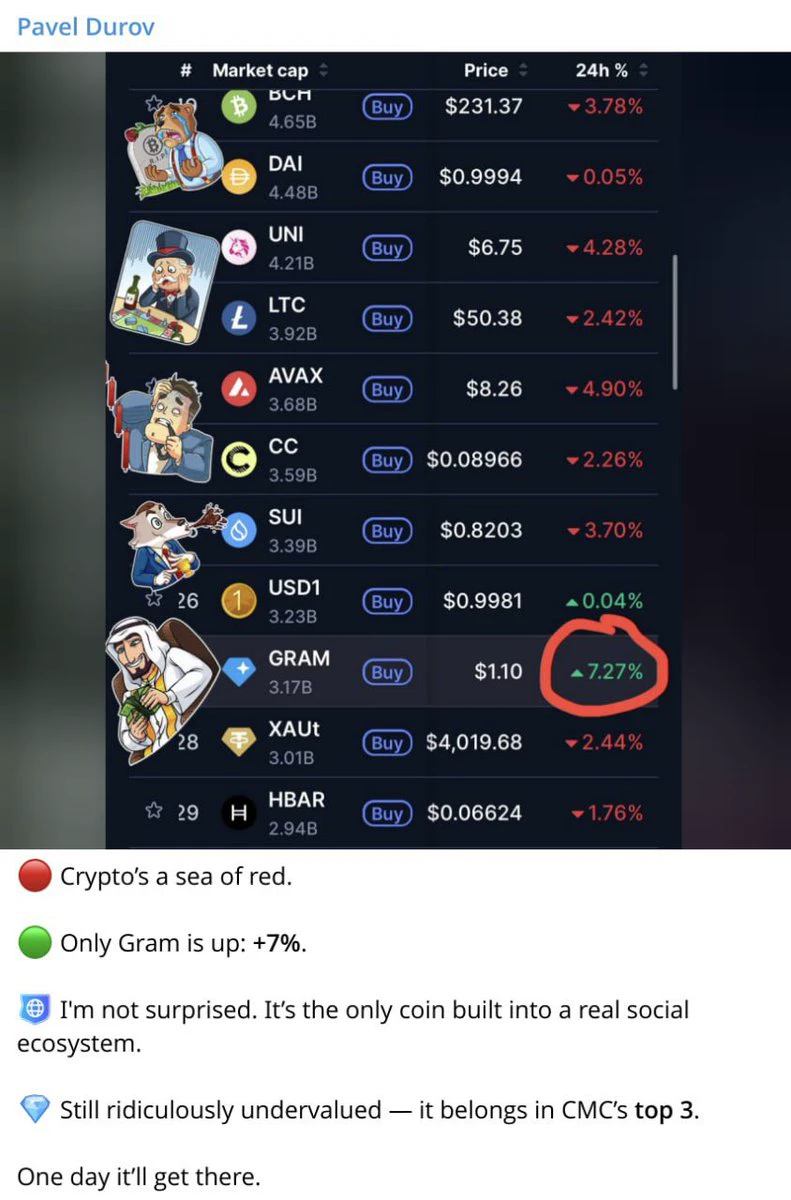
Hahahaha, all facts!
The entire crypto market is falling, but $GRAM is rising!
We’re going to make it to the top 3 on CoinMarketCap.
Well, isn't Durov right?
post-image
GRAM-0.97%
$INIT I chased in at $0.19 and didn’t sell at $0.29; now I’m sitting at 0.228 taking a beating. The 24h high was 0.303 and the low was 0.159, with the range nearly doubling; trading volume was 1.2 billion—that turnover rate clearly points to a sentiment-driven market, not a trend-driven one. I reviewed the last bull market: in weeks 5–7 after the halving, altcoins collectively saw sharp wick-down shakeouts, just like today’s upper wick on $INIT: a 21% pump to attract chasers, then a pullback to confirm support. There’s just one lesson: on a high-volume wick day like this, I’d rather wait for a
INIT-2.53%
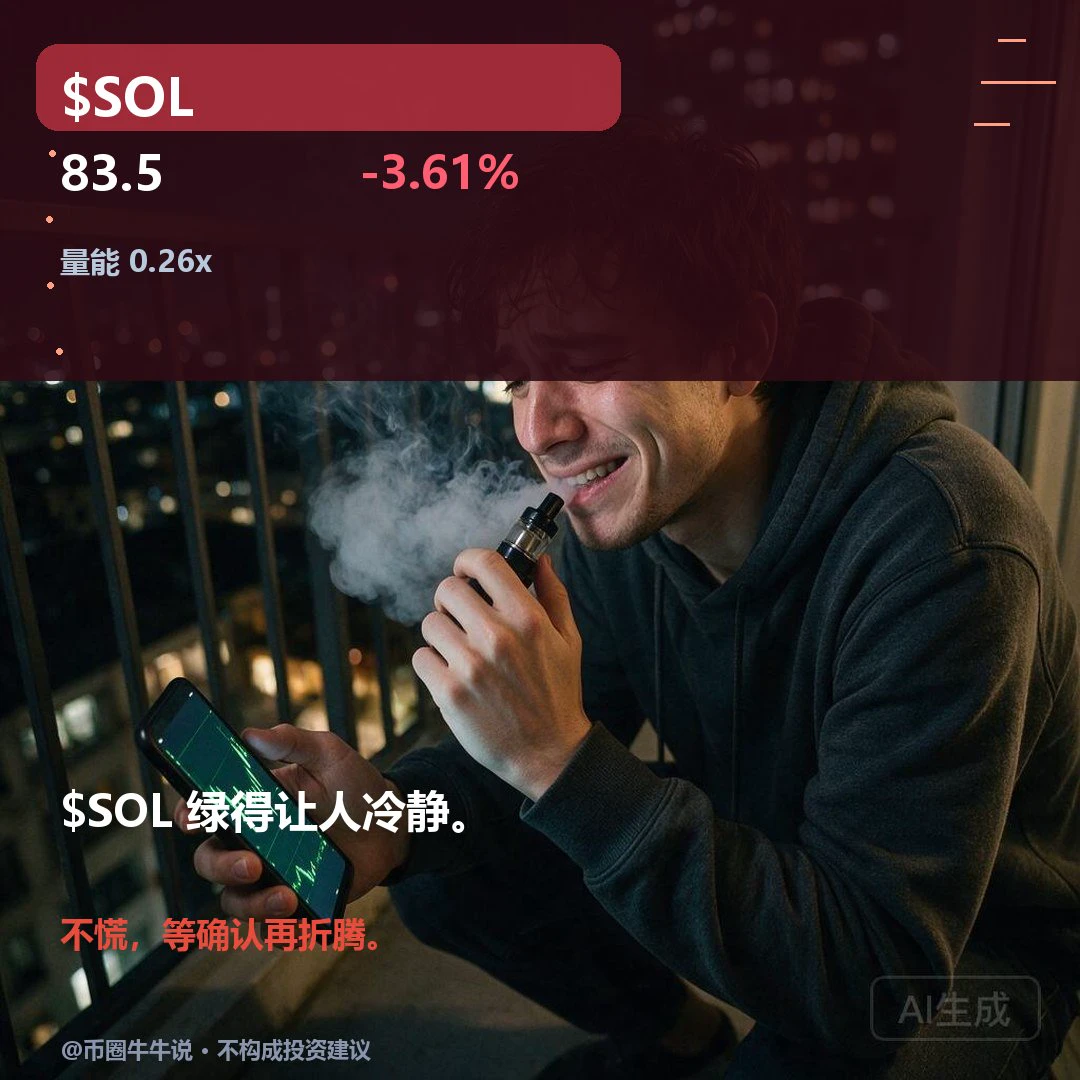
$SOL Currently at 83.5, down 3.61% over 24H. The 1H trend is weak, with EMA20 at 84.2, RSI at 32, and resistance at 87.03; the 4H trend is weak, with EMA20 at 86.5, RSI at 31, resistance at 90.67, and support at 81.34. Volume is only 0.26x the average. If price holds above 87.03, a rebound may be worth watching; a break below 81.34 would signal short-term weakness. In the follow-up review, watch whether 87.03 holds and whether price can recover after losing 81.34; volume at 0.26x the average still needs confirmation. Market volatility is high; for observation only.
post-image
SOL-0.77%
It simply won't stop.
Stablecoins moved a record $18.62B on Stellar in October, 9.4 times the $1.98B of October 2025.
It was the eighth straight monthly high.
That is more than $600M a day.
@StellarOrg
XLM-0.64%
BlackRock's iShares 0-1 Year Treasury Bond ETF, tokenized by Ondo on Solana, is now worth $423,586,289, up 64.39% in the past 30 days.
It held $8,325,830 just 90 days ago, and took in $88,211,369 of net inflows in the past 7 days alone.
@BlackRock @Ondo @solana
BLK+0.42%
ONDO-0.29%
SOL-0.77%
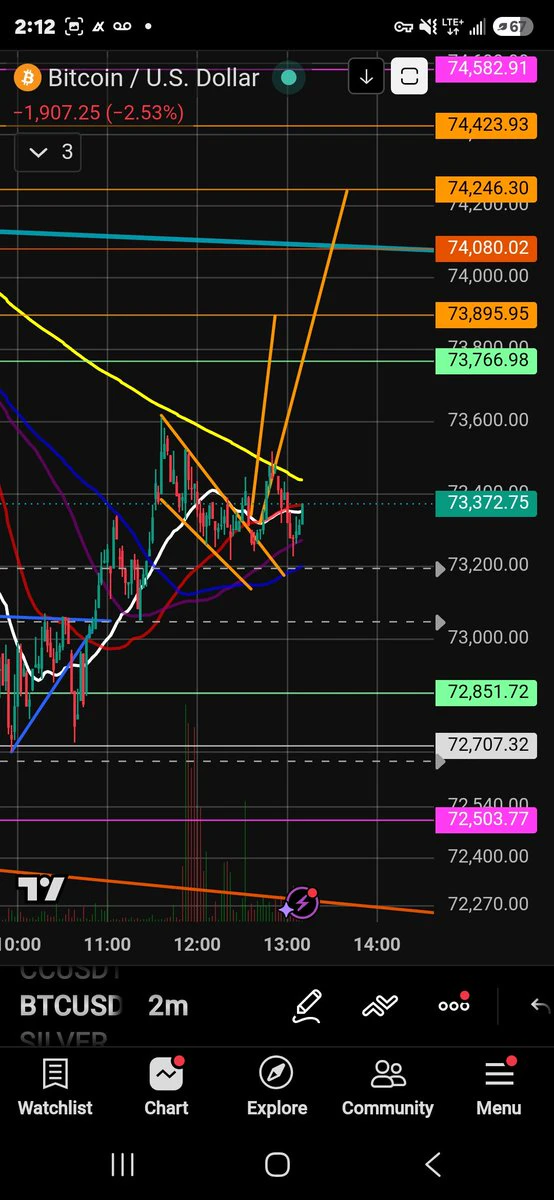
Now we want to breakout above the 2 min 200MA.
post-image
📈 AI Stocks Rally: Who Will Lead the Next Wave?
After a volatile week, AI stocks like $NVDA and $AMD have bounced back from sharp pullbacks.
Will the rally continue, or is another correction ahead?

💬 Today's discussion:
If you had to pick one AI stock, which would it be? Share your pick and tell us why.

🌟 Gate Square Stock Talk Season is live
Each day, 3 outstanding creators receive 5 USDT + an official feature, giving their insights more exposure.

Post your original take with #GateStockTalkSeason and share your market outlook 👇
👉 Register Now:
https://www.gate.com/campaigns/6898$GT ‌
Gate_Square
📈 AI Stocks Rally: Who Will Lead the Next Wave?
After a volatile week, AI stocks like $NVDA and $AMD have bounced back from sharp pullbacks.
Will the rally continue, or is another correction ahead?

💬 Today's discussion:
If you had to pick one AI stock, which would it be? Share your pick and tell us why.

🌟 Gate Square Stock Talk Season is live
Each day, 3 outstanding creators receive 5 USDT + an official feature, giving their insights more exposure.

Post your original take with #GateStockTalkSeason and share your market outlook 👇
👉 Register Now:
https://www.gate.com/campaigns/6898
repost-content-media
GT-2.41%
BTC-0.67%
BTC market update
live-cover
LIVE1,732
Kidly send me followers red packet arrange a time 60 minut in my live streaming i am starting the
live-cover
LIVE46
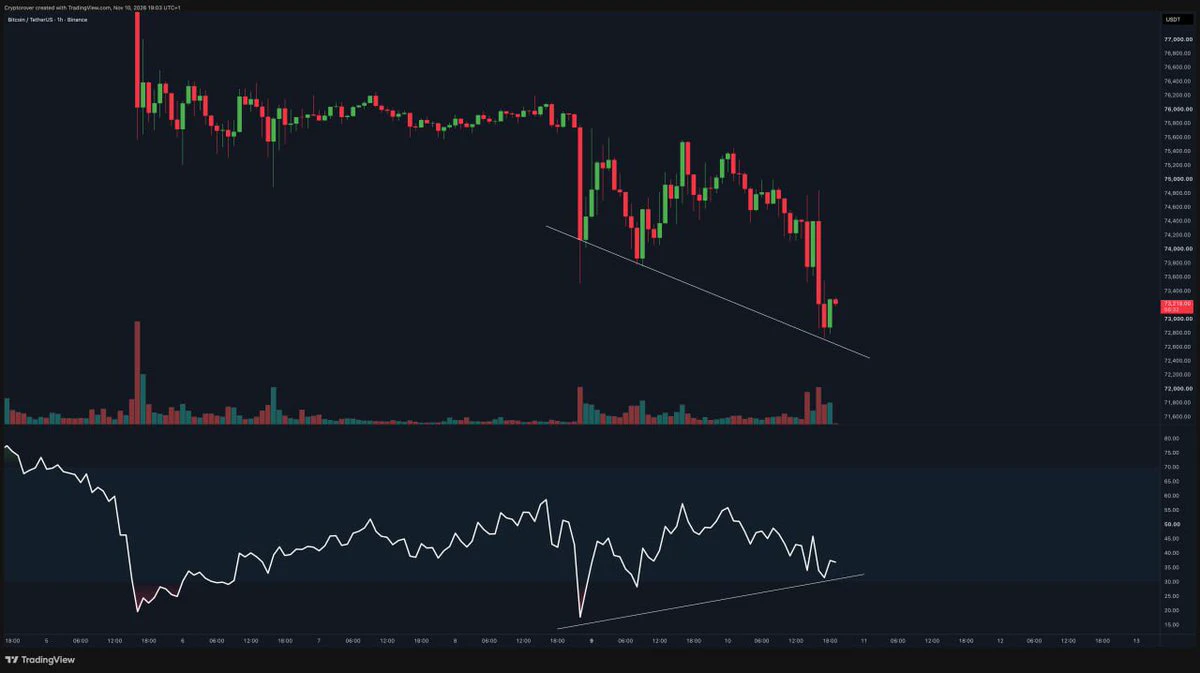
👀🚨 A BULLISH DIVERGENCE IS FORMING ON $BTC !
BITCOIN COULD BE PREPARING FOR A MAJOR REVERSAL! 📈🔥
THE NEXT BIG MOVE MIGHT BE CLOSER THAN WE THINK. 🚀
ARE YOU READY? 💎
post-image
BTC-0.67%
#GateGlobalComplianceExpansion

🌍 One map. Gate’s global compliance footprint.

From Europe to Asia, North America to Oceania

$BTC $GT $ETH $SOL $XRP
post-image
BTC-0.67%
GT-2.41%
ETH-1.26%
SOL-0.77%
XRP-1.15%
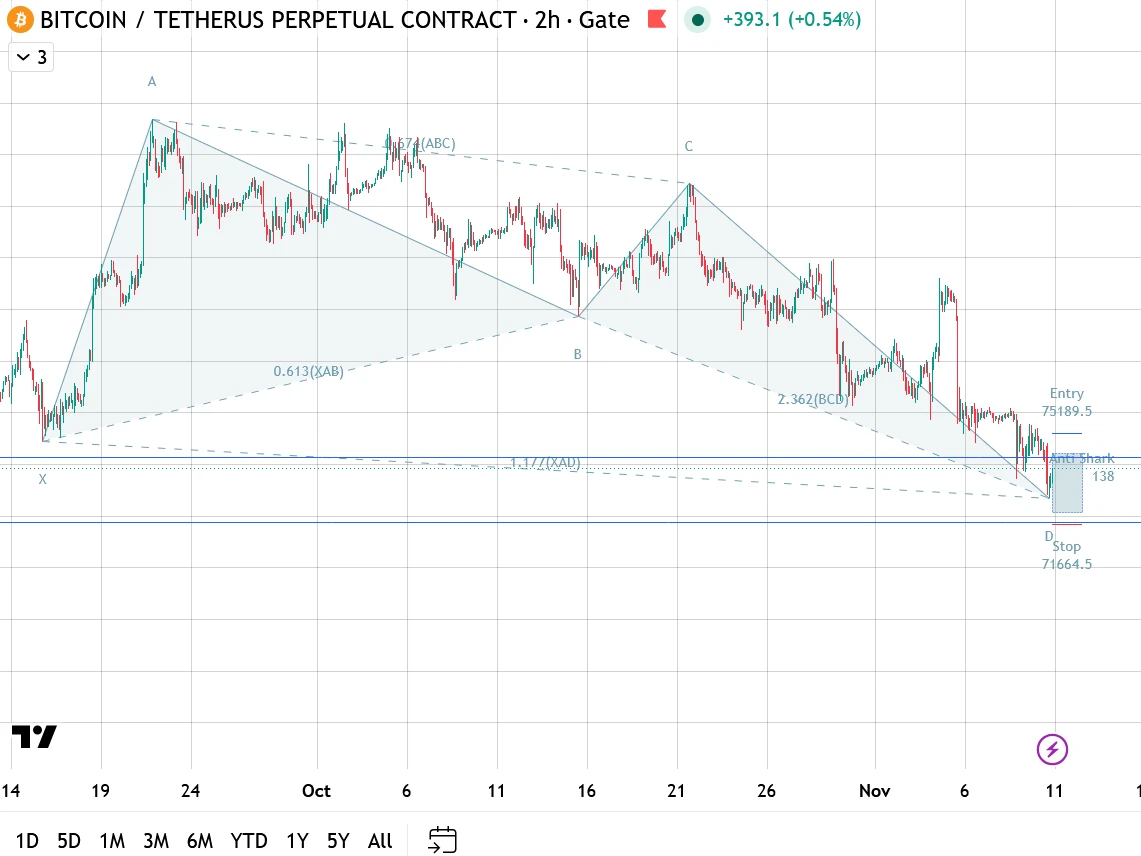
Long from below 73,000; currently at 73,700, already up 1,800 points!
$BTC Bullish market opportunity after this pattern is formed in 2h chart.

As soon as it goes to the 👉entry point 75189 USD, a big opportunity is ahead.

Follow Gate's top traders effortlessly and earn passive income! Advanced risk control mechanisms and a track record of performance. Copy trading profits 9.05M+
Follow
https://www.gate.com/en/copytrading/trader/futures/34816?ref=UVFGUgtX&ref_type=117
post-image
BTC-0.65%
The Bull Run Is Coming. 🚀🔥

$BTC $ETH $PI
BTC-0.67%
ETH-1.26%
PI-0.60%
Load More

Join 40 M users in our growing community

⚡️ Join 40 M users in the crypto craze discussion

💬 Engage with your favorite top creators

👍 See what interests you

Trending Topics

GateGlobalComplianceExpansion

9.31k Views262 Discussing

Gate continues to expand its global compliance footprint, now covering 81 regulated jurisdictions across Europe, North America, Asia, and Oceania. From MiCA and U.S. state-level MTLs to Japan’s FSA, Dubai, and Australia-related regulatory approvals, global exchanges are entering a new stage of compliance competition. Do you think regulatory strength will become as important as products and liquidity for exchanges in the future?

USCPIDataIncoming

71.36k Views2.4k Discussing

USIranTalksShowNewProgress

18.12k Views1.33k Discussing

View More