
Square
Following
Hot
News
Notifications
Profile
Share your thoughts
placeholder
Article
$TRADOOR ‌Tradoor is on its way to the moon 🚀🚀🚀💥
post-image
TRADOOR-1.11%
MARKET OVERVIEW
live-cover
LIVE61
Trenches
ZIG
Z
bade
b
ZIG
0x8c...1145
Market Cap
$.
Change
.
24h Vol
$.
Holders
.
STONK
S
bade
b
STONK
6GmA...UNgx
Market Cap
$.
Change
.
24h Vol
$.
Holders
.
BTC
B
bade
b
BTC
C5xp...pump
Market Cap
$.
Change
.
24h Vol
$.
Holders
.
MAGGIE
M
bade
b
MAGGIE
8rHo...PmZV
Market Cap
$.
Change
.
24h Vol
$.
Holders
.
CLAUDIA
C
bade
b
CLAUDIA
2j5S...W2ZM
Market Cap
$.
Change
.
24h Vol
$.
Holders
.
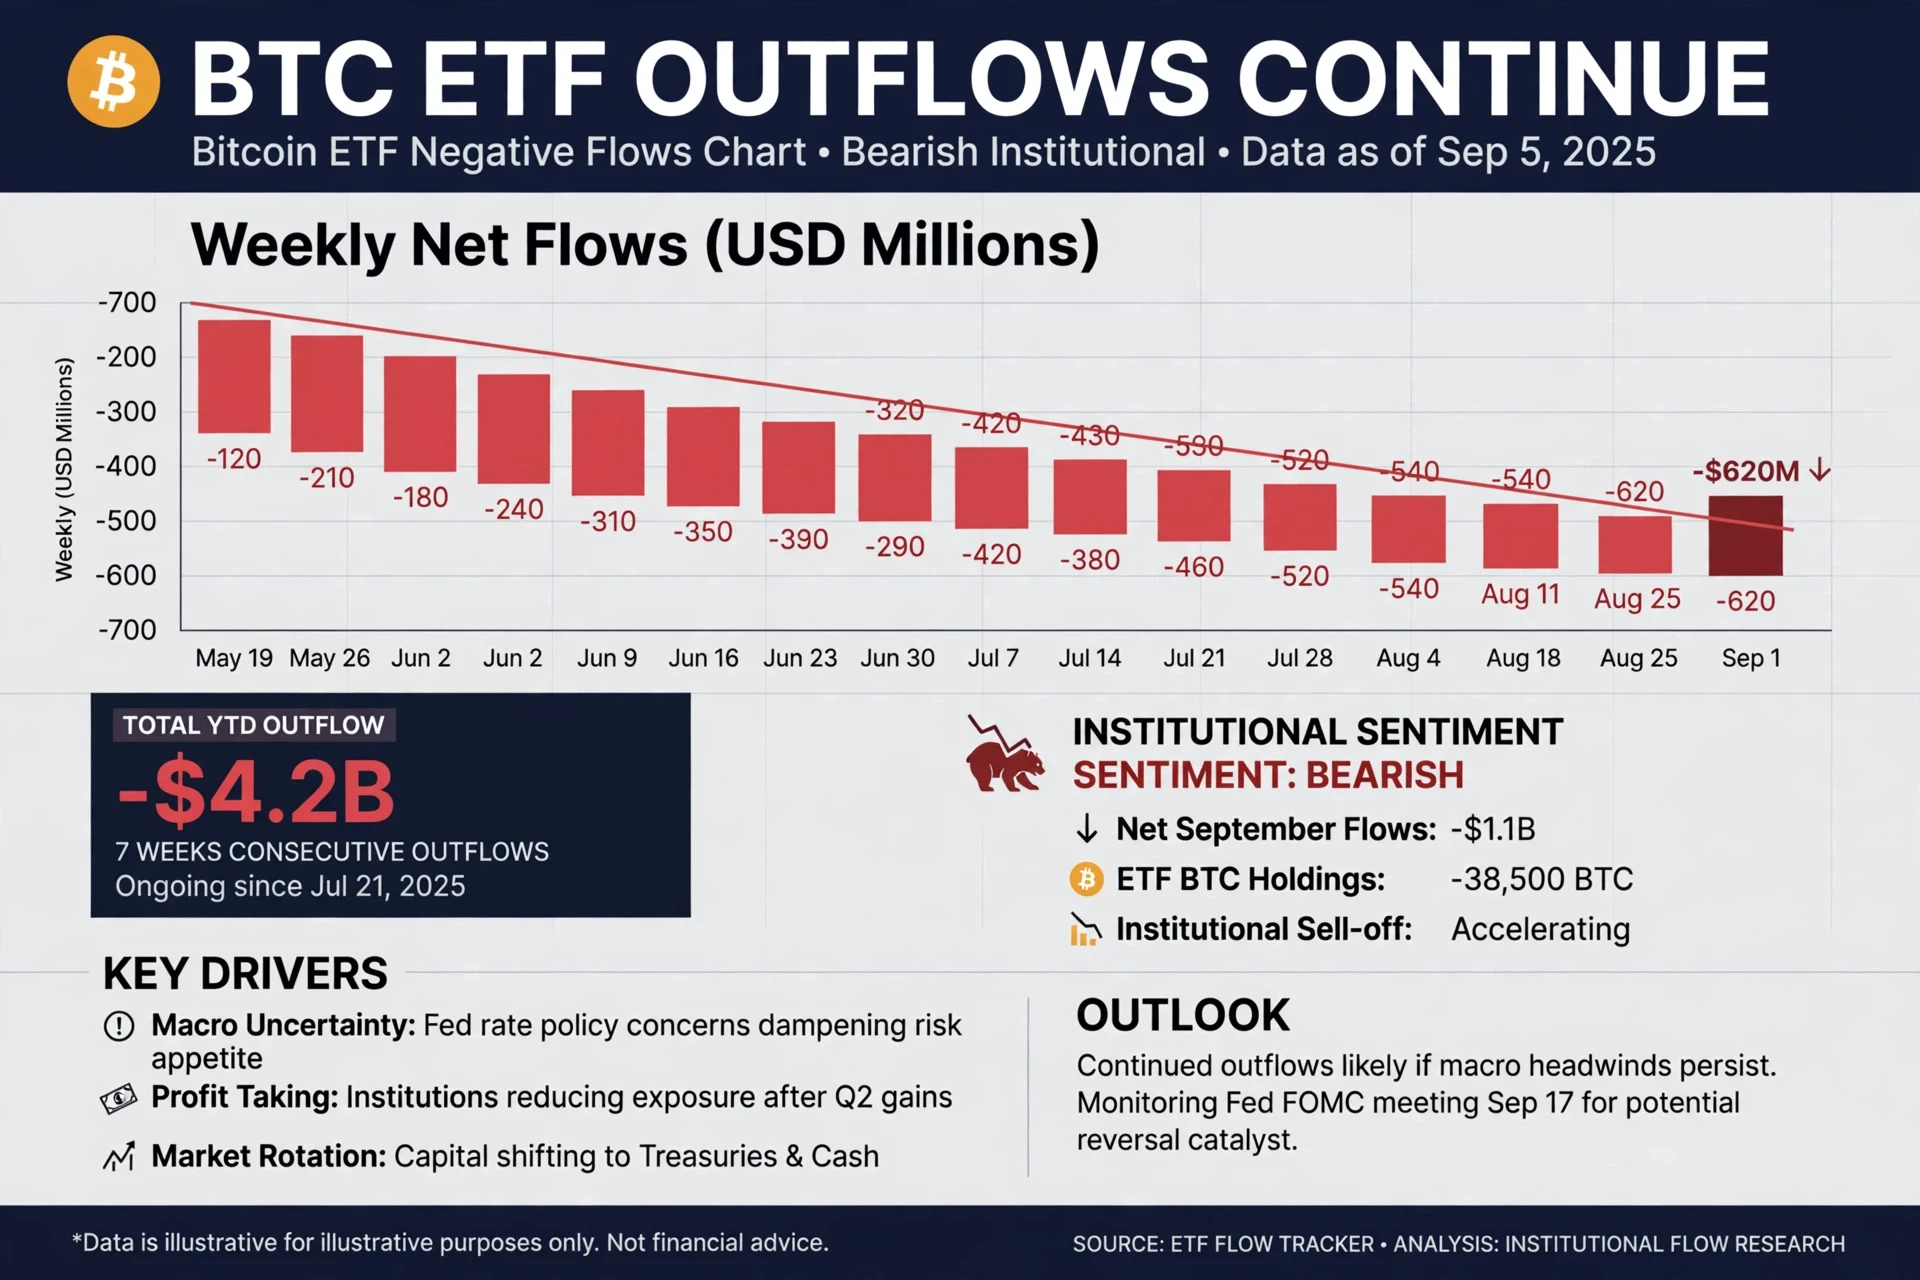
*#BTCETFOutflowsContinue — Institutional Selling Accelerates*

Bitcoin ETFs are under sustained pressure with *7 consecutive weeks of outflows*. YTD total outflow now *-$4.2B*, with latest weekly print at *-$620M* — the largest since July.

September alone saw *-$1.1B* net, with ETF BTC holdings down *-38,500 BTC*. Institutional sentiment has flipped to *Bearish*.

*Key Drivers:*
- Macro Uncertainty: Fed rate policy dampening risk appetite
- Profit Taking: Institutions trimming exposure after Q2 gains
- Market Rotation: Capital shifting to Treasuries & cash

*Outlook:* Continued outflows lik
post-image
BTC-0.31%
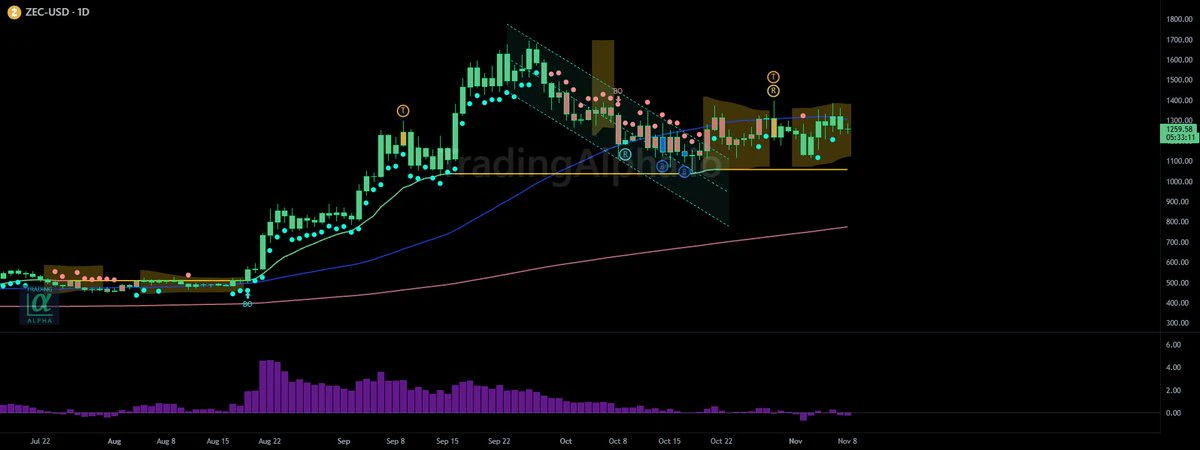
$ZEC moving sideways still, but holding all of that pressure, as well, too. Weekly looks great still, as well.
post-image
ZEC+1.16%
$RSR Price is currently 0.0017, up 10.65% over 24 hours, with trading volume surging to 32M—amid the recent low-volume sideways action among small-cap coins, that kind of volume suggests someone got positioned early.
Let’s pin down the timing: we’re in a high-level consolidation after an intraday rally, less than 6% below the 24-hour high of 0.0018. This is the most nerve-racking spot: chase it and you risk getting stuck at the top; sit it out and you risk missing the move. From my screen-watching experience, after a 10% gain, if volume hasn’t dried up and price is holding near the previous hi
RSR-1.93%
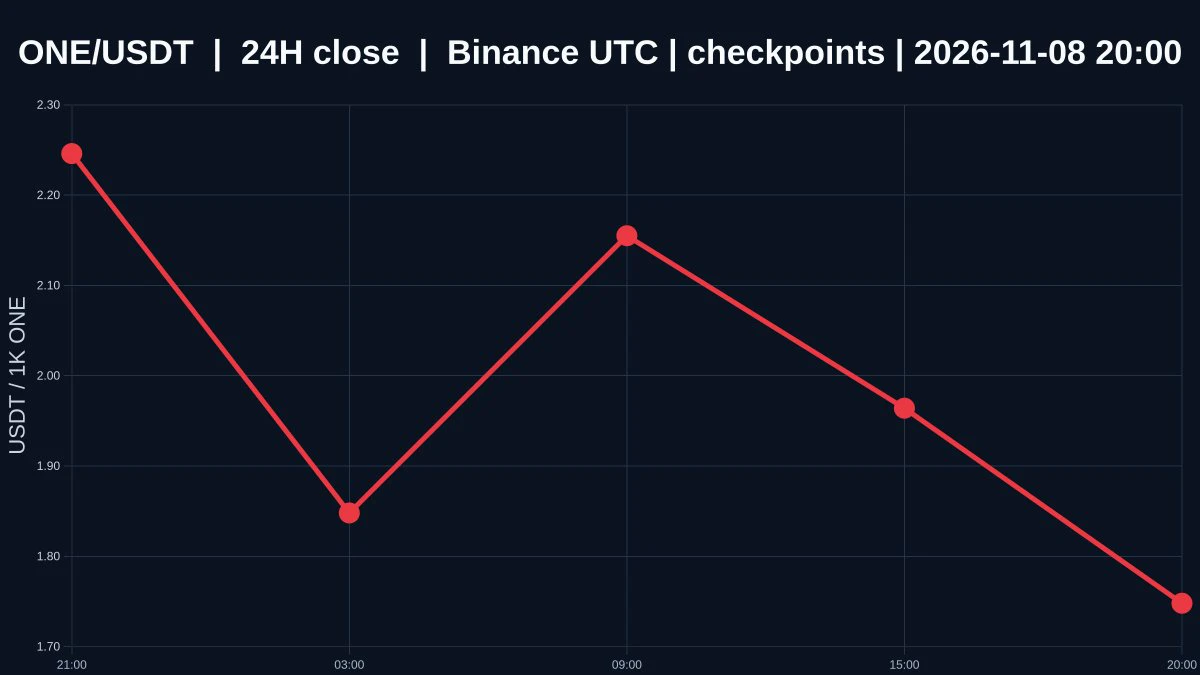
What’s easiest to misread when $ONE’s two time frames haven’t aligned yet?

$ONE is currently priced at 0.001748, down 26.77% over 24 hours, with an intraday high of 0.00243 and a low of 0.001692. The 1-hour trend is weak, while the 4-hour trend is strong. The volume ratio is 0.10325723931514065. The two time frames point in opposite directions, so the trend has yet to be confirmed.

At 0.001748, the price is only 0.000056 above the 1-hour support at 0.001692, but 0.000682 below resistance at 0.00243. This puts it clearly closer to support. Whether support at 0.001692 holds depends on whether
post-image
Today Market Update
live-cover
LIVE35
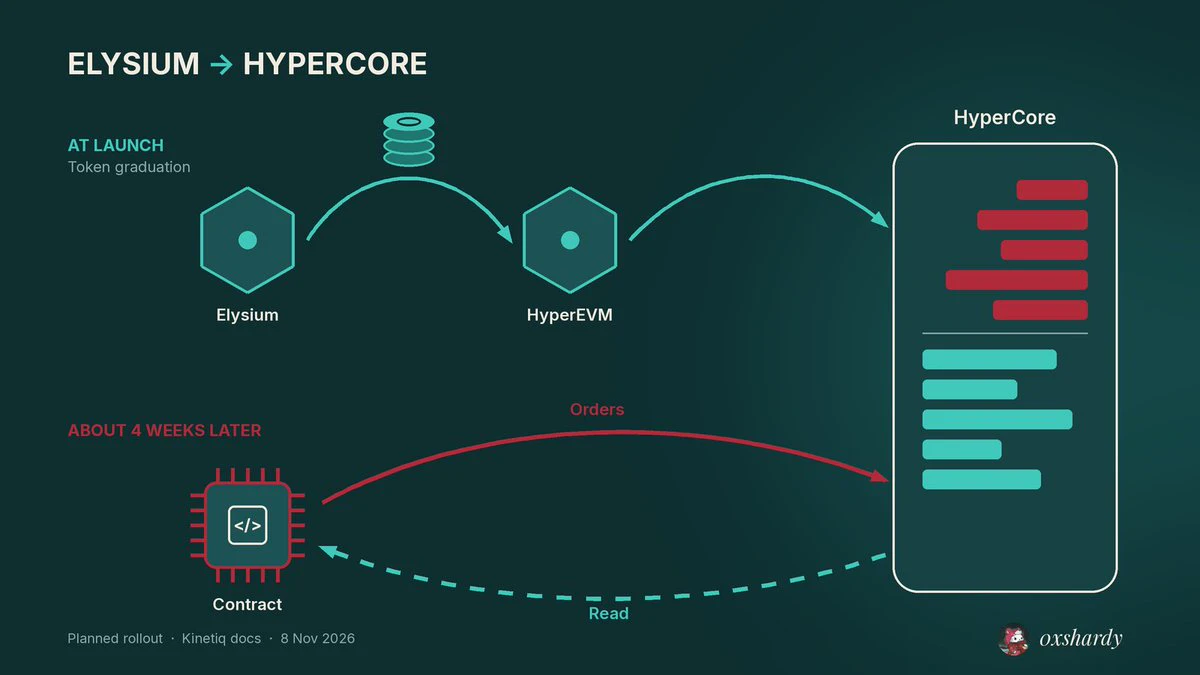
elysium launching doesn't mean its full HyperCore integration launches with it.
kinetiq's docs split the rollout
at launch
- 100ms blocks with $HYPE as gas
- canonical and mirror bridges
- a path for tokens to graduate to a HyperCore spot orderbook
about four weeks after mainnet
- contracts reading HyperCore books and prices directly
- the keeper fast lane for sending HyperCore orders
a token reaching a HyperCore orderbook and an app trading that orderbook from elysium are two different milestones.
that's the distinction to watch in the launch announcements.
post-image
HYPE+0.24%
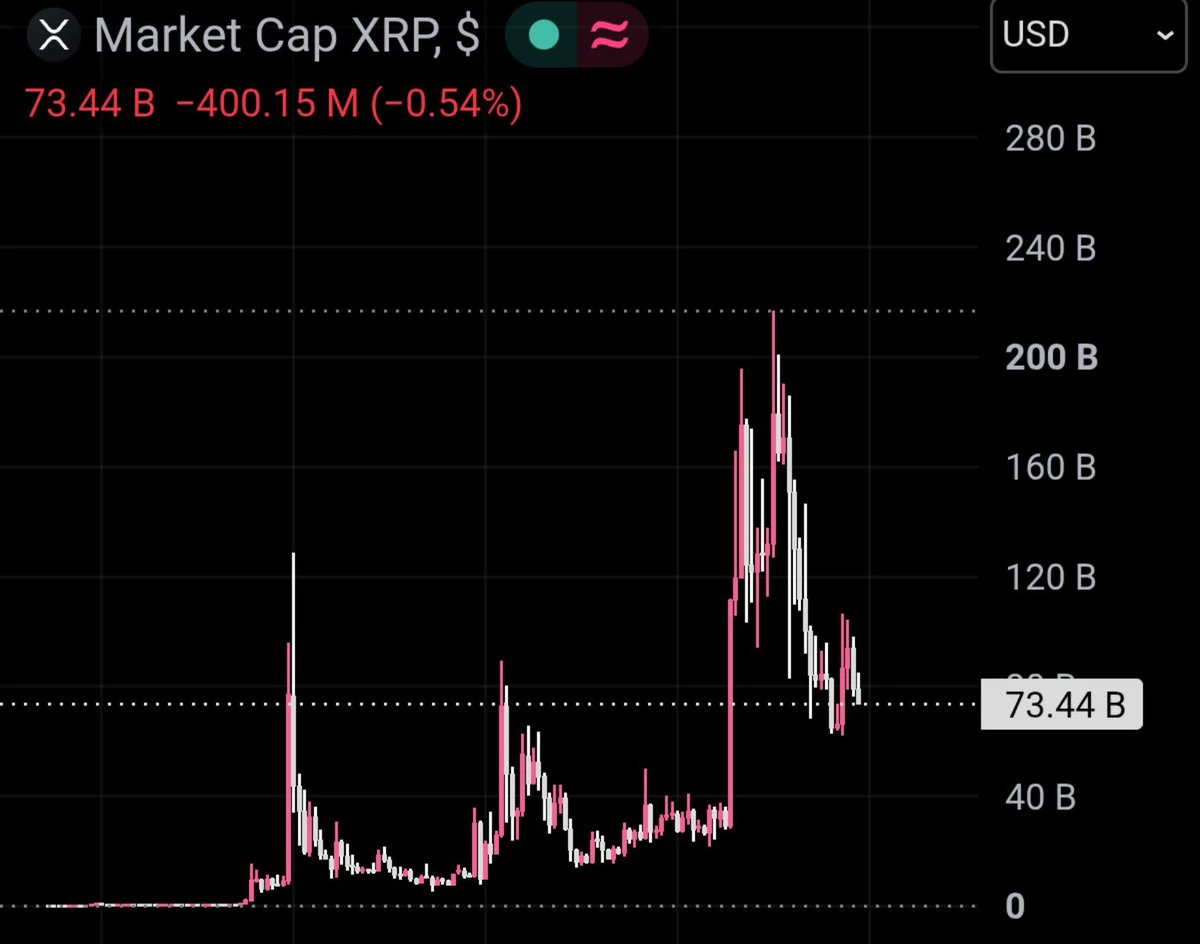
Surviving a decade as a crypto coin is commendable
However, there are genuinely people out there who believe $xrp is going to make them a millionaire 🎭
post-image
XRP-1.15%
Token Trading Became More Popular & Gamified Because Of Terminals & Launchpads. Those Two Combos Didnt Create A Market It Just Made Better Products For The Market To Grow Exponentially With Less Friction. Thats What good Products Do & Thats What Stockmon Is Doing & Why It Will Be One Of The Biggest Things To Happen Since.
Extremely Early But We're Seeing The Same Signs With Stockmon Except Stockmon IS New In The Fact These Collectibles Have backed Value That Compounds As It Grows , Its Taking Two Things That Already Exist Two Worlds, Collectibles & Finance, And Turning Them Into One Game. Wh
post-image
TOKEN-0.16%
As we move into November, there is one big fly still stuck in the ointment. Yes, we have very high EPS growth for the S&P 500, but two companies comprise one-third of that ~30% growth: $NVDA (NVDA) and $MU (MU).
NVDA+2.80%
MU+4.71%
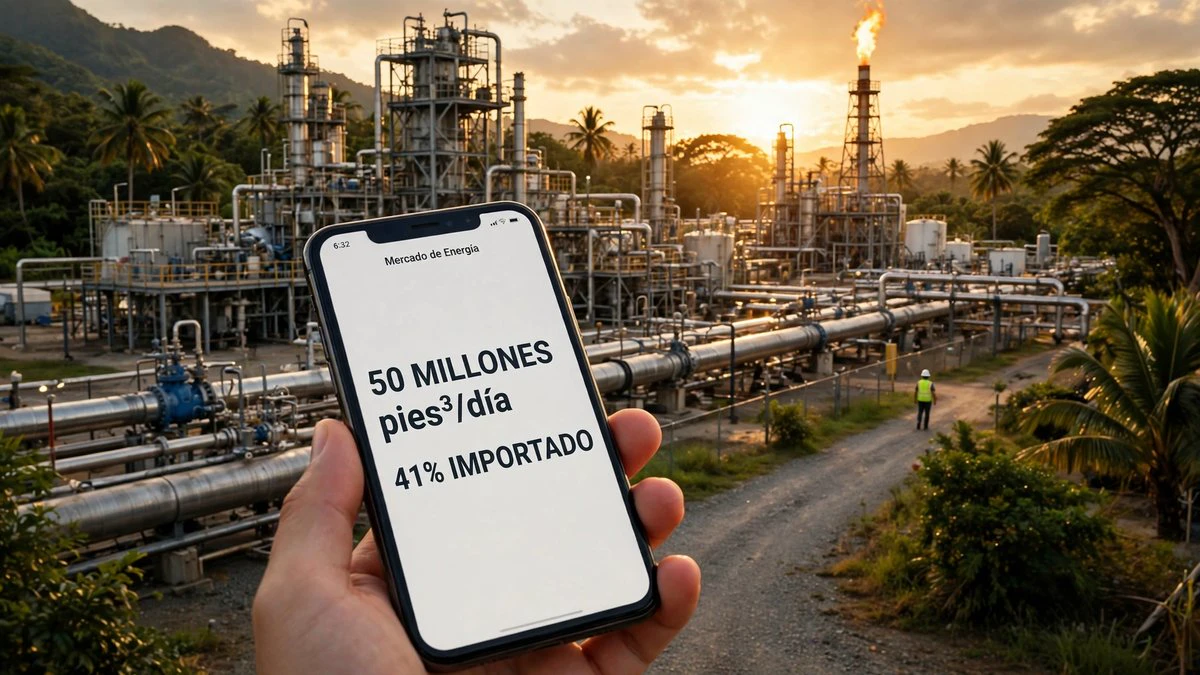
⛽ Venezuelan Gas to Colombia: Relief for the Bolívar and P2P?
While Venezuela debates the price of USDT on the P2P market, a decision is taking shape across the border that could shift the flow of foreign currency: Colombia confirmed that its natural gas deficit is pushing it to buy more than 40% of its consumption from abroad, and one of the routes under consideration runs through the Antonio Ricaurte binational gas pipeline, which connects the two countries.
🔹 The Neighbor’s Diagnosis: Low Reserves and Declining Supply
Colombia’s Minister of Mines and Energy, María Nohemi Arboleda, laid out
post-image
JUST IN: 🇺🇸🇨🇳 Nvidia $NVDA CEO Jensen Huang sends letter to employees after being targeted by female Chinese spy:
"I was unfaithful to my wife. My actions hurt her and our children. There is no excuse for what I did."
"I am fully committed to NVIDIA and will work to earn back your confidence."
NVDA+2.80%
$SKYAI almost shook me out on this move. A few days ago, it was bottoming around 0.0302. I saw volume keep shrinking and thought I’d wait a little longer. Then a bullish candle shot it up to 0.0411. I chased at 0.038, and my nerves went straight out the window—when it rose, I feared a pullback; when it fell, I feared getting stuck. In the end, I sold half around 0.0363 and made just enough for lunch. One lesson: when it’s moving sideways on low volume, don’t keep thinking “it might go a little lower.” Set a stop-loss at 0.033 and get in when it hits—that’s better than staring at the chart. It’
SKYAI-7.58%
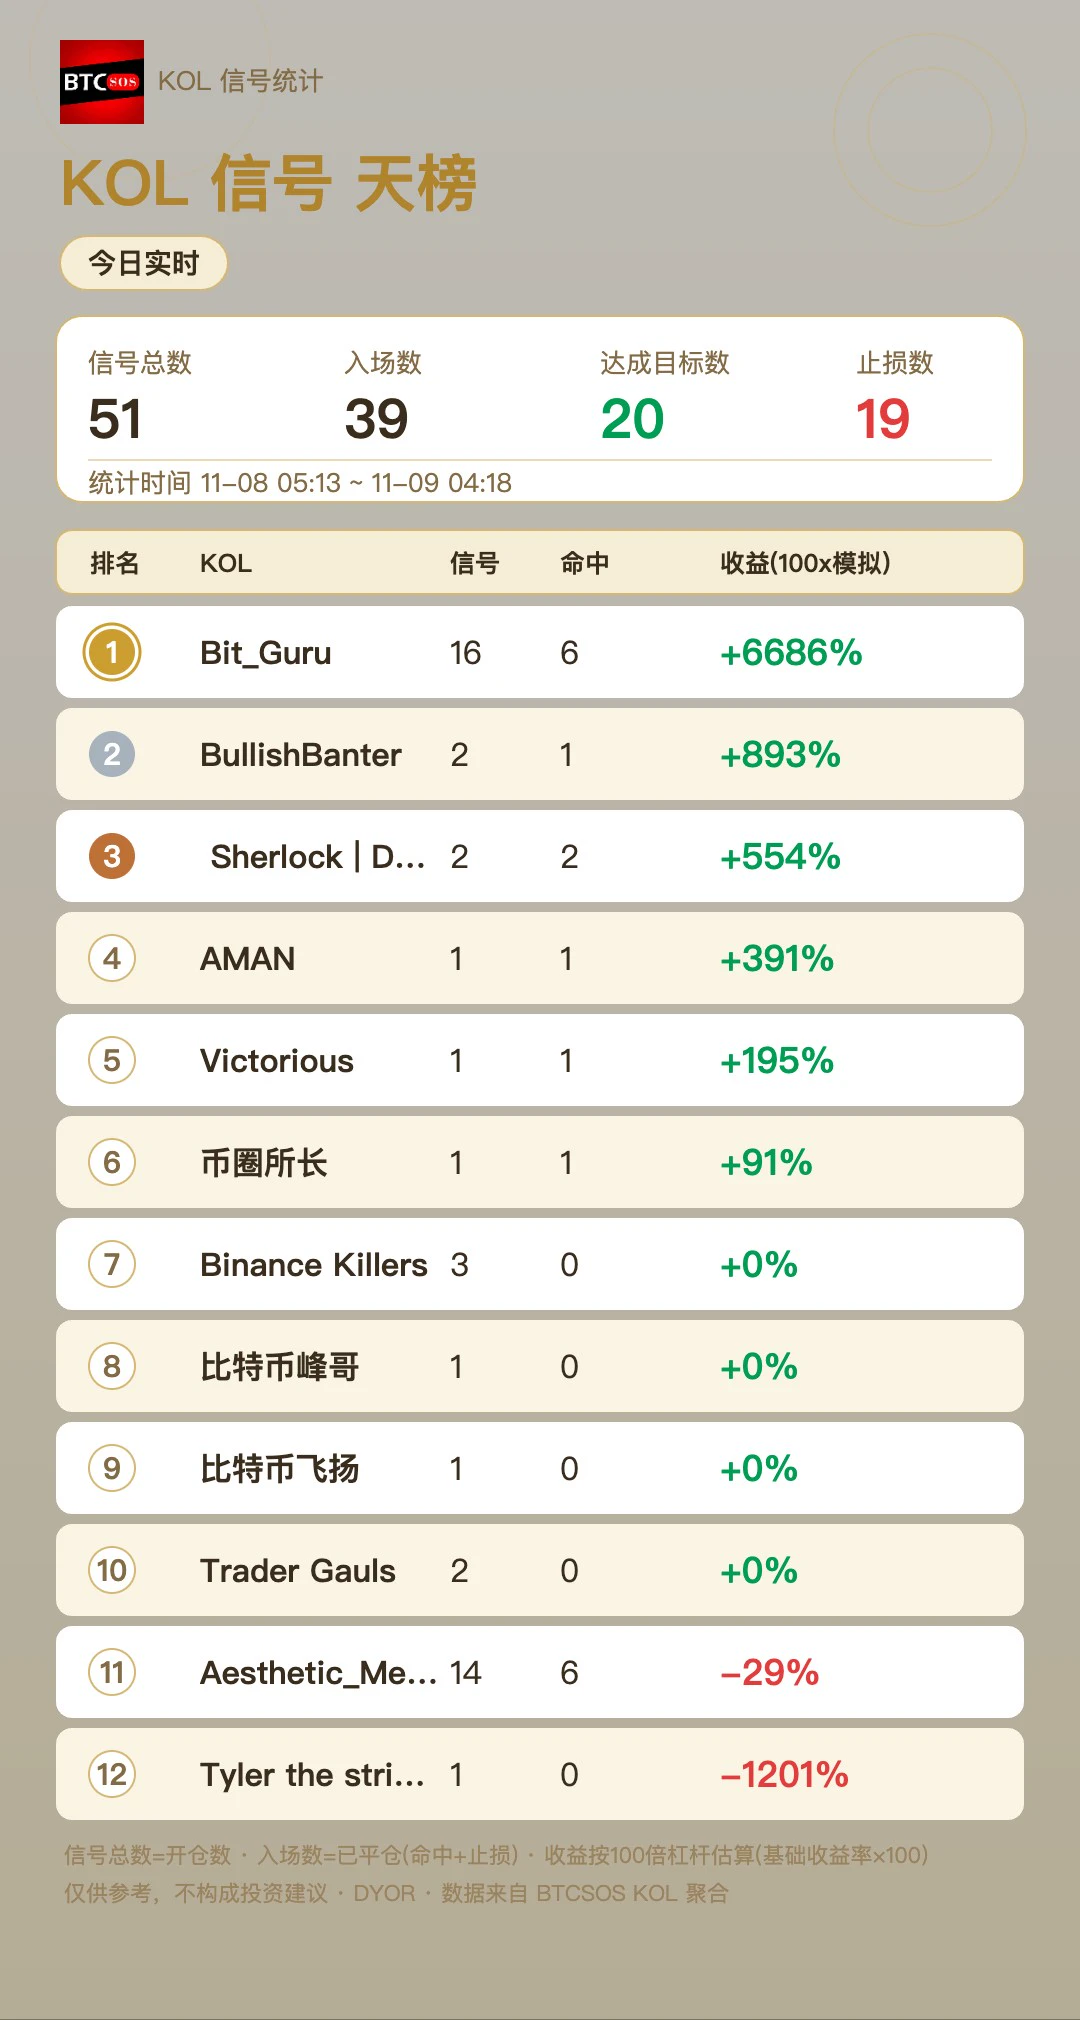
[Today's KOL Leaderboard] The btcsos signal feed had 51 signals, with 39 settled (20 hits / 19 stop-losses). Topping the list: Bit_Guru, with 10 settled trades, 6 hits, and simulated returns of +6686%. See the image for the full leaderboard; data is updated in real time from the KOL signal feed. By the way, Bit_Guru also topped the previous leaderboard (11-08) with +6959%, making it two wins in a row. 👀#U.S. crypto regulation: CLARITY Act stalled, 401(k) rules enter final review
post-image
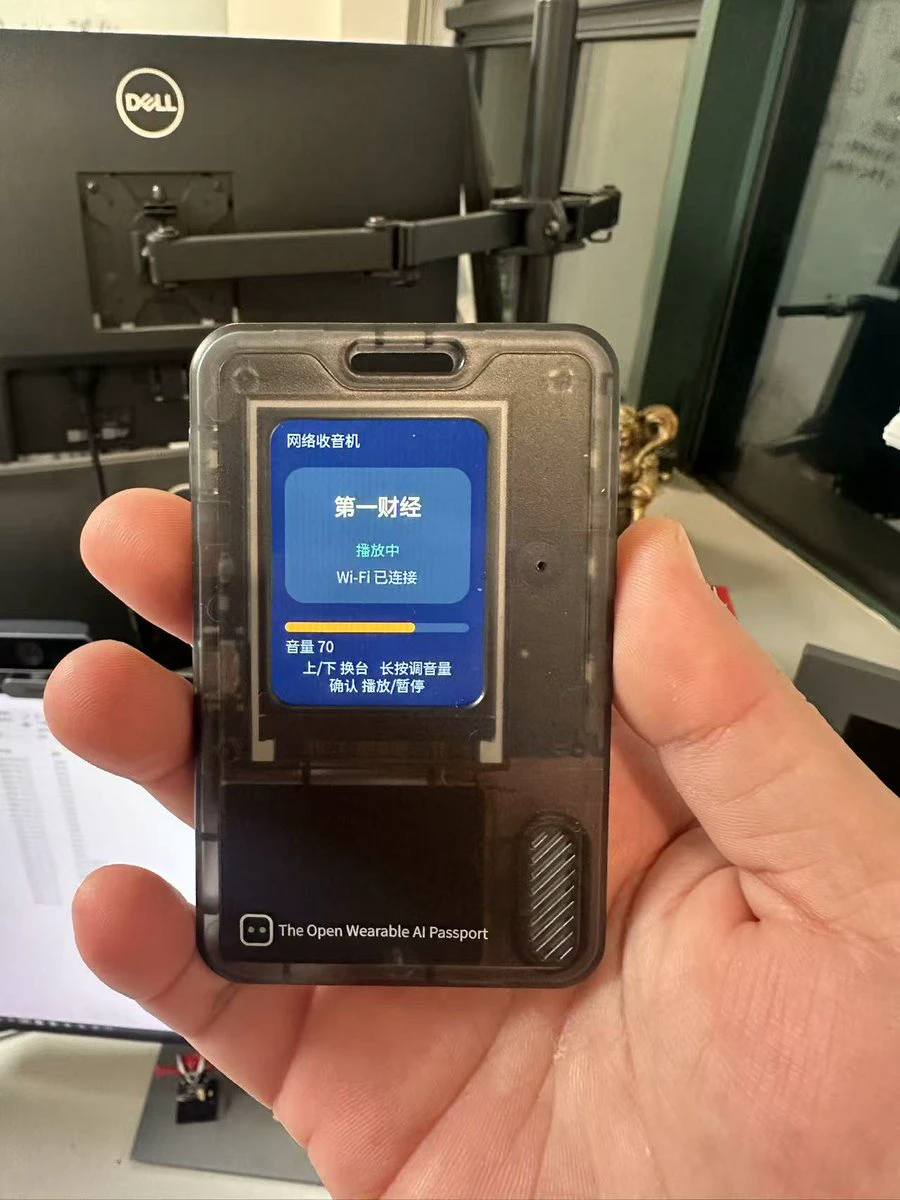
This thing's hardware is way too weak... It's just a badge 😂

Smooth video playback is pretty much impossible. After going around in circles, we still ended up reinventing the wheel.
post-image
The market suddenly moved late at night. $SNDK surged out of nowhere, and more than $20,000 in unrealized profits vanished in an instant. My average price is currently 888.93. My view is clear: this move is driven by liquidation-related liquidity and has no real footing; the price will most likely get hammered lower when the market opens today. If it keeps rising, I’ll add to my position. Either way, I’m keeping a steady mindset.

If the market maker behind $AK doesn’t have what it takes, they should stop trying to prop it up. Why act like a big shot while the price trades sideways? They can
post-image
ETH-1.26%
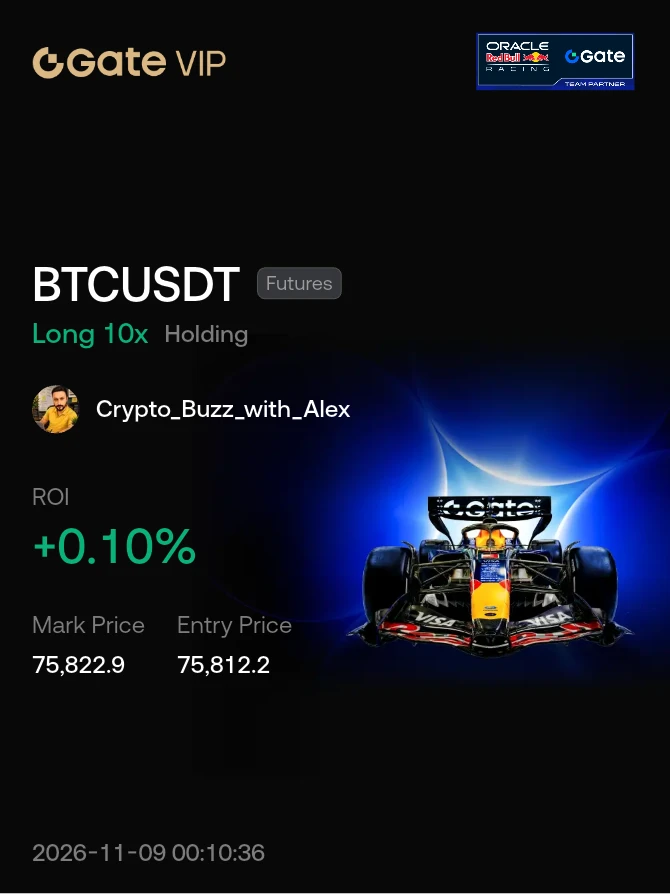
#Share My Holding Returns
another way up to the moon 🌝 if the market is going to respect the structure so we are good and catch the exact point and let's eep pushing it towards upside first to take the liquidity instead of downside. ♥️🎇🎆
#StockTalkSeason
post-image
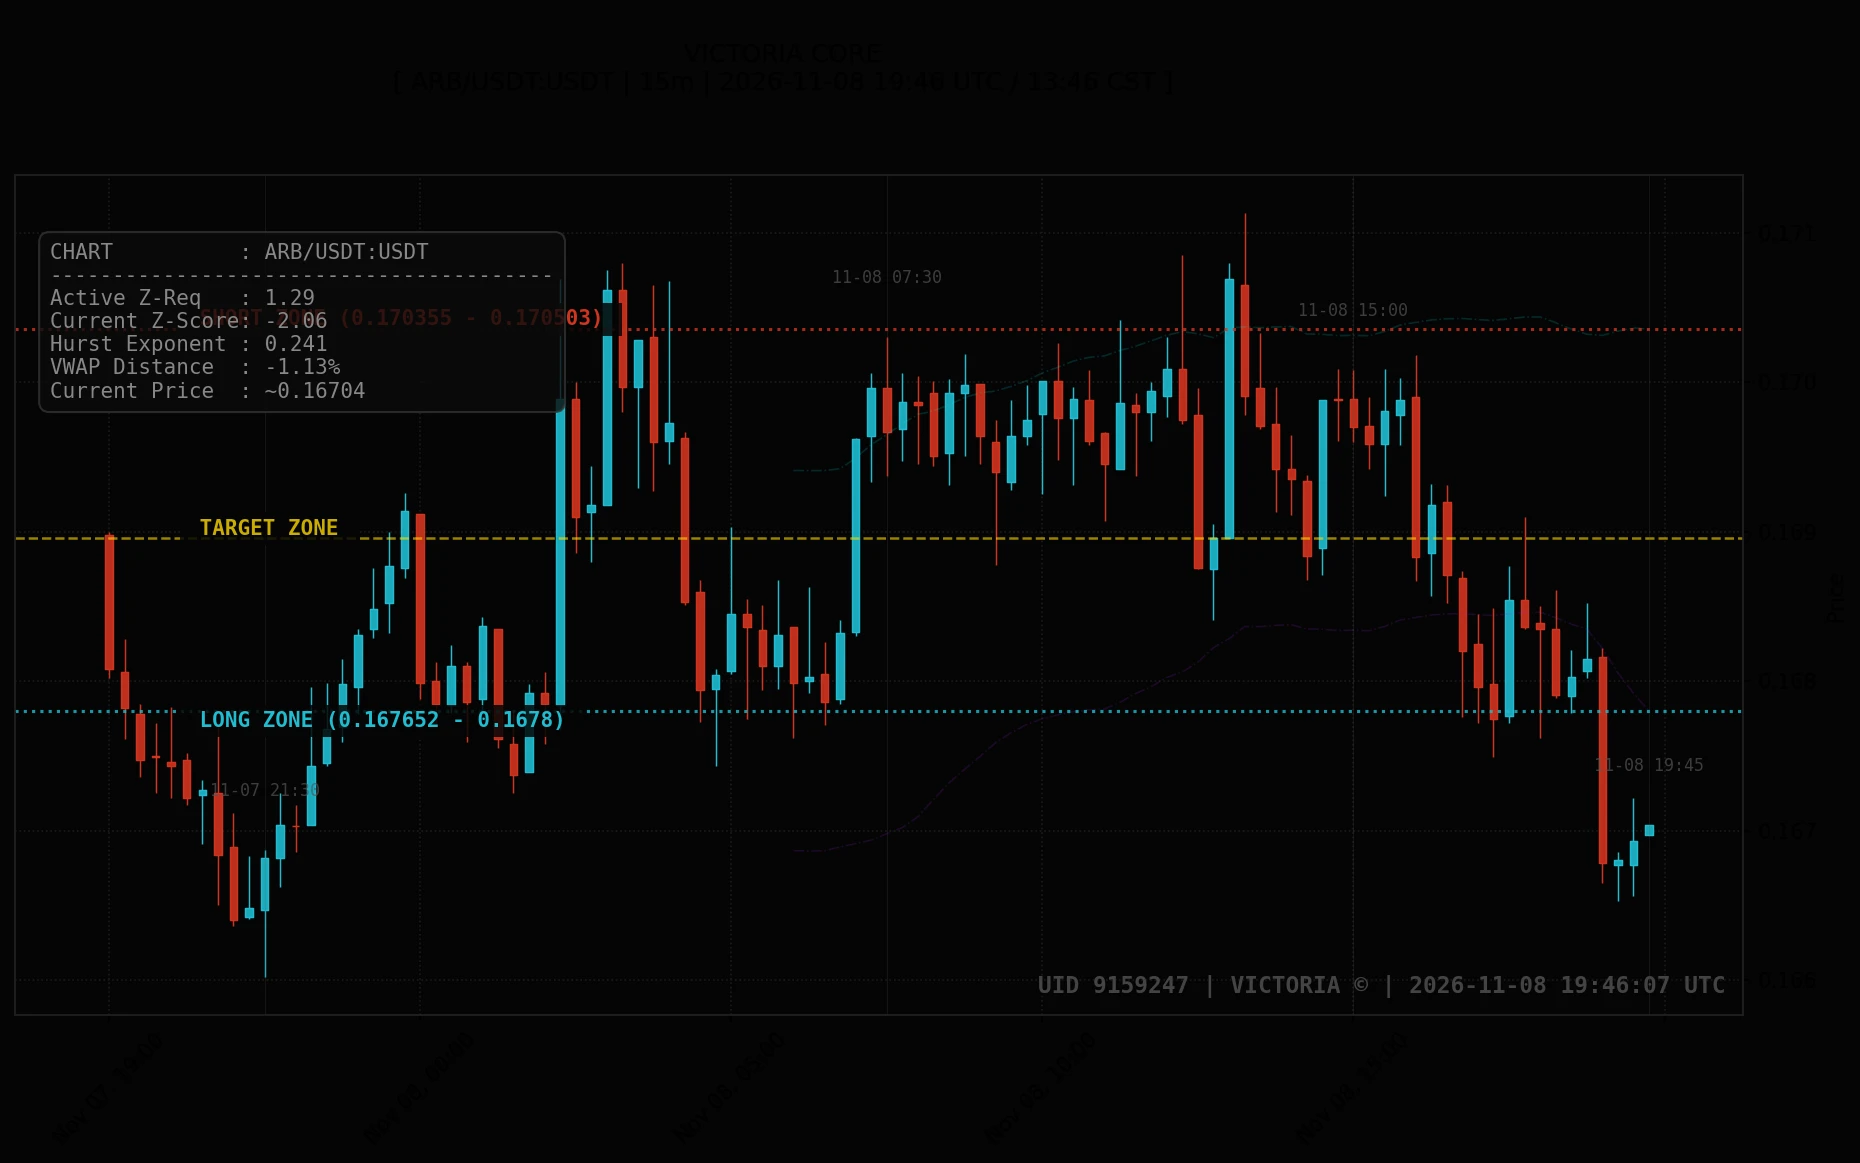
2026-11-08 19:46 UTC. ARB/USDT trades at ~0.16704 USDT in an extended discount structure, offering mean-reversion buyers an attractive risk-to-reward window if support at 0.16653 holds firmly. For safe execution, wait for price confirmation at LONG ZONE (0.167652 - 0.1678 USDT) targeting TARGET ZONE (~0.168955 USDT), while guarding against unexpected volatility with SHORT ZONE (0.170355 - 0.170503 USDT).

In secondary tracking, XRP/USDT at ~1.1544 USDT sits lower mid-range between LONG ZONE (1.15188 - 1.15267 USDT), SHORT ZONE (1.16618 - 1.16696 USDT), and TARGET ZONE (~1.15982 USDT). Finally
post-image
ARB+1.17%
XRP-1.15%
BTC-0.67%
Load More

Join 40 M users in our growing community

⚡️ Join 40 M users in the crypto craze discussion

💬 Engage with your favorite top creators

👍 See what interests you

Trending Topics

USCPIDataIncoming

15.13k Views1.66k Discussing

The U.S. October CPI report will be released on November 10 at 8:30 a.m. ET. September CPI came in at 3.7% year over year, and markets will be watching closely for signs that inflation is cooling, especially in core CPI. A softer-than-expected reading could strengthen rate-cut expectations, while hotter inflation may pressure risk assets through higher Treasury yields and a stronger dollar. How do you think this CPI print will move $BTC, U.S. stocks and gold?

USAIStocksHitHard

29.19k Views3.74k Discussing

USNonfarmPayrolls

56.39k Views4.5k Discussing

View More