








#StakeLaunchPoolToShare2.8M$DNA Launchpool Season 383 explained: how to read the 2.8M DNA staking event before you stake
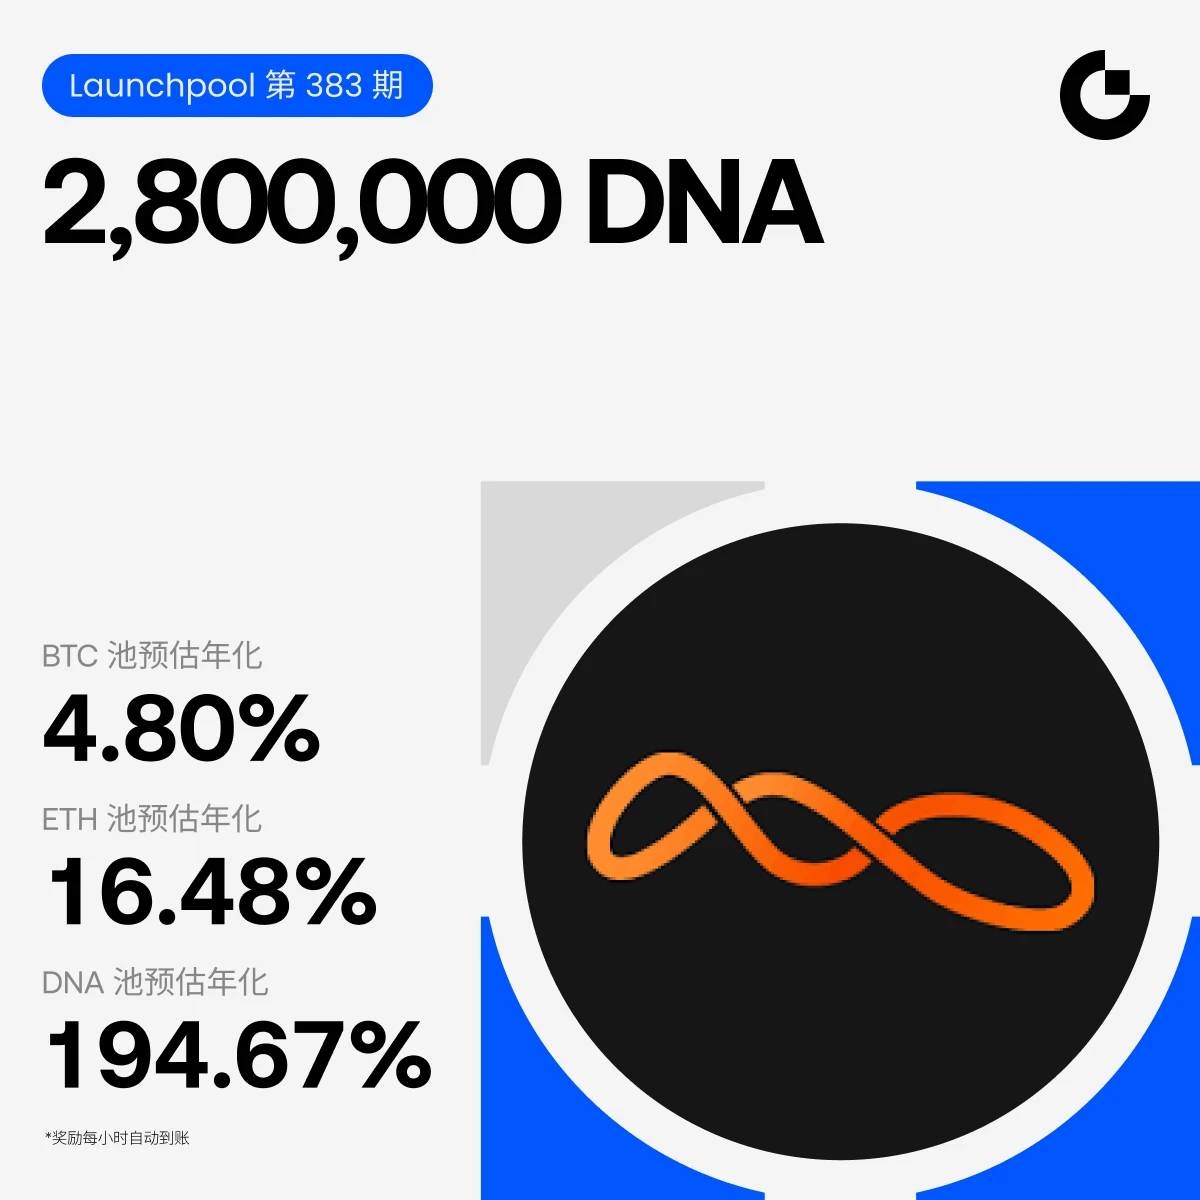
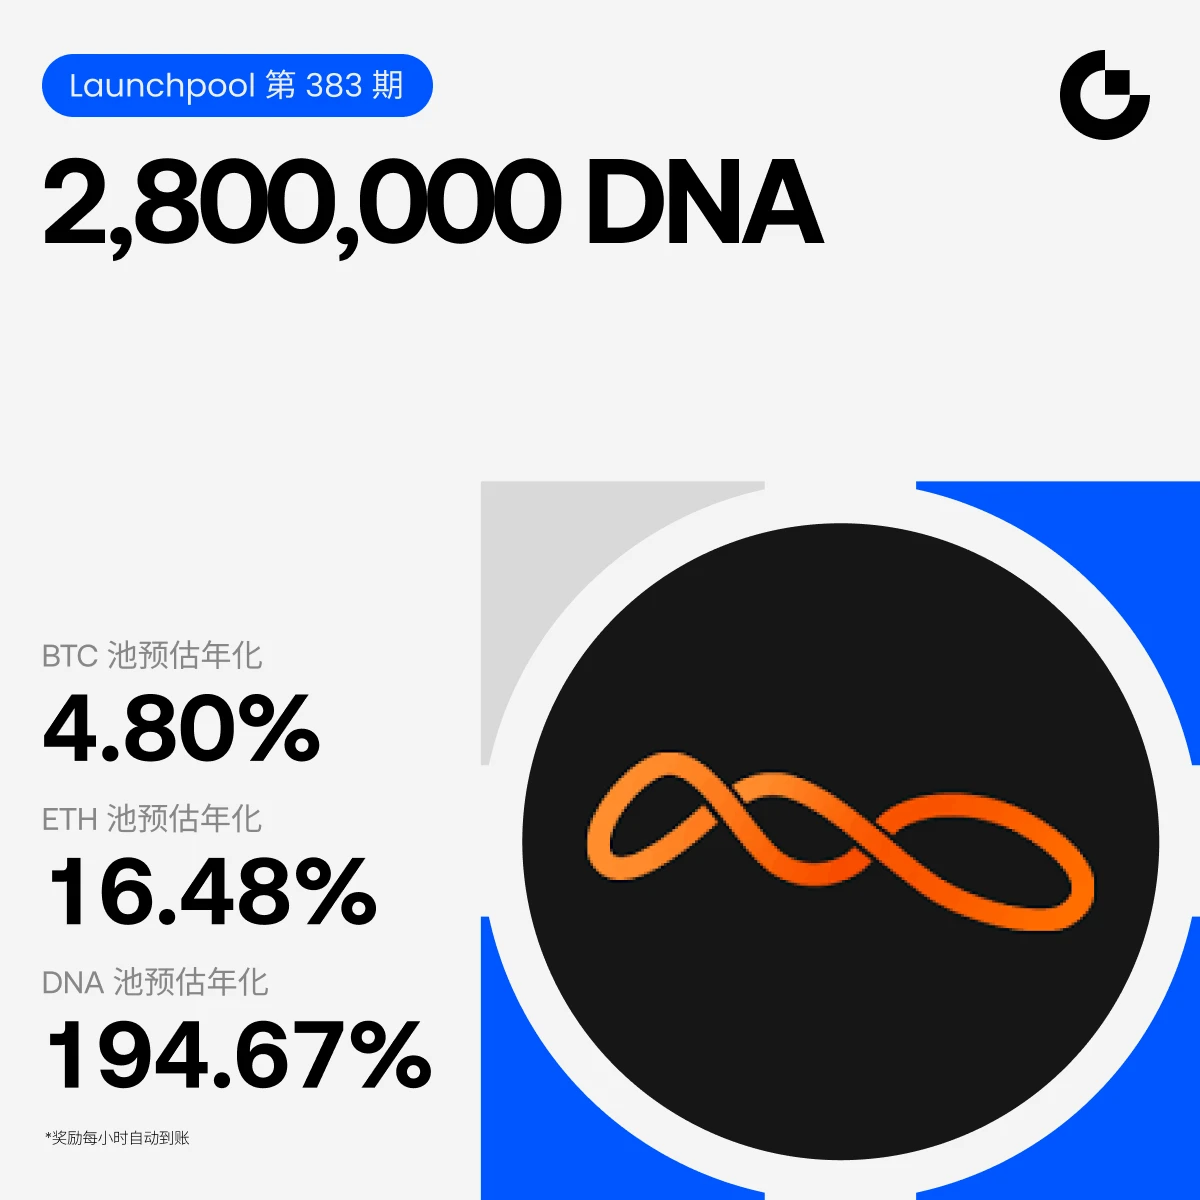
Gate's 383rd Launchpool is live, and the headline number is big: 2,800,000 DNA to share. The more useful question is how the event works and what the numbers really mean, so here is my breakdown.
What DNA is
Gate listed NeoSoul (DNA) for spot and flash trading on October 16 at 19:00 (UTC+8). NeoSoul is building an operating system for the AI Agent economy, with its core product NeoTrade serving as a universal execution layer for trading agents. That puts it in the AI-agent theme, which is one of the busier narratives in the market right now.
The event in one view
Users can stake BTC, ETH or DNA to share a prize pool of 2,800,000 DNA, with rewards settled hourly and 100% unlocked. Distribution is hourly with instant unlocking. The window runs from October 16 at 19:00 to November 6 at 19:00 (UTC+8). Early staking is supported, so earning starts as soon as the event begins. Alongside it, the two benefit activities together distribute 3.8 million DNA, which means a CandyDrop pool of about 1 million DNA.
The timing math
The event lasts 21 days, or 504 hours. By my calculation, spreading 2.8 million DNA across the full window averages about 5,556 DNA per hour, or roughly 133,000 DNA per day, split across the three pools. We are about two days in, so roughly 10% of the window has passed and about 19 days remain.
How rewards are calculated
Gate's FAQ gives the formula. Hourly reward equals your latest one-hour valid staking amount divided by the total pool staking amount, multiplied by the hourly reward pool, using multiple snapshots each hour and the average amount as the valid stake. A simple illustration with made-up numbers: if a pool distributes 1,000 DNA in an hour and you hold 1% of its valid stake, you receive 10 DNA that hour.
That formula explains why APR is a moving target.
The APR picture
The headline estimate is up to 194.67%, and the latest figures have moved. The current APR is 7.25% for the ETH pool, 6.24% for the BTC pool and 218.90% for the DNA pool. Three points matter here.
First, the very high number belongs to the DNA pool, not the BTC and ETH pools. Second, APR is an estimate that shifts as the pool size changes. When more users stake, each person's share falls, and APR falls with it. Third, the reward is paid in DNA, so the real return depends on DNA's price when you sell or hold it. An APR quoted in DNA terms is not a dollar guarantee.
Which pool fits which user
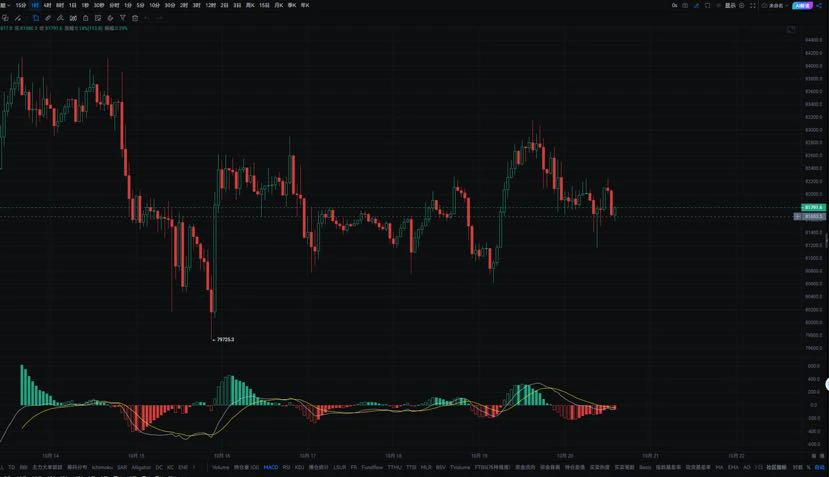
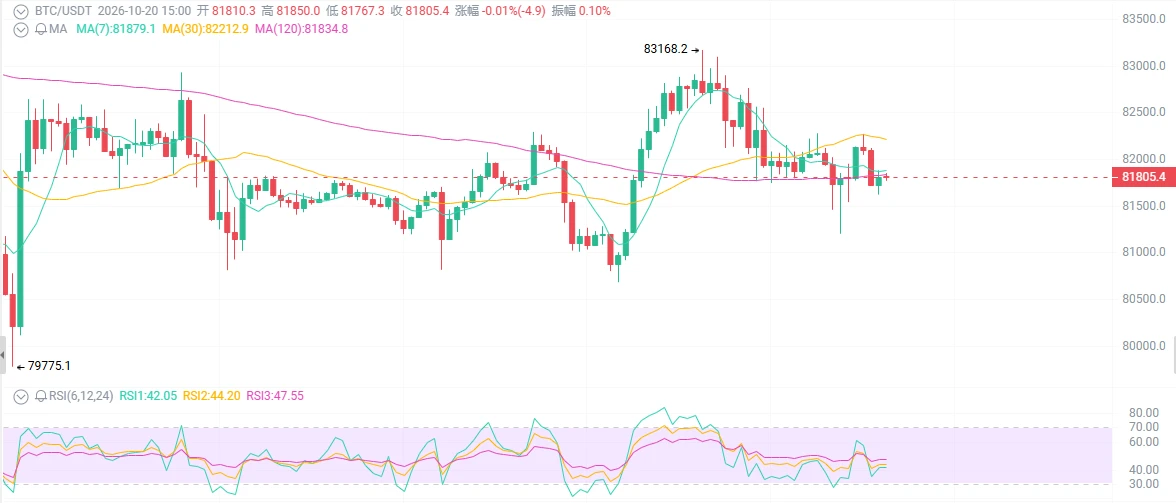
BTC and ETH pools suit holders who already plan to keep those assets. You stay exposed to BTC and ETH prices, and the DNA reward is an extra layer on top. With BTC near $81,600 and ETH near $2,400, you are not selling anything to participate.
The DNA pool carries a much higher APR, but you must hold DNA, a new listing whose price can swing hard. Its APR can also fall quickly if many users pile in.
Risks and checks
New listings are volatile, and airdropped tokens can face selling pressure as rewards reach users. Check the per-user hourly caps and minimum stake rules on the event page, since earlier Launchpool rounds had individual reward limits. Rewards are credited hourly to the spot account, so you control when to hold or sell.
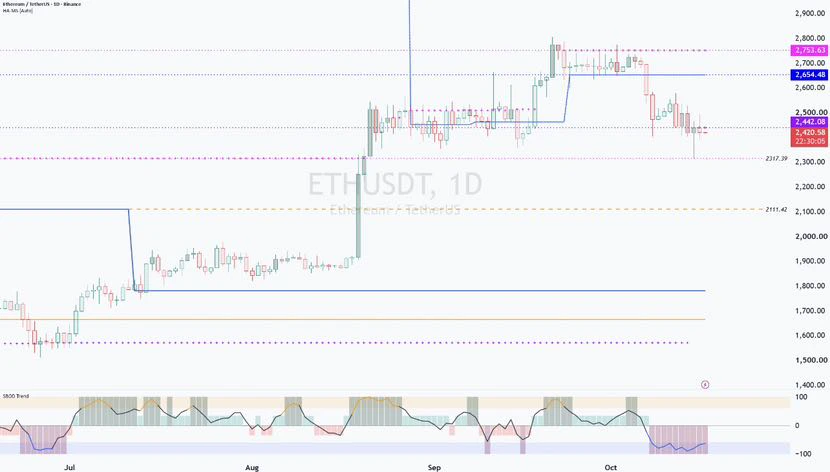
I would also keep in mind that BTC and ETH can still move sharply. ETH tested the $2,310 to $2,324 area this week, and the Fed meets on October 27-28, so market risk sits on top of the event's rewards.
My approach
I would stake an amount I already intend to hold, stay in the BTC or ETH pool if I want lower risk, check the live APR instead of relying on the launch figure, and decide in advance whether I will keep or sell DNA rewards. If I use the DNA pool, I would keep the size small and treat the APR as a variable.
The structure is clear and the incentive is large, but the best use of a Launchpool is as a bonus on assets you would hold anyway, not as a reason to take on new risk.
Gate's 383rd Launchpool is live, and the headline number is big: 2,800,000 DNA to share. The more useful question is how the event works and what the numbers really mean, so here is my breakdown.
What DNA is
Gate listed NeoSoul (DNA) for spot and flash trading on October 16 at 19:00 (UTC+8). NeoSoul is building an operating system for the AI Agent economy, with its core product NeoTrade serving as a universal execution layer for trading agents. That puts it in the AI-agent theme, which is one of the busier narratives in the market right now.
The event in one view
Users can stake BTC, ETH or DNA to share a prize pool of 2,800,000 DNA, with rewards settled hourly and 100% unlocked. Distribution is hourly with instant unlocking. The window runs from October 16 at 19:00 to November 6 at 19:00 (UTC+8). Early staking is supported, so earning starts as soon as the event begins. Alongside it, the two benefit activities together distribute 3.8 million DNA, which means a CandyDrop pool of about 1 million DNA.
The timing math
The event lasts 21 days, or 504 hours. By my calculation, spreading 2.8 million DNA across the full window averages about 5,556 DNA per hour, or roughly 133,000 DNA per day, split across the three pools. We are about two days in, so roughly 10% of the window has passed and about 19 days remain.
How rewards are calculated
Gate's FAQ gives the formula. Hourly reward equals your latest one-hour valid staking amount divided by the total pool staking amount, multiplied by the hourly reward pool, using multiple snapshots each hour and the average amount as the valid stake. A simple illustration with made-up numbers: if a pool distributes 1,000 DNA in an hour and you hold 1% of its valid stake, you receive 10 DNA that hour.
That formula explains why APR is a moving target.
The APR picture
The headline estimate is up to 194.67%, and the latest figures have moved. The current APR is 7.25% for the ETH pool, 6.24% for the BTC pool and 218.90% for the DNA pool. Three points matter here.
First, the very high number belongs to the DNA pool, not the BTC and ETH pools. Second, APR is an estimate that shifts as the pool size changes. When more users stake, each person's share falls, and APR falls with it. Third, the reward is paid in DNA, so the real return depends on DNA's price when you sell or hold it. An APR quoted in DNA terms is not a dollar guarantee.
Which pool fits which user
BTC and ETH pools suit holders who already plan to keep those assets. You stay exposed to BTC and ETH prices, and the DNA reward is an extra layer on top. With BTC near $81,600 and ETH near $2,400, you are not selling anything to participate.
The DNA pool carries a much higher APR, but you must hold DNA, a new listing whose price can swing hard. Its APR can also fall quickly if many users pile in.
Risks and checks
New listings are volatile, and airdropped tokens can face selling pressure as rewards reach users. Check the per-user hourly caps and minimum stake rules on the event page, since earlier Launchpool rounds had individual reward limits. Rewards are credited hourly to the spot account, so you control when to hold or sell.
I would also keep in mind that BTC and ETH can still move sharply. ETH tested the $2,310 to $2,324 area this week, and the Fed meets on October 27-28, so market risk sits on top of the event's rewards.
My approach
I would stake an amount I already intend to hold, stay in the BTC or ETH pool if I want lower risk, check the live APR instead of relying on the launch figure, and decide in advance whether I will keep or sell DNA rewards. If I use the DNA pool, I would keep the size small and treat the APR as a variable.
The structure is clear and the incentive is large, but the best use of a Launchpool is as a bonus on assets you would hold anyway, not as a reason to take on new risk.