Share your thoughts
placeholder
Article
#HYPEBreaks88HitsNewAllTimeHigh

HYPE/USDT: correction or pause before next leg?
Current price: $83.82 (-3.09% in 24h)
24h High: $87.39 / Low: $83.48
Volume: 352.29K HYPE (turnover $30.01M) – below average (last bar 51.65K vs MA5 344.24K)
Technical indicators (from chart):
· EMA5: 84.02 → price slightly below, indicating short-term weakness
· EMA10: 82.57 / EMA30: 74.53 → price still above both, confirming medium-term uptrend
· BOLL(20,2): UB 93.99 / MB 78.64 / LB 63.30 → price in upper half but closer to mid-band; not overextended
· MACD: -0.11 (DIF 5.91 < DEA 6.02) → bearish crossover, momen
post-image
HYPE-2.23%
  • 5
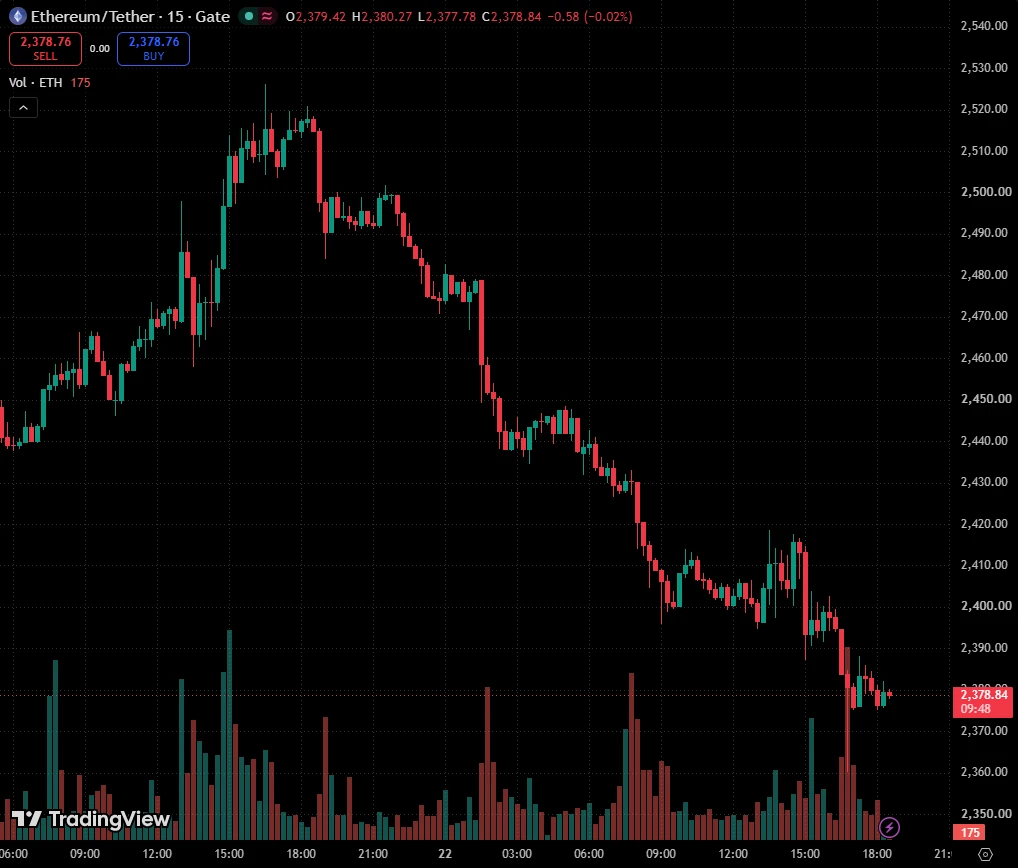
Everyone’s staring at the 1D range—but the 4h clock just started ticking against $ETH /USDT.

$ETH /USDT - SHORT

Trade Plan:
Entry: 2445.80 – 2452.56
SL: 2481.60
TP1: 2424.87
TP2: 2408.66
TP3: 2384.34

Why this setup?
Why now?
- The 4h structure is armed SHORT at 2449.18, not a random guess.
- RSI on the 15m (45.84) shows weak bounce fuel, not momentum.
- ATR (13.5) confirms tight compression—breakouts here sting faster.
- Targets stack down: 2424 → 2408 → 2384, while invalidation sits far at 2461.
- Range day + compressed volatility = sniper window, not a trend day.

Debate:
If
ETH-2.33%
$SNXX Signal】Long · 4H Bollinger upper band breakout
$SNXX RSI 80.74, the 4H Bollinger upper band at 17.2885 has been breached. The 4H MACD histogram is expanding while the 1H histogram is narrowing, with short-term momentum still at elevated levels. Depth imbalance is -18.12%, with sell-side orders clearly outweighing buy-side orders. The funding rate is running high at 0.14%, and spot and futures sentiment are diverging. The current price of 17.59 is within the recommended entry range; go long directly.
🎯Direction: Long
⚡Entry/Limit order: 17.5372 - 17.5900
🛑Stop-loss: 17.4141
🚀Target 1:
post-image
SNXX+24.43%
When that upper wick appeared a few days ago, my first reaction was not to chase a short, but to see whether it could hold the key level. The subsequent rebounds were all noticeably weak, showing that buying support at the highs was insufficient, so I entered short in batches during the rebound. The position was split into two trades, 80% and 20%. I closed the first after it caught the rapid sell-off, then moved the protection level lower on the remaining 10% position, hoping to let the profits run a little further. Later, the candlesticks spent quite some time grinding below $MAGMA without ma
post-image
MAGMA+13.16%
SOL-1.74%
LAB+5.53%
#GateTops7DayNetInflowsGlobally 🌍🔥 Gate Tops Global 7-Day Net Inflows!
Gate is making a strong move as it ranks among the top platforms globally for 7-day net inflows. 📊💰
This momentum highlights growing user activity and confidence across the crypto market. 🚀
👀 More capital. More activity. More opportunities.
The Gate ecosystem continues to move forward! 💙
#GateTops7DayNetInflowsGlobally #Gate #Crypto #CryptoMarket
post-image
$ZEN has formed 223 days accumulation range on daily timeframe 👀
A successful breakout will open door for massive Bullish Rally 📈
Free Signals:
#Crypto #ZEN #Horizen #Zenusdt #ZENCoin #cryptocurrency
post-image
ZEN0.00%
ON+3.37%
[New Streamer] Market Prediction
live-cover
LIVE787
$UAI Signal】Go long on 1H pullback support; 4H momentum remains intact
$UAI Buy-side depth ratio 1.77, with dense orders at 0.456-0.459; short-term selling pressure is being quickly absorbed.
The 4H MACD histogram continues to expand, with momentum still strong; the 1H MACD has weakened in the short term, but the price has not broken the previous low, forming a narrow-range consolidation. RSI is at 56, above the midpoint, with the balance between longs and shorts slightly bullish. Funding rate is 0.0302%, long sentiment is healthy, and OI is stable, with no excessive leverage buildup.
🎯Direc
post-image
UAI+21.80%
The hand that set the stop-loss a few days ago trembled slightly, and this morning I realized that was needless filial piety😂 $WLD This long trade is genuinely strong; 0.3878 has already moved well clear of the cost zone, making that bit of panic a few days ago seem especially unnecessary.
The most interesting part was the intraday bottoming grind: around 0.3669, sellers wanted to smash it down but couldn't, while buyers became increasingly aggressive. Funds were quietly entering, and the candlesticks clung to the bottom without breaking down. I judged at the time that this was accumulation,
post-image
WLD+0.26%
ADA-4.12%
ZEC+6.41%
This trend is so obvious I don’t even need to think—the account is dancing on its own 💃
When the market was bottoming out intraday, many people were still hesitating over whether to cut their positions. I saw buying strengthen noticeably around 92.57, and the price failed to break down despite testing lower levels several times. Funds were quietly entering, and the signal was practically laid bare. I directly called for opening long positions then, and those who dared to follow should be laughing now 😏
The price is now at 95.71, up +315.53%, which says it all. I’d rather miss a limit-up move
post-image
BZ+0.33%
XRP-3.28%
LAB+5.53%
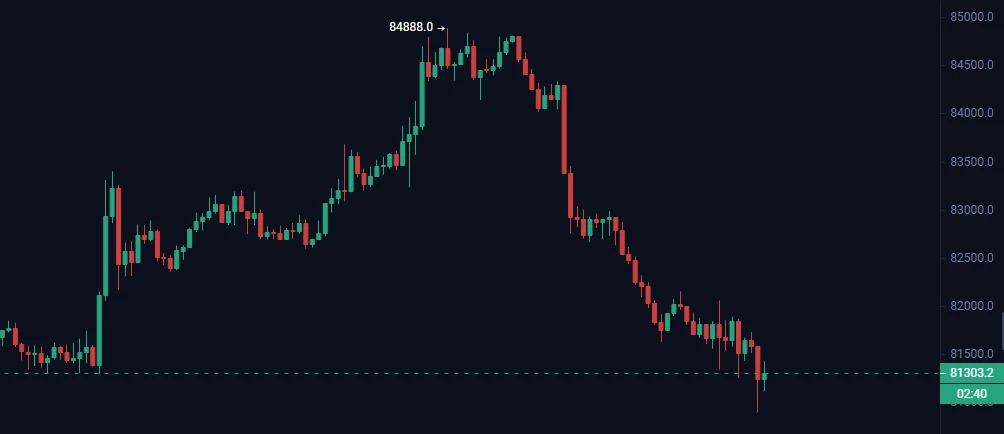
🚨 #BTCReclaims80K
#Bitcoin just reminded everyone why risk management always comes before prediction.
One strong economic report... One wave of liquidations... And suddenly, the entire crypto market was filled with panic.
But is this really the beginning of a massive bear market?
Not so fast.
The biggest mistake traders make is reacting to the first move instead of understanding why it happened.
Here's what actually unfolded.
The U.S. August jobs report came in much stronger than markets expected.
• 162K new jobs were added. • Expectations were only around the mid-50K range. • July's data was
BTC-1.59%
INDEX-23.90%
9.5$BTC Analysis
Weekend volatility is limited, so everyone can take advantage of the range to capture small swings back and forth. It’s time to relax and rest; we’ll livestream again and provide spot orders when volatility picks up.
The 4-hour chart shows a clear pullback, down ‑1.91%, with net capital outflows of $612 million as selling pressure continues to be released. The price fell below the upper Bollinger Band and retested the support zone near the middle Bollinger Band at 78520. The upper Bollinger Band at 81687 has turned into strong short-term resistance, while 75353 is an importan
post-image
BTC-1.59%
ETH-2.36%
SNDK+11.88%
$ZEN is 12% up from the time of the post.
I am not expecting any deeper zone corrections, as previously stated. Current support for bullish strength is the MA7 on the 1-hour chart and the MA25 on the 15-minute chart.
We are still well-positioned for further highs, but booking profits when they are available is the most important thing.
Thanks for reading.
post-image
CryptoSat
Buddies, Stilllllll , we can make 30 to 50% profit in Horizen 😅
Good morning Signal 😎
ZEN0.00%
$NOM 24-hour surge of 27%, with $25.3 million in trading volume. This level of volume during a macro data blackout is purely a fund-driven move. The Fed minutes, nonfarm payrolls, and CPI are all absent, and there is nothing major before the U.S. stock market opens tonight—on days like this, market makers love pushing small-cap assets because nobody's attention is being diverted.
I'll state the conclusion directly: NOM has climbed from 0.0015 to 0.0020, breaking above the previous high on heavy volume on the four-hour chart, but $25M in trading volume is barely a ripple in crypto. The spot Bit
NOM+23.79%
BTC-2.35%
NAS100-0.60%
USIDX+0.15%
SPYX-0.43%
AI remains one of the main altcoin sectors for the next bull market
The AI sector should start moving in the short term, and everyone can make some short-term trades in the coins they were bullish on early.
AI Agent is highly likely to become one of the top three main narratives in the next altcoin expansion, but it is unlikely that all AI Agent tokens will rise together for a long time. I think only 3 to 5 projects will truly stand out in the end. The key is whether they have real traffic, monetization ability, and whether the token can capture value.
The last altcoin narrative wave was launc
post-image
FET+4.95%
TAO+0.10%
VIRTUAL+0.42%
Everyone’s long $CL /USDT—but the range top just whispered a secret most missed.

$CL /USDT - SHORT

Trade Plan:
Entry: 90.95 – 91.19
SL: 92.21
TP1: 90.21
TP2: 89.64
TP3: 88.79

Why this setup?
Why now? The 4h structure is stalling at 91.07 with a 55% short bias, yet the 1D trend refuses to commit—pure chop. RSI on 15m sits at 55.07, not oversold, giving shorts room to breathe. ATR 0.47 on 1h means volatility is tight, but TP1 at 90.21 is a clean 0.9% grab before the range’s lower lip. If price rejects 91.19, the path to 89.64 (TP2) opens like a trapdoor. This isn’t a trend trade—it’s a pre
CL-0.29%
SanDisk’s 12% Surge: Is the Market Pricing in “Oversupply Three Years From Now,” or Is AI Rewriting the Cycle?
On September 4, SanDisk closed at $1,740, surging 11.9%.
Just the day before, it had risen only 0.1%. The difference between the two days was enormous.
That day, U.S. stocks were “scared off” by the nonfarm payrolls data, with the Dow and S&P falling across the board. But the Philadelphia Semiconductor Index rose 3.4% against the trend, and SanDisk became the S&P 500’s biggest gainer.
The broader market fears rate hikes; chips do not.
The market is expressing a judgment with real mone
post-image
BTC-1.59%
SNDK+12.28%
SKHY+6.52%
Gold may rebound higher with two relatively attractive selling zones worth watching
$XAU $XAUT
XAU-0.80%
XAUT-0.70%
  • 8
$AKE is even more powerful than a money printer—making money is too easy.
AKE+15.52%
Load More

Join 40 M users in our growing community

⚡️ Join 40 M users in the crypto craze discussion

💬 Engage with your favorite top creators

👍 See what interests you

View More