





Square
Following
Hot
News
Notifications
Profile
Share your thoughts
placeholder
Article
#USStocksFaceHistoricSelloff
Hunting for a Reversal in the SOXL Crash .
$SOXL ‌

The chart tells a dramatic story. SOXL, a 3x leveraged semiconductor ETF, has experienced a catastrophic drop, plummeting -38.19% to trade at $40.93. The price has sliced through the Bollinger Bands and moving averages like a hot knife through butter, driven by headline fears (as noted: "AI buildout fears hit chip stocks").

When an asset falls this violently, panic selling is common. However, for the technical trader, a massive sell-off often sets the stage for a sharp, equally violent bounce. The Gartley Patt
SOXL-38.25%
  • 16
$BTC For me, unless I see strong liquidity around 73800, I won’t consider any bullish or upside scenario. We also need to understand the deeply bearish scenario: a close below 71k.
post-image
BTC-0.67%
Trenches
ZIG
Z
bade
b
ZIG
0x8c...1145
Market Cap
$.
Change
.
24h Vol
$.
Holders
.
BTC
B
bade
b
BTC
C5xp...pump
Market Cap
$.
Change
.
24h Vol
$.
Holders
.
STONK
S
bade
b
STONK
6GmA...UNgx
Market Cap
$.
Change
.
24h Vol
$.
Holders
.
DESSA
D
bade
b
DESSA
npz2...pump
Market Cap
$.
Change
.
24h Vol
$.
Holders
Diamond
D
bade
b
Diamond
5VCE...pump
Market Cap
$.
Change
.
24h Vol
$.
Holders
.
📣 Daily standout post call|Don’t keep great posts to yourself—see you in the comments

Which post have you written recently that you’d most like everyone to take a closer look at? 🔎

Well-grounded market analysis, trading recaps that spell out the wins and losses, clearly explained knowledge sharing… all are welcome.

💬 Leave this in the comments: a link to the original Square post + one thing that makes it worth a look
Feel free to recommend your own post, or share a great post by another author. If you come across an opinion that interests you, open the original post and chat with the aut
post-image
  • 10
  • 3
What Is Trading Expectancy? How Can Win Rate, Average Profit and Loss, and Trading Costs Help Determine Whether a Strategy Has a Long-Term Edge?

In cryptocurrency trading, making money with a strategy in the short term does not mean it will work over the long term. Catching one major market move by chance can mask problems with the strategy itself. Trading expectancy helps us evaluate a strategy from a broader perspective, rather than judging it based on just a few wins or losses.

First, what is trading expectancy?

Trading expectancy is the average profit a strategy may generate per trade w
post-image
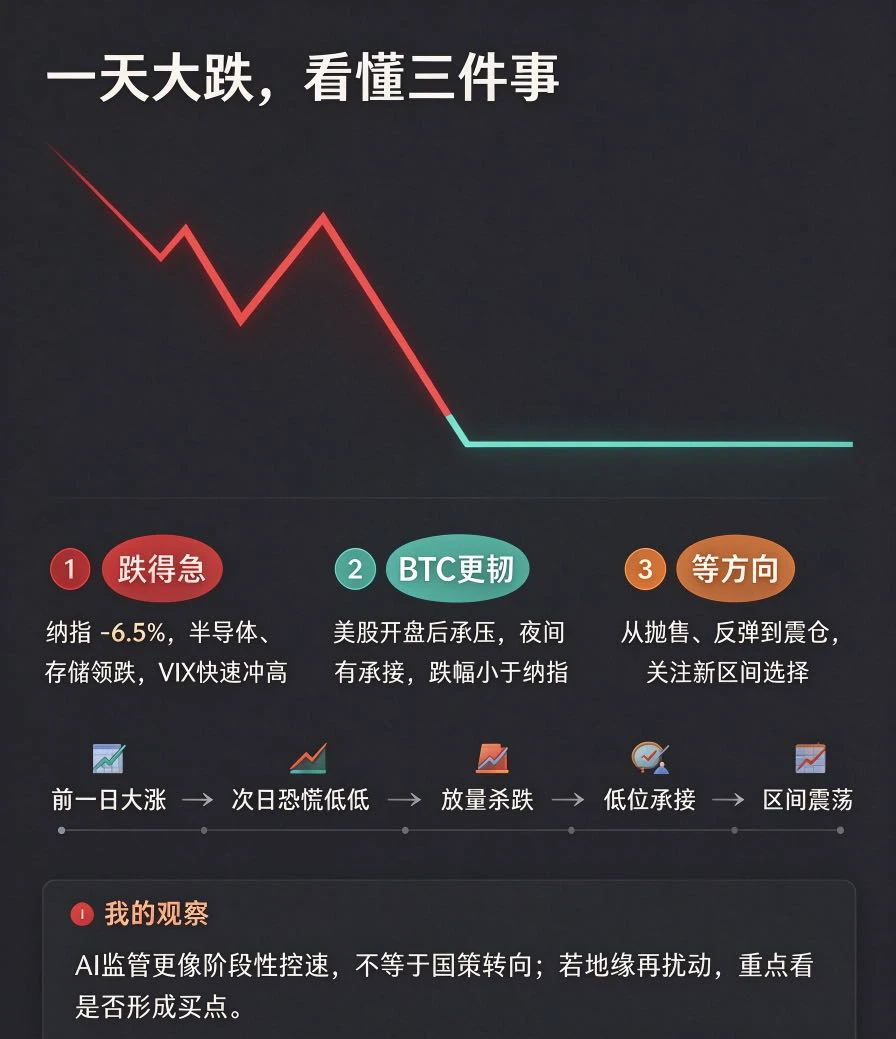
The sharp drop yesterday was simple: the market had just surged the day before, then turned around and plunged hard.
The Nasdaq fell 6.5% in a day, with memory and semiconductor stocks hit even harder. The fear index surged, trading volume swelled, and everyone panicked. There were two main triggers: the US plans to restrict data centers and tighten AI expansion, and rumors of war in the Middle East. Risk assets were all sold off.
As for Bitcoin, the drop wasn’t mainly due to heavy internal selling pressure. It was mostly dragged down after the US stock market opened, when panicked investors s
post-image
BTC-0.65%
🔹South Koreas KOSPI Plunges 8, Triggering a Trading Halt! Losses Narrow After Trading Resumes. Are
live-cover
LIVE1,995
Anyone willing to buy gold in the 4063–4080 range is betting that the momentum from NFP night hasn’t faded yet. Gold has surged so hard that a pullback is an opportunity to get in. Set your stop at 4020; if it breaks, take the loss. As for sector rotation, safe-haven funds have indeed been shifting into precious metals lately. No need to rush to a conclusion—let’s see how things play out. If you’re watching, keep an eye on #Gold.
post-image
GLDX-0.40%
PAXG+0.37%
XAU+0.38%
  • 6
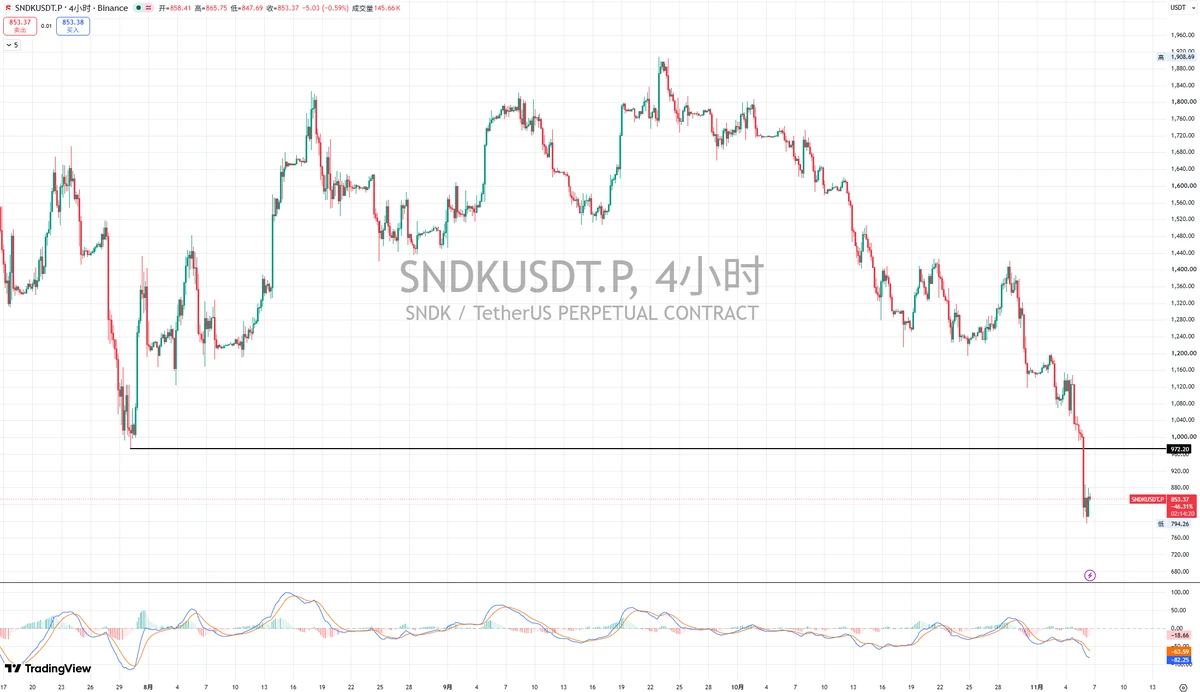
$SNDK
SanDisk SNDK
This sharp move lower has broken directly below the previous low. The difference this time is that the breakdown is valid, and there has been no recovery above that level, so this does not constitute a false breakdown.
The short-term level to watch is around 720. Watch how price reacts when it reaches that level!
post-image
SNDK-22.24%
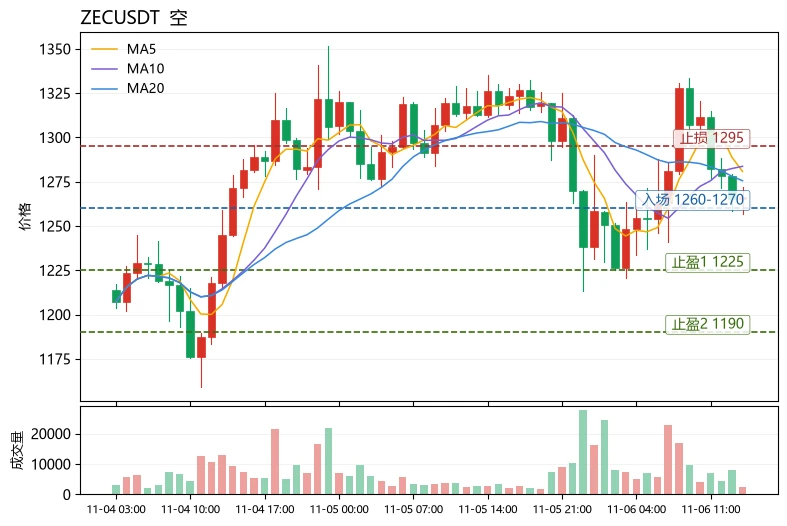
When the Fear and Greed Index falls to 28, many people’s first reaction is “time to buy the dip,” but sentiment indicators are never a buy signal on their own—they only tell you that the market is fearful, not whether that fear has ended. What really determines the short-term direction is the convergence of sentiment, sector fund flows, and BTC’s influence.
$ZEC is currently quoted at 1266.78, down 4.16% over 24 hours, with a trading volume of $276.8 million. Technically, MA5 (1280.75) remains above MA20 (1275.54), so the medium-term structure is intact, but the price has fallen below both mo
post-image
ZEC+1.16%
NEAR+1.17%
MARSCOIN-4.38%
📣 Daily standout post call|Don’t keep great posts to yourself—see you in the comments

Which post have you written recently that you’d most like everyone to take a closer look at? 🔎

Well-grounded market analysis, trading recaps that spell out the wins and losses, clearly explained knowledge sharing… all are welcome.

💬 Leave this in the comments: a link to the original Square post + one thing that makes it worth a look
Feel free to recommend your own post, or share a great post by another author. If you come across an opinion that interests you, open the original post and chat with the aut
GateSquare
📣 Daily standout post call|Don’t keep great posts to yourself—see you in the comments

Which post have you written recently that you’d most like everyone to take a closer look at? 🔎

Well-grounded market analysis, trading recaps that spell out the wins and losses, clearly explained knowledge sharing… all are welcome.

💬 Leave this in the comments: a link to the original Square post + one thing that makes it worth a look
Feel free to recommend your own post, or share a great post by another author. If you come across an opinion that interests you, open the original post and chat with the author about your thoughts.

🕒 We’ll be checking the comments for great content when we select posts this afternoon
🎁 Selected authors get 3 days of traffic support + featured content

The next standout post might be yours 👇

‍#每日神贴 #Gate广场
repost-content-media
If everyone opens short positions at market, the bearish trend will take shape in about an hour or two
post-image
  • 3
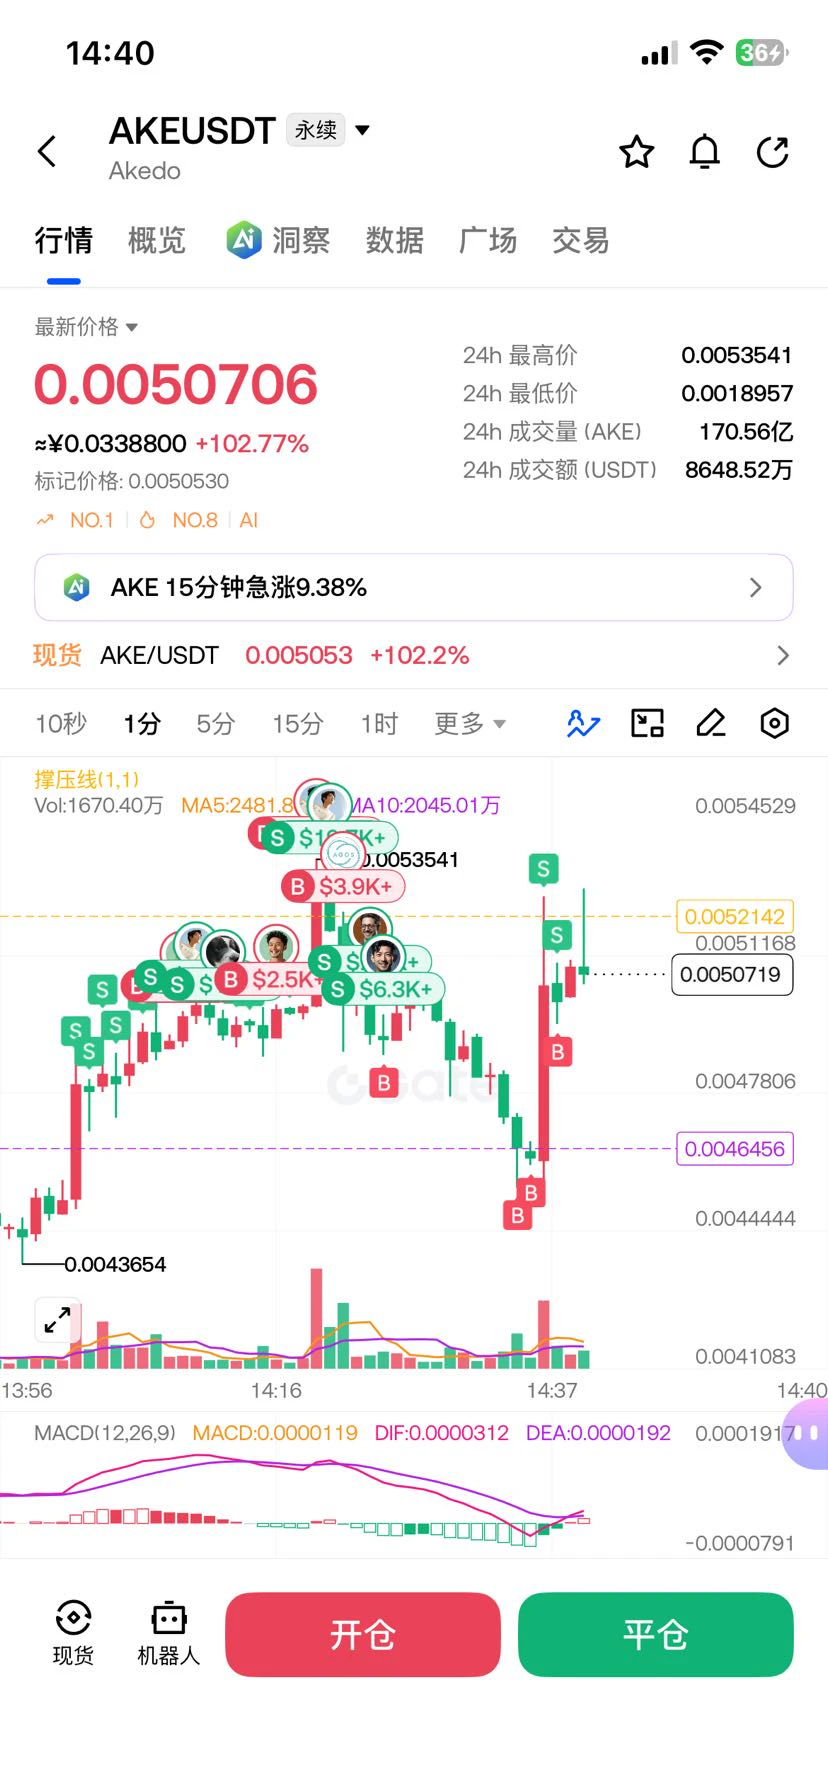
$AKE These are the real profit-makers...
post-image
AKE+6.07%
$XRP is showing signs of selling pressure after a $9.603K long liquidation around $1.1943. This suggests leveraged buyers are being forced out, potentially creating room for another downside liquidity sweep. Buyers need to defend demand and reclaim nearby resistance before a meaningful recovery can develop.
Support: $1.1800 – $1.1900
Resistance: $1.2100 – $1.2250
Next Target: $1.1600
A breakdown below support could accelerate bearish momentum, while a strong reclaim of resistance would signal improving buyer strength. Patience matters—wait for confirmation.
Let's go $XRP ‌
post-image
XRP-1.15%
The AI Stock Crash Brings Back Memories of
live-cover
LIVE1,943
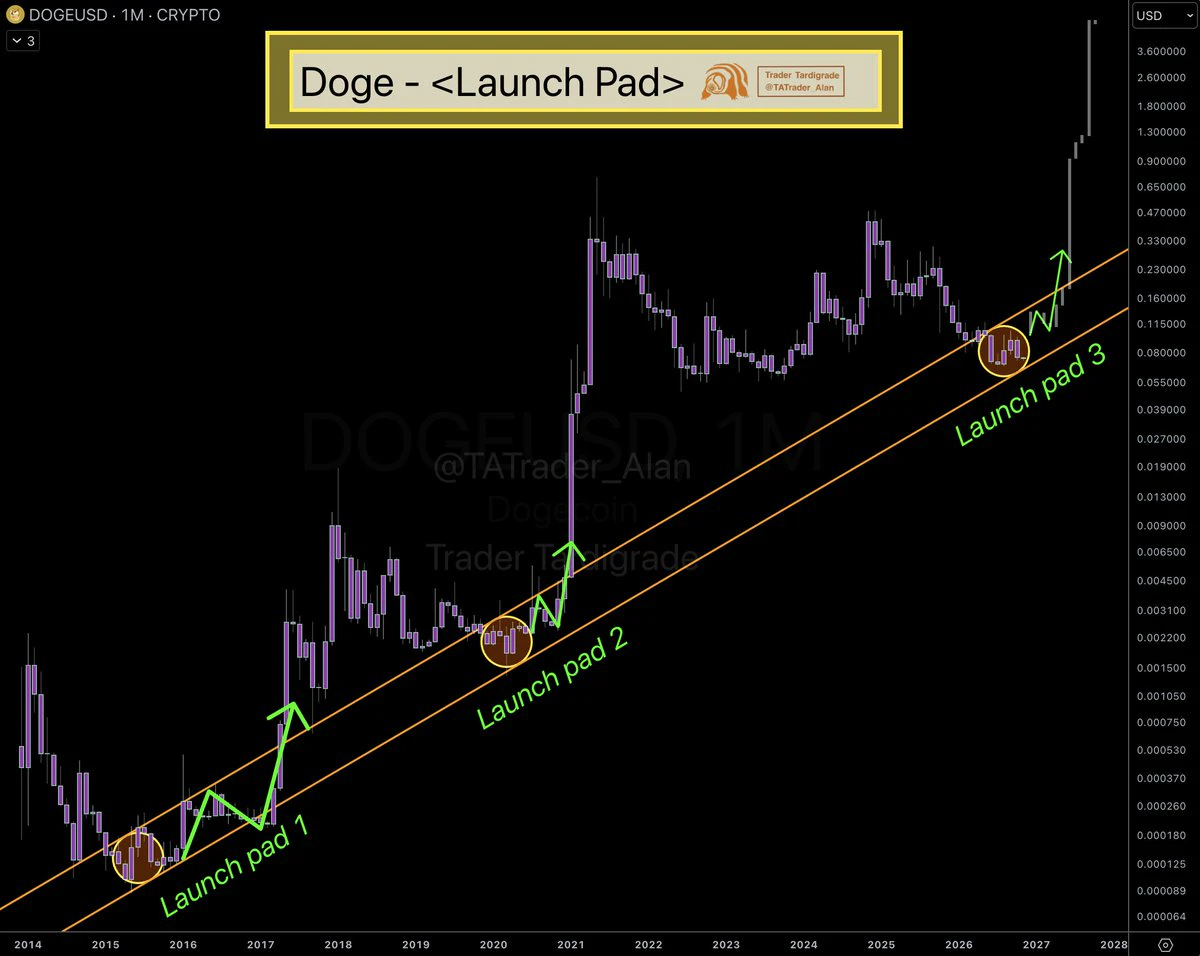
$DOGE /monthly
#Dogecoin is forming the third Launch Pad ❇️
The first two sat inside the same channel, consolidated, then took off.
Price is now back at the same spot in the channel, building the base for the next launch 🚀
post-image
DOGE-0.22%
$SYN & May coin.
Buy ZONE running.
Buy and Hold
SYN+1.57%
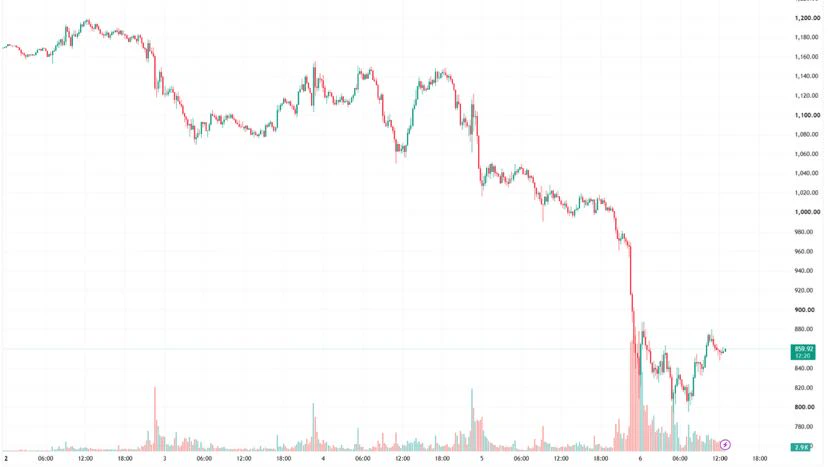
The drop in the storage sector this time has been pretty extreme 😑

SanDisk $SNDK plunged more than 22% overnight, Micron $MU fell over 17%, and South Korea's SK Hynix $SKHYNIX was also down over 13% at one point in morning trading

Several storage leaders have been hit by selling almost simultaneously. What's going on with the market? Here are some personal thoughts

Previously, the market's pricing logic for storage was very clear: the expansion of AI computing power drove HBM demand, data center investment boosted DRAM and NAND demand, and relatively tight supply further reinforced expe
post-image
SNDK-0.18%
MU-0.63%
SKHYNIX+1.41%
  • 8
#美股史诗级抛售 #每周来晒 A $2.3 trillion overnight bloodbath! Nasdaq plunges the most since 2020—could the AI rally be about to change course? — Chip stocks are “slaughtered”: short-term deleveraging or the start of a deep correction?

November 5, 2026, is destined to go down in U.S. stock market history.

At the close that day, the Nasdaq Composite plunged 5.5% to 24315, officially entering correction territory; the Nasdaq 100 sank 6.4%, wiping out about $2.3 trillion in market value in a single day and marking its biggest one-day drop since March 2020. The S&P 500 fell 4.4% to a three-month low. The M
NVDA-9.33%
AMD-17.64%
SNDK-22.24%
INTC-10.58%
TSLA-10.84%
  • 8
#每周来晒 #美股史诗级抛售
U.S. Tech Stocks Face a Historic Sell-Off: Is the AI Boom Entering a Deeper Correction?
The U.S. stock market has experienced a significant wave of selling pressure, bringing technology stocks and the artificial intelligence sector into the spotlight. The sharp decline in the Nasdaq, along with heavy losses in major technology and semiconductor companies such as NVIDIA (NVDA) and AMD, has raised important questions about the market's next direction.
This sell-off is more than just a temporary market movement. It highlights how quickly investor sentiment can change when valuat
NDAQ-2.63%
NVDA-9.33%
AMD-17.64%
#USNonfarmPayrolls $BTC $XAUUSD $SPX
‍#DailyStandouts #ShareWeekly
US Nonfarm Payrolls: One Jobs Number Could Shift the Market Narrative

The U.S. labor market is back in focus, and this time the important question is not simply how many jobs were created. Markets need to understand whether employment is still strong enough to keep inflation and interest-rate concerns alive, or whether hiring is finally losing momentum.

ADP reported that private-sector employers added 86,000 jobs in October, above the 69,000 forecast in a Reuters economist survey. That is a positive early signal, but it sho
BTC-0.65%
XAUUSD-0.96%
SPX+0.33%
  • 4
Load More

Join 40 M users in our growing community

⚡️ Join 40 M users in the crypto craze discussion

💬 Engage with your favorite top creators

👍 See what interests you

Trending Topics

USStocksFaceHistoricSelloff

2.23k Views3.59k Discussing

U.S. stocks suffered a sharp selloff on Thursday, with the Nasdaq closing down more than 5% and the Philadelphia Semiconductor Index falling over 12%. AI and chip stocks including $NVDA and $AMD were hit especially hard. Markets are reassessing AI valuations, data-center spending and future returns. Is this just short-term deleveraging, or the start of a deeper correction in the AI trade? Which sectors are you watching next?

GateLaunchesPoSECProofOfSecurity

13.06k Views580 Discussing

USNonfarmPayrolls

11.25k Views4.02k Discussing

View More