Share your thoughts
placeholder
Article
#ZEC is starting to look interesting on the monthly chart.
The bigger picture shows a long accumulation range followed by a strong breakout. ZEC has now moved above the major range resistance and is trading around $1,162.
If this breakout holds, I’d be watching the next major levels rather than chasing every candle.
Trade Setup:
Entry: $950–$1,150
TP1: $1,400
TP2: $2,250
TP3: $3,600+
SL: $820
The key level is the previous breakout zone. If ZEC can hold above it on higher timeframes, the chart could have significantly more room to run.
Invalidation below $820 would make me reconsider the bullis
post-image
ZEC+16.81%
BTC update
live-cover
LIVE1,822
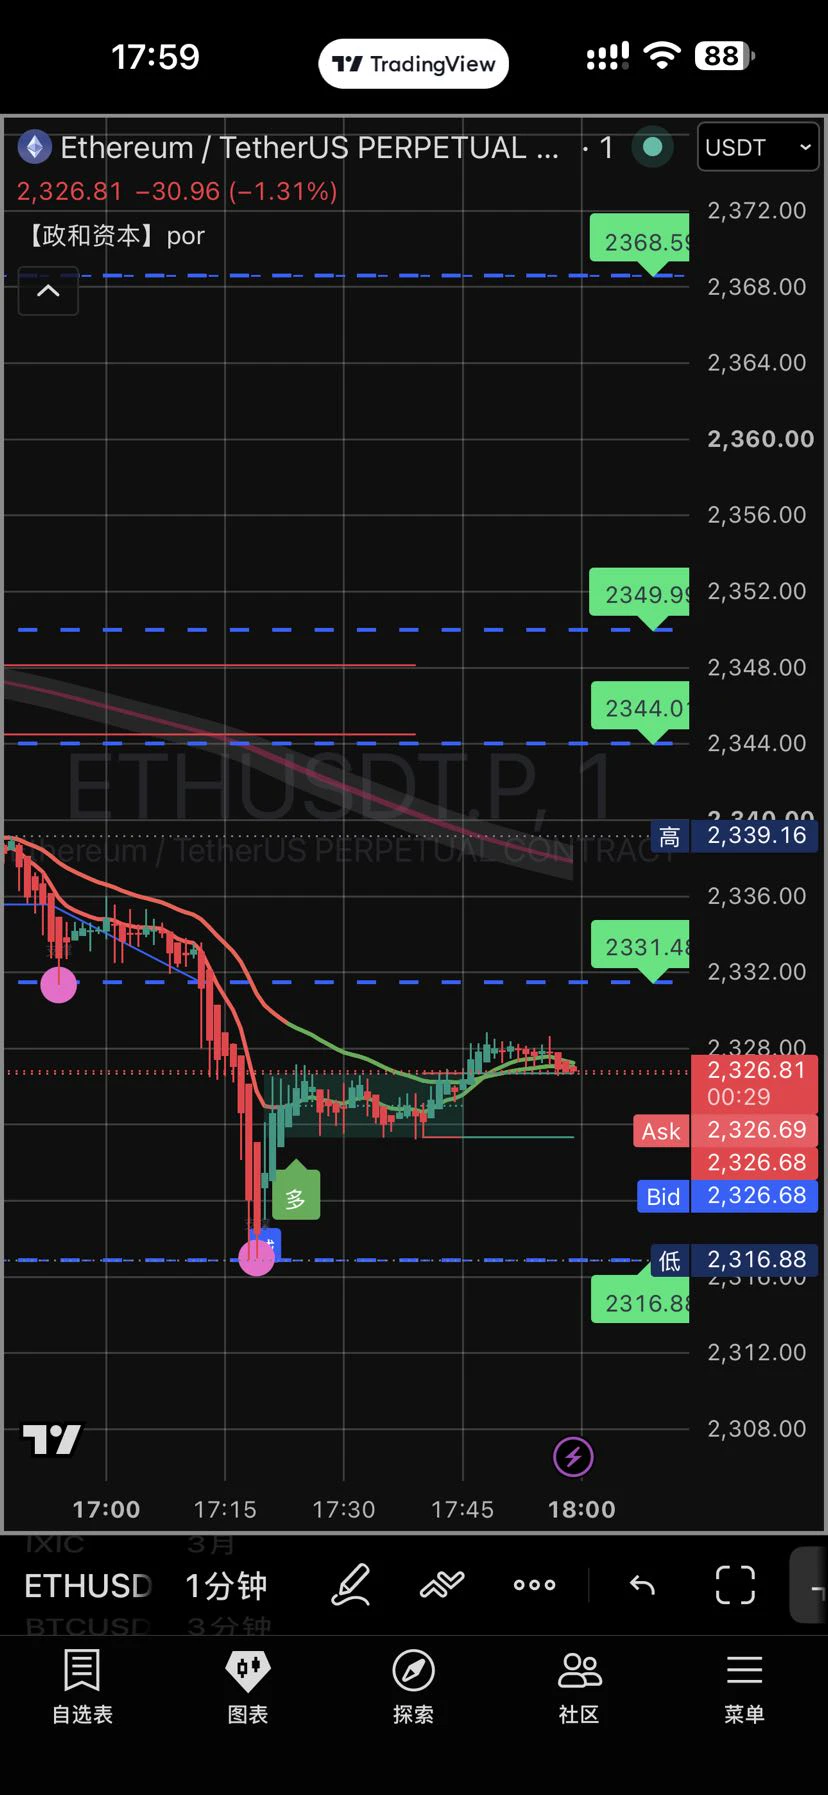
ETH’s current two phases, short and long, $ETH
have both been completed. Take profits where appropriate and exit where necessary. Making money requires gradual accumulation; you can’t be greedy at all🎉🎉
Impatience, high-frequency trading, and blindly ➕➖ positions are not sustainable🥳🥳🥳🥳.
Nice隔壁王叔
$ETH subscription post order, check promptly 🚨🚨🚨🚨 (contract plan)
ETH+1.59%
  • 12
#PI said to put it in the bag and hold it for 3 years before talking.
post-image
PI+0.91%
$IOST Signal】4H momentum continuation, 1H low-volume pullback
$IOST 4H RSI above 90, MACD bullish histogram expanding, with price consolidating at elevated levels after breaking above the upper Bollinger Band. 1H MACD histogram narrowing, bid depth share at 0.44, with sell orders clearly dominant. Funding rate 0.01%, OI stable, with no signs of a liquidation cascade for now. The current price of 0.0007782 is within the recommended entry range, while the 1H low at 0.00073 forms short-term support. Dense selling pressure is concentrated at 0.00079-0.00080 above.
🎯Direction: Long
⚡Entry/limit o
post-image
IOST+23.20%
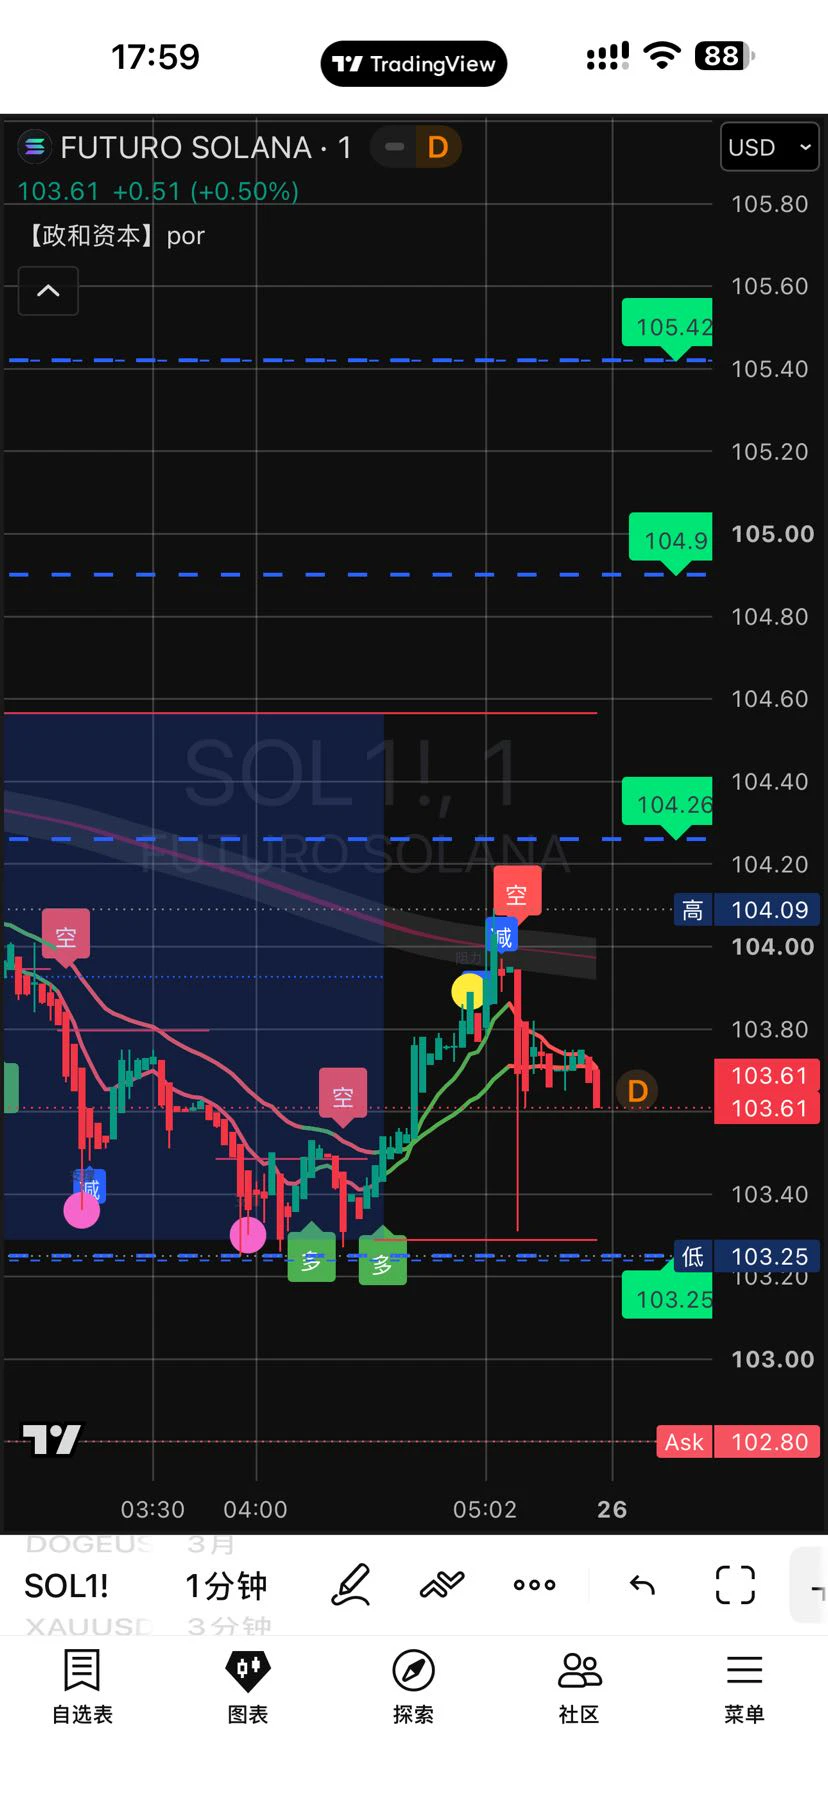
I didn’t do anything—just went to the restroom, and when I came back, the candlesticks had already done the work for me. When the market was just being dumped in the morning session, I took a glance at the volume: the rebound was weak, resistance overhead was obvious, and every push higher fell just short. This isn’t what strength looks like; it’s feeding fuel to the bears.

$SOL $ZEC
post-image
SOL+2.75%
ZEC+16.81%
How is this a rebound? This is CPR for my empty account, isn’t it? The last thing I saw before bed a few days ago, $SNXX had already surged to around 18.146, but my entry was at 13.489. At the time, I saw that every push upward fell just short and volume failed to follow—classic rebound weakness, with the bulls lacking the confidence to push higher.

I said it back then: don’t get greedy on a long rebound, and don’t get itchy-fingered trying to catch it. Hold as long as the trend remains intact; if it breaks down, get out. Don’t get emotionally attached to the market. This trade has put +166
post-image
SNXX+3.30%
XRP+0.75%
DOGE+5.72%
Oil continues to rise, as we anticipated, adding another layer of pressure to the macro picture.
Iran are reportedly organising for a major push back against the US!
If crude breaks decisively above the $92–$96 resistance zone, renewed inflation concerns could push yields higher and delay monetary easing.
That may yet provide the catalyst for the final wave lower across risk assets, including Bitcoin, before a more durable bottom forms.
#Bitcoin #BTC #Oil #Macro
post-image
BTC+0.21%
Everyone’s staring at the altcoin revival, but ADA/USDT just painted a 4h tombstone that nobody’s tweeting about yet.

ADA/USDT - SHORT

Trade Plan:
Entry: 0.2181 – 0.2193
SL: 0.2242
TP1: 0.2145
TP2: 0.2118
TP3: 0.2076

Why this setup?
- 1D trend is a *range*, not a breakout — the “safe” narrative is dead.
- 4h momentum is SHORT with 55.4 confidence, and the 15m RSI is already bleeding at 40.33 — weakness is cascading.
- Entry is armed at 0.2187 (zone: 0.2181–0.2193). If we lose 0.2125, the range floor gets tested fast.
- TP1 sits 1.9% below entry, but TP3 at 0.2076 is the real magnet
ADA+1.99%
Everyone’s chasing gold—but $XAUT /USDT just flashed a 15m RSI of 29. Who’s buying this dip?

$XAUT /USDT - SHORT

Trade Plan:
Entry: 4419.8 – 4421.6
SL: 4429.7
TP1: 4413.9
TP2: 4409.4
TP3: 4402.6

Why this setup?
- 4h bias is SHORT (Conf 55), and 1D trend is *range*—not a breakout.
- Entry zone 4419.8–4421.6 sits right under rejection; TP1 at 4413.9 is the first magnet.
- RSI 15m oversold means a dead-cat bounce could fake you out—but the range top is capped at 4432 in the alt scenario.
- Why now? Price is mid-range with bearish pressure building; the 55% confidence says probability,
XAUT-0.13%
Everyone’s long silver while the 4H quietly whispers “sell”—are you listening?

$XAG /USDT - SHORT

Trade Plan:
Entry: 66.21 – 66.25
SL: 66.44
TP1: 66.07
TP2: 65.96
TP3: 65.81

Why this setup?
- $XAG /USDT is pinned at 66.23 with a **SHORT** bias (55% confidence) despite the daily range.
- RSI on the 15m is already cooling to 42.6, and ATR on the 1H (0.088) shows a tight coil—breakouts get violent.
- Why now? Price is stalling under resistance with TP1 at 66.07 and TP2 at 65.96, only 0.4% away—momentum favors the downside before the daily range traps you.

Debate:
Are we fading this po
XAG+0.02%
‼ The year's lowest four gt half-price offer ends tonight, with a 90% win rate and over 600 subscribers🎉making profits every day for nearly a month🀄️Today's futures/spot updates are live👇
https://www.gate.com/zh/profile/Little Ghost Daily Futures
🔥Recently made over $5.1 million in consecutive profits‼️Last week: 62700/1865+ 75600/2360 long-term long, 81500/2545 profits pocketed: $1.62 million📈Shandi 182 short at 1420, profits pocketed/ reversed to long at 1440, 1770 doubled the position, $800,000📈Friday morning: 81500/2530 short, 78600/2430 profits pocketed📉Evening: 78800/2435 wick lon
GT+6.38%
  • 10
Everyone’s staring at XRP’s range—but the 4h chart is silently building a trapdoor.

$XRP /USDT - SHORT

Trade Plan:
Entry: 1.4152 – 1.4198
SL: 1.4400
TP1: 1.4006
TP2: 1.3894
TP3: 1.3726

Why this setup?
Why now? The 1D trend is *range*, not uptrend—so longs are renting, not owning.
- RSI 15m at 46.53: no oversold bounce fuel left.
- ATR 1h is thin (0.0093): a weak push to 1.4175 entry = low-risk short.
- Invalidation at 1.4078 is close—meaning the downside from 1.4175 to TP1 (1.4006) is a clean 1.2% slide, no drama.
- If 1.4152 breaks, TP2 at 1.3894 is the magnet. This isn’t a gamb
XRP+0.75%
We're so close to graduating $ZIVIDEND on @LaunchOnSF !!!
Let's push this higher guys!
zcash:native pay out automated. $256 already distributed!
The ZIVIDEND flywheel about to hit
22.k$ MC -> $1m MC -> $100m MC
The sky is the limit
Let's SEND THIS HIGHER!!!
ZEC+16.74%
SEND-6.15%
$ZIVIDEND!!!
33.3K$ MC
HIGHER WE GO
Free zcash:native dropping in your wallet!
post-image
ZEC+16.74%
BTC & ETH Test Their Monthly Range! Could September Bring a Major Directional Break?
live-cover
LIVE1,389
Spent a year!
Watched tens of thousands of ads for the platform,
accumulating ¥136 in earnings.
And in the end, it still couldn’t be withdrawn.
Kind of insulting.
post-image
$ZIVIDEND coded
Be early
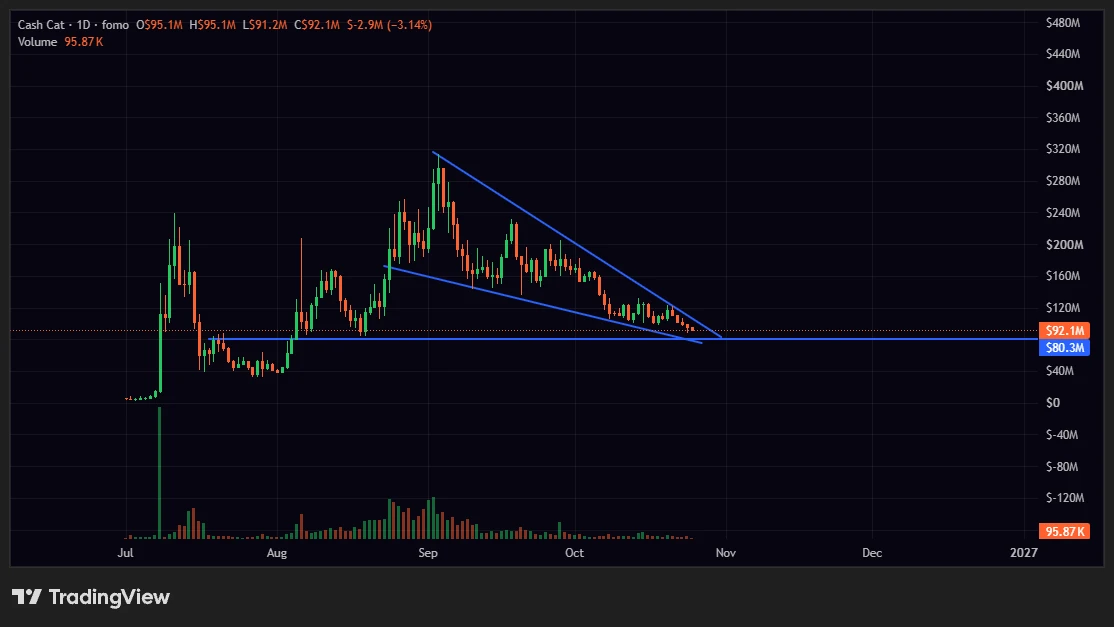
It's already on FOMO 👇👇👇
post-image
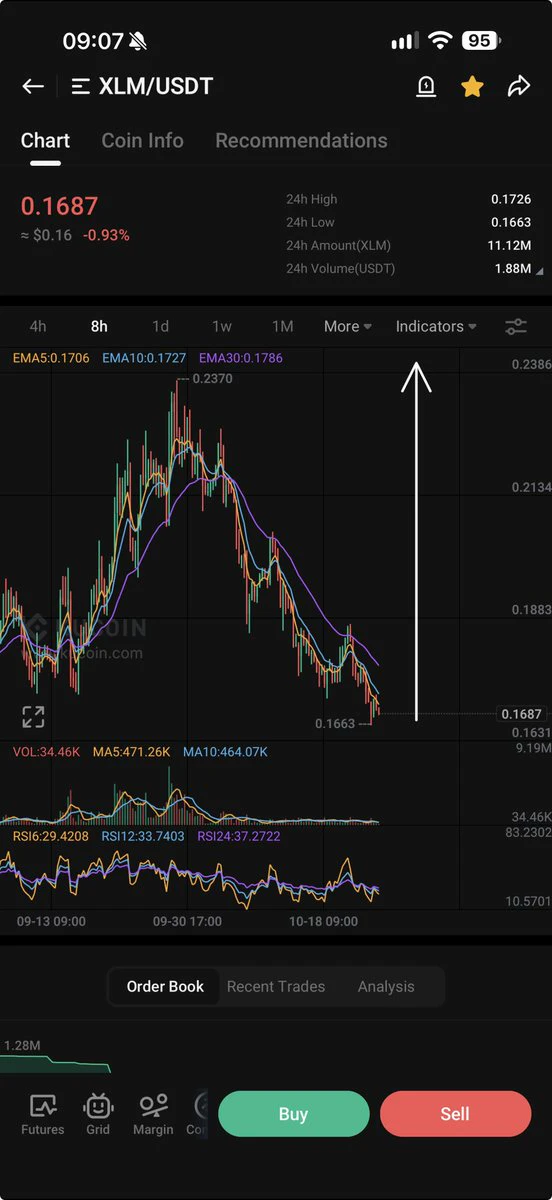
Most traders are watching XLM upside while the 4h chart quietly whispers otherwise.

XLM/USDT - SHORT

Trade Plan:
Entry: 0.18518 – 0.18592
SL: 0.18914
TP1: 0.18286
TP2: 0.18107
TP3: 0.17838

Why this setup?
Why now? The 1D trend is range, not breakout—so the 55% SHORT bias isn't fighting momentum, it's fading it.
• RSI 15m at 48.9 = zero bullish fuel left for a push above 0.18592.
• ATR 1h (0.0015) shows volatility is tight—perfect for a grind to TP1 (0.18286) before the trap zone at 0.18266.
• Entry sits mid-range at 0.18555, but the alt (long) setup is invalid below 0.18196—meaning
XLM+1.42%
Load More

Join 40 M users in our growing community

⚡️ Join 40 M users in the crypto craze discussion

💬 Engage with your favorite top creators

👍 See what interests you

View More