





Square
Following
Hot
News
Notifications
Profile
Share your thoughts
placeholder
Article
$MITO This coin's about to moon—grab some
post-image
MITO+8.51%
$UNI 4.737, 24H +5.71%. 1h RSI at 77 is overbought, and volume is only 0.28x the average. Resistance at 4.789 remains unbroken. I’m watching this level closely: I’d only look higher if it holds above 4.789; if it pulls back, I’ll wait and see. Not investment advice
#UNI #Uniswap
post-image
UNI+3.05%
Trenches
IDOL
I
bade
b
IDOL
0x3b...ab07
Market Cap
$.
Change
.
24h Vol
$.
Holders
.
PIEVERSE
P
bade
b
PIEVERSE
0x0e...25a9
Market Cap
$.
Change
.
24h Vol
$.
Holders
.
FIONA
F
bade
b
FIONA
B34n...pump
Market Cap
$.
Change
.
24h Vol
$.
Holders
.
JAGENT
J
bade
b
JAGENT
0x8e...ae15
Market Cap
$.
Change
.
24h Vol
$.
Holders
.
Singularity
S
bade
b
Singularity
7R4M...pump
Market Cap
$.
Change
.
24h Vol
$.
Holders
.
BTC MARKET UPDATE
live-cover
LIVE737
BTC-0.67%
Examples of things bought after waking up at 3 a.m.:
😅😅😅
post-image
#XRP #WCTCS9
XRP near $0.93 is forcing investors to confront a difficult reality: a recognised brand and established payments network do not prevent a brutal decline when liquidity disappears and confidence weakens. The question is why sellers have taken control, what could stop the falls, and what evidence would confirm buyers are returning. The answer requires examining flows, leverage, macro pressure and technical structure before buying again.

WHY XRP HAS FALLEN SO SHARPLY

Leveraged long positions were forced out as important support levels broke. CoinDesk reported that XRP fell roughly
XRP-1.15%
BTC-0.67%
  • 2
What did you go through during yesterday’s 10,000-point BTC bloodbath? Did you hold your position until you couldn’t sleep, or get liquidated outright?

I looked through the live trading updates in a bunch of aggregator groups:
1. Miya bought the dip at 57500 and banked 2900 points;
2. Feiyang went long at 55300 and took home 5100 points;
3. Gong Youcai nailed the bottom at 55000, making 4000 points;
4. Da Biaoke bought at the 55500 support level and made 4900 points;
5. Even the folks trading ETH in the Colosseum pocketed solid gains. No need to look at much more—that’s enough.
These were all
BTC-0.65%
Nov 22 morning session: ETH resumed moving sideways after a rebound. Watch the 1674–1692 range first.

There is support at 1674–1676, where you can wait for a brief long opportunity after the price stabilizes. If it fails to break through 1689–1692, watch for a pullback. If it later holds above 1692 on increased volume, look next at 1697–1705; if it breaks below 1672, watch 1663 and 1653.

My approach is to stay mostly inactive in the middle and wait for confirmation at key levels. Don’t let a sharp rally or sell-off throw off your rhythm. The key now is which of these two levels gives a direc
post-image
ETH-1.23%
  • 3
#USNOVJoblessClaimsBeatExpectations #ShareWeekly

US Jobless Claims Rise Above Forecast: Why a Cooling Labor Market Is Not Enough to Change the Fed’s Direction

The latest U.S. unemployment claims report has delivered an important message to financial markets: America's labor market is gradually losing momentum, but it is not weakening fast enough to force the Federal Reserve to abandon its restrictive monetary policy. This distinction is becoming increasingly important for investors as inflation concerns, interest-rate expectations, and institutional liquidity continue to influence global fi
BTC-0.67%
US500-3.01%
US30-1.48%
BLK-3.02%
IBIT-5.97%
#SKHynix #WCTCS9 #ShareWeekly
SK HYNIX AT 770 USDT: Is This a Buying Opportunity or a Warning Signal? Full Market, AI Memory, HBM, Fundamental and Trading Strategy Analysis

SK hynix is standing at the centre of the global AI memory story, but strong business performance does not mean its share price can only move upward. At the reference price of 770 USDT supplied for this analysis, the key question is whether the recent weakness represents a temporary correction inside a powerful semiconductor cycle or the beginning of a deeper valuation reset. My approach is to separate the company's opera
  • 3
$BMT Short thesis update:
On the 4-hour timeframe, price is trading in the 0.02016–0.02023 range. I’m watching to see whether sellers step in around this area. If price reclaims 0.0206, the bearish thesis for this move is invalidated—momentum and structure are what matter.
The current 4-hour quote is 0.0202, below the EMA50 at 0.0206, so bears remain in control. The 1-hour RSI reads 49, with no overbought or oversold extremes so far.
Short zone: 0.02016–0.02023. Targets in order: 0.01997, 0.01981, 0.01959. Stop-loss: 0.02058
The above is only my personal opinion and does not constitute financ
post-image
BMT+5.93%
Nvidia shares failed to bring any cheer to investors, slipping to the $130 level in weekend trading. The sharp decline from the stock's peak of $243 can no longer be dismissed as a mere "market correction." The formal investigation launched by the U.S. Securities and Exchange Commission (SEC) into the company’s accounting practices has served as the primary catalyst for this downturn.

So, what does this investigation signify, and why has it shaken the stock price so profoundly?

Looking first at the company itself: as the driving force behind the artificial intelligence revolution, Nvidia has
post-image
User_any
$NVDA ‌
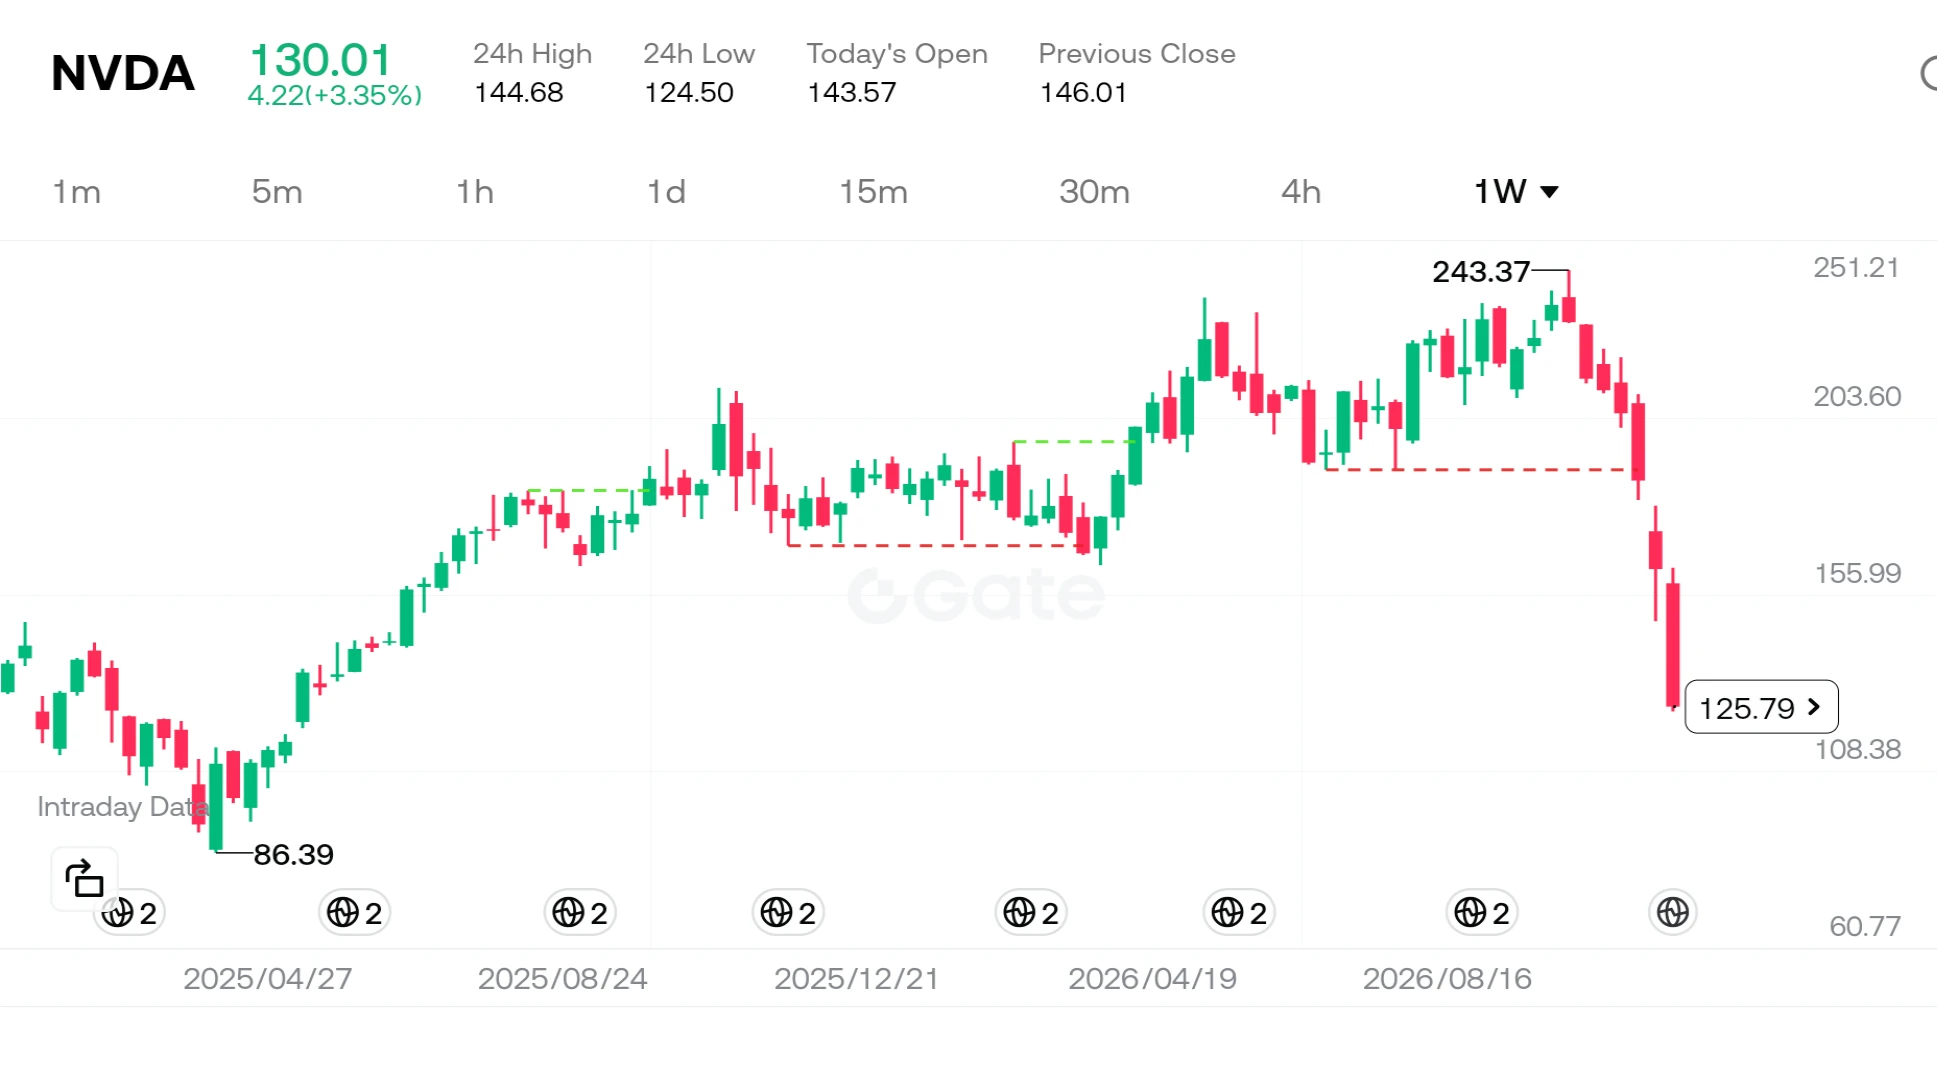
Nvidia has been losing ground for seven consecutive weeks—a trend not seen since 2008. The stock plummeted 14% last Friday alone, bringing its total decline over this seven-week period to approximately 46%. As clearly illustrated on the chart, the price has retreated from a peak of $243 to the $125 range. So, what is the story behind how this once-most-valuable company reached this point?
In reality, this is not merely a stock market correction; it is the result of three major, intersecting storms hitting the same vessel.
First, let’s look at the company’s internal dynamics. Uncertainty within management following a CEO transition, combined with the SEC’s decision to investigate the company’s accounting practices, has severely shaken market confidence. But that is not the whole story. The massive scale of spending on artificial intelligence has led investors to ask: "So much money is being spent—but when will we see a return?"
Meanwhile, macroeconomic headwinds have also shifted. Minutes from the Federal Reserve’s meetings indicate that nearly all officials expect interest rate hikes to continue. A high-interest-rate environment exerts significant pressure on growth stocks, which are valued based on their projected future cash flows. This situation has impacted not only Nvidia but the S&P 500 as well; the index fell 8.6%, marking its worst week since April 2025 and pushing it into correction territory.
Even the major Anthropic IPO that took place last week was not enough to halt this wave of selling. For many analysts, this situation serves as proof that the market is no longer focused on "new narratives," but rather exclusively on "cash flow and profitability." The fact that gold and silver have fallen to their lowest levels in over a year, combined with oil’s decline for the third consecutive week, highlights just how fragile risk appetite has become. Investors have effectively "retreated to their corners."
The most important lesson for individual investors here is that, regardless of how strong a company’s operational performance may be, macroeconomic headwinds and management uncertainties can fundamentally shake its valuation. Nvidia’s core business model remains robust, yet the market is currently pricing in risks rather than the company’s growth story. In times like these, the wisest approach is to avoid leverage and—instead of attempting to call the "bottom"—wait for prices to stabilize.
Do you believe this decline in Nvidia presents a long-term investment opportunity, or are we witnessing the deflation of an artificial intelligence bubble?
#Nvidia #Macro #TechStocks
#ShareWeekly #WCTCS9
Not investment advice.
repost-content-media
NVDA-13.84%
  • 9
  • 3
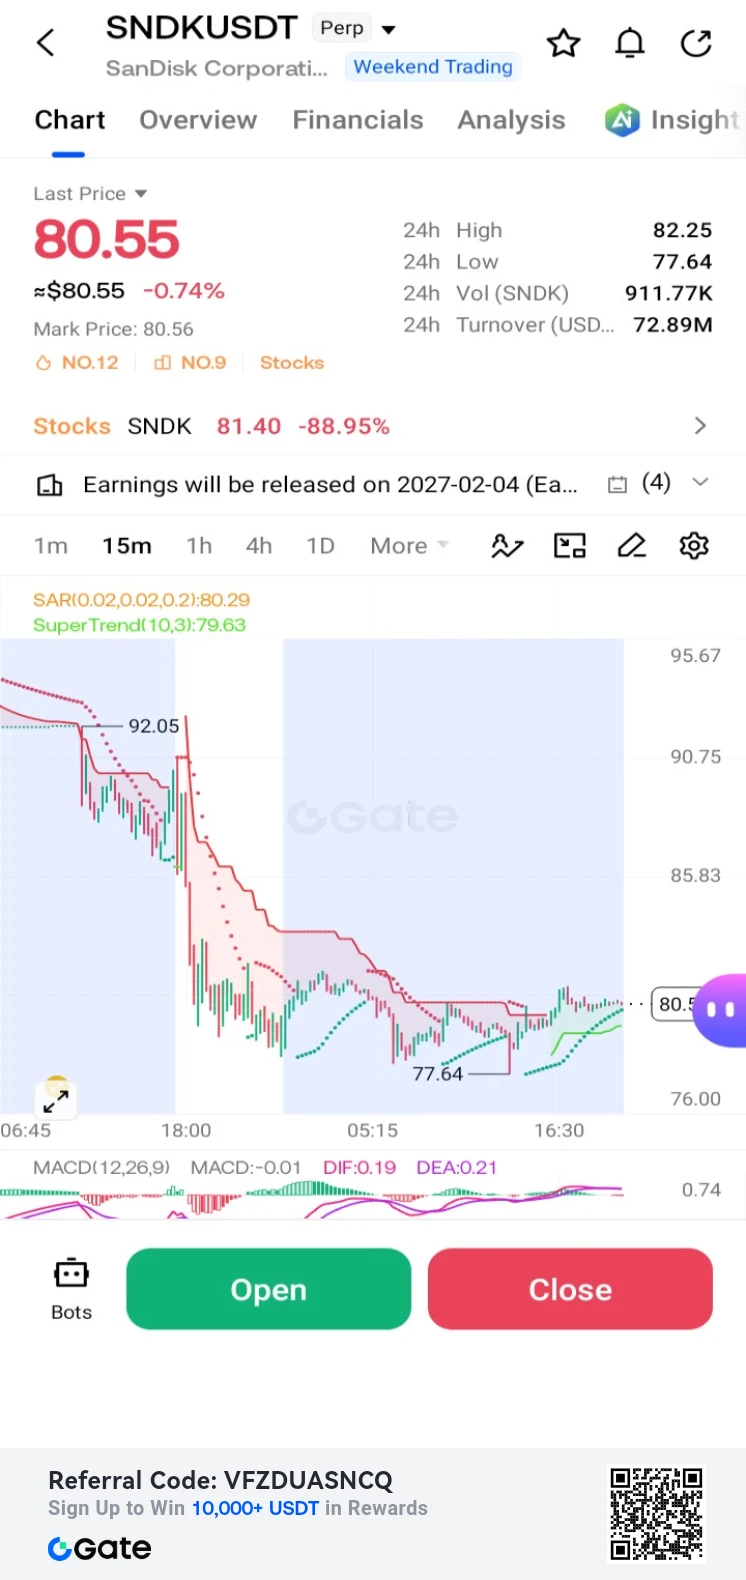
$SNDK /USDT Perp – "Bearish Consolidation – Short"**
Trading Plan Short $SNDK
Entry: 80.55
SL: 85.83
TP1: 77.64
TP2: 76.00
SNDK is down -0.74% and struggling to gain upward momentum. MACD is flat but negative; targeting a break below the 77.64 current low.
#GateDirectIPOPhase3ANTAllocates92100Shares
post-image
SNDK-0.18%
#BTCBreaksBelow60K
Bitcoin $BTC Breaks Below $60,000 Is a Weekend Rebound Coming, or Is More Downside Ahead?

Bitcoin is facing another important test as selling pressure pushes the market into a more uncertain phase. On November 20, BTC briefly dropped below the psychologically significant $60,000 level reaching its lowest price since July, according to the figures shared in the market update. This move has caught traders' attention because $60,000 had become a major level that many investors were watching as potential support. Now that BTC has slipped below it, the biggest question is whe
post-image
BTC-0.67%
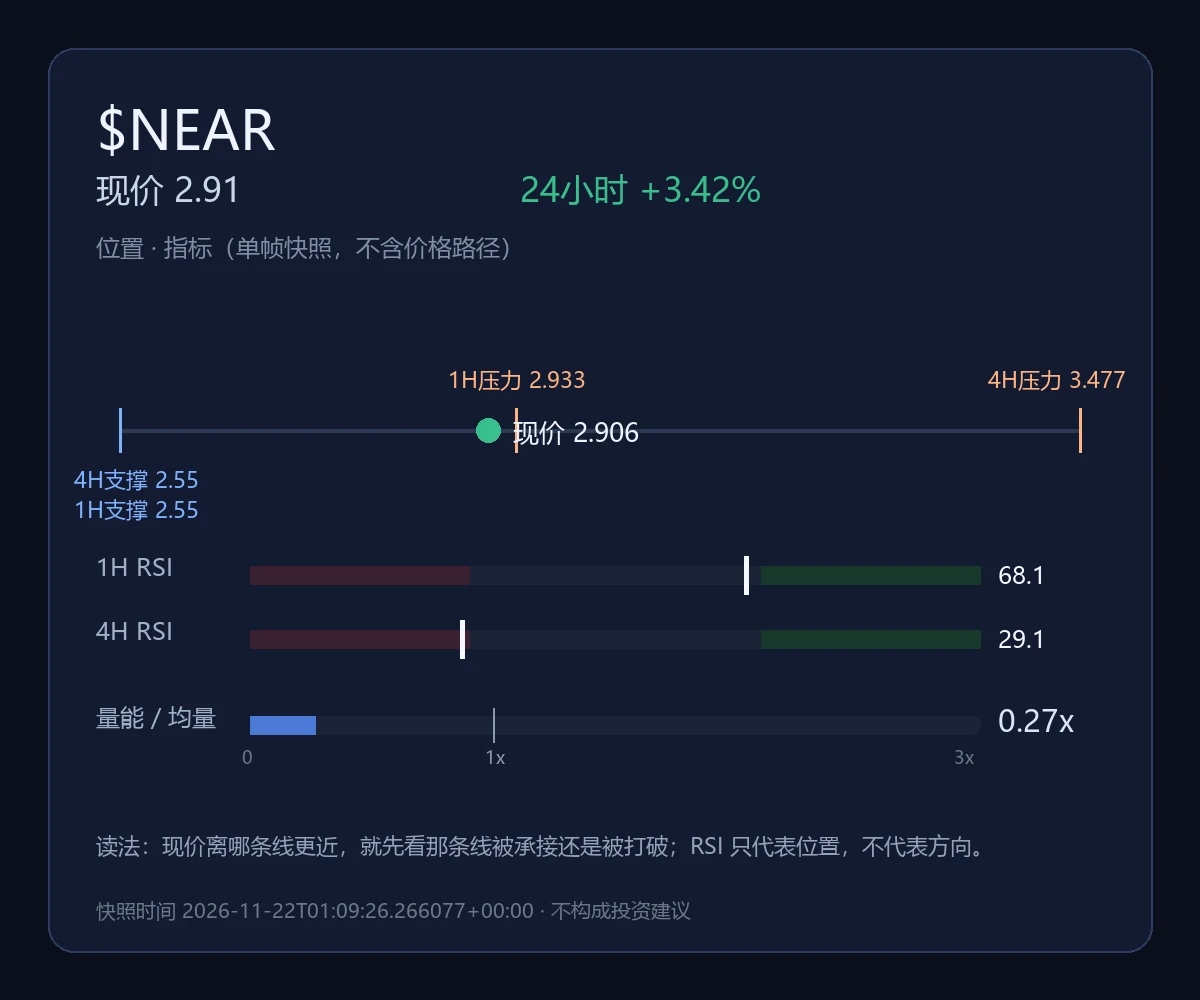
$NEAR The 1-hour timeframe is relatively strong, with RSI at 68, but the 4-hour timeframe is weak, with RSI at 29. The two timeframes are directly at odds. The current price of 2.906 is right near 1-hour resistance at 2.933. A 3.42% gain paired with a 0.27 volume ratio makes it clear nobody wants to chase higher. Wait for confirmation. A break above 2.933 would confirm the move; a drop below 2.55 means an immediate stop-loss. Don’t rush to pick a side amid the disagreement—let price show the way. Not investment advice.
#NEAR #NEAR #Cryptocurrency
#量化达人# Let's talk about quantitative trading an
post-image
new streamer Bth predictions markets predictions
live-cover
LIVE1,013
BCH+1.05%
BNB-0.76%
BLESS-2.00%
BTC-0.67%
BTC-0.67%
https://www.gate.com/zh/competition/Annual-Gala
The year-end gala voting event is now open to fan support. Support Cold Salad Killer 2, and remember to enter the raffle. The top 20 by points will receive generous prizes.
post-image
  • 1
I spent the whole day running around taking care of business at the Commerce Bureau, without wearing any jewelry.
In the face of power, people are as insignificant as ants.
post-image
This round keeps only 6 strong signals: MMT, IDOL, VVV; 3 longs and 3 shorts. Check volume and structure before acting. Last round: 3 wins, 3 losses, with a 16.3% drawdown. SUI and PIEVERSE turned green and were closed for profit; 11 positions currently held, averaging +0.6%. Wait for confirmation. 🎯 Last round's returns: SUI entry $0.6185 → exit $0.6440, 5.0x leverage, +11.6%; PIEVERSE entry $2.9670 → exit $3.2877, 5.0x leverage, +32.6%━━━ Market View ━━━BTC 60,175 +2.1%, with disagreement between bulls and bears persisting; negative funding rate data is temporarily unavailable, and capital
post-image
MMT-2.35%
IDOL-6.71%
VVV+0.37%
SUI-1.05%
PIEVERSE+0.58%
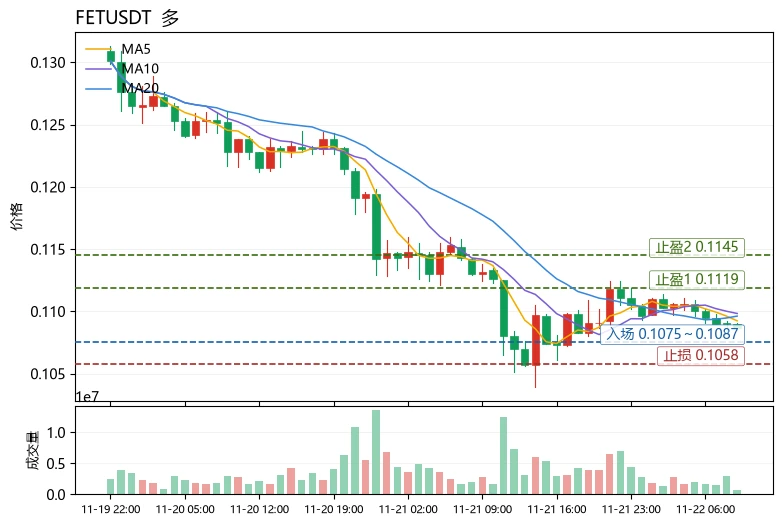
The Extreme Fear Index is only 11, while $FET ’s funding rate is -0.0346%. The price has fallen 3.72%, yet shorts are still paying longs. This is the most unusual detail in today’s market: shorts remain crowded amid extreme fear, but the cost of holding positions has started to penalize those chasing the downside.
Technically, MA5=0.10924 remains below MA20=0.10962, so the moving averages have yet to turn bullish. However, the MACD histogram has turned positive at +0.0002673, RSI=39.5 is weak but not oversold, and the Bollinger lower band at 0.107322 has recently been a frequent area for sharp
post-image
FET-1.52%
ZEC+1.16%
ADA-1.48%
Load More

Join 40 M users in our growing community

⚡️ Join 40 M users in the crypto craze discussion

💬 Engage with your favorite top creators

👍 See what interests you

Trending Topics

BTCBreaksBelow60K

2.1M Views30.1K Discussing

BTC fell below $60,000 on November 20 for the first time since July, alongside a tech stock selloff and broader pressure on risk assets. Will $60K become resistance, or can BTC quickly reclaim it? What price or volume signals would convince you that selling pressure is easing?

GateDirectIPOPhase3ANTAllocates92100Shares

802.9K Views4.9K Discussing

NvidiaDropsNearly14Percent

336.1K Views7.6K Discussing

View More