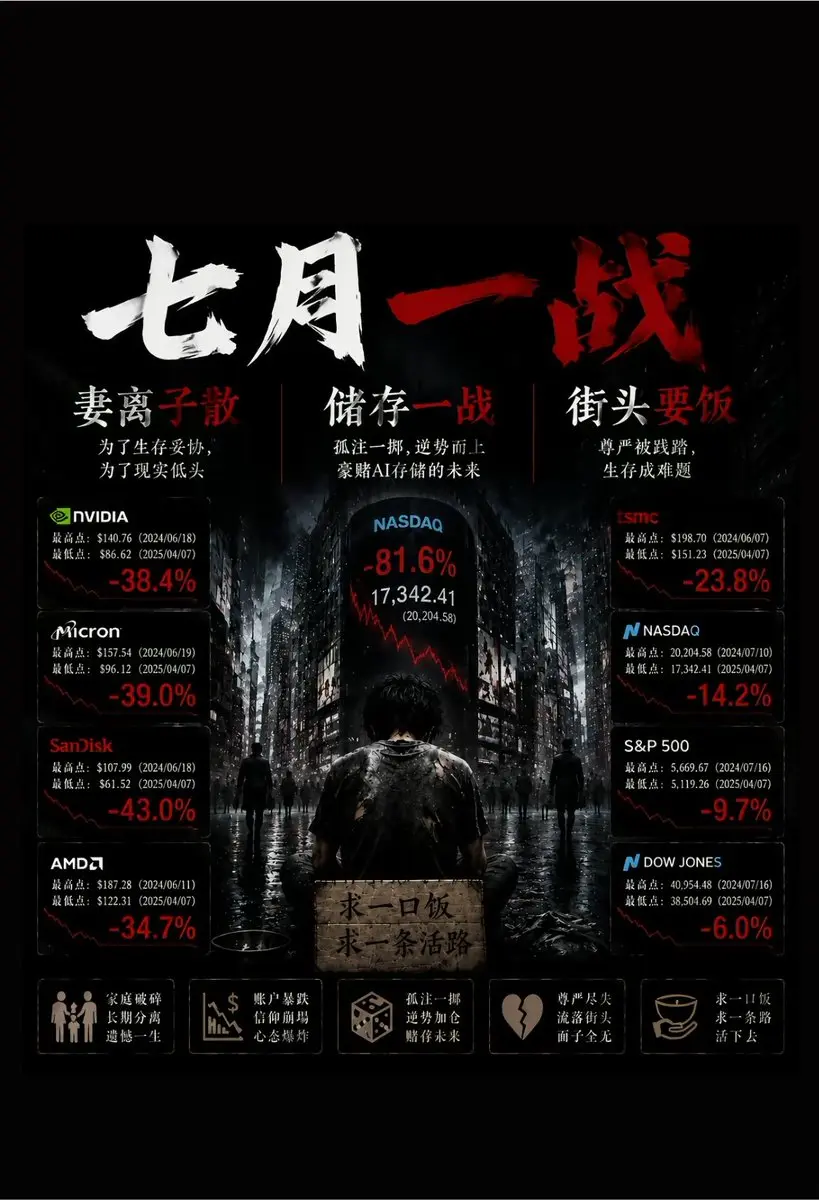


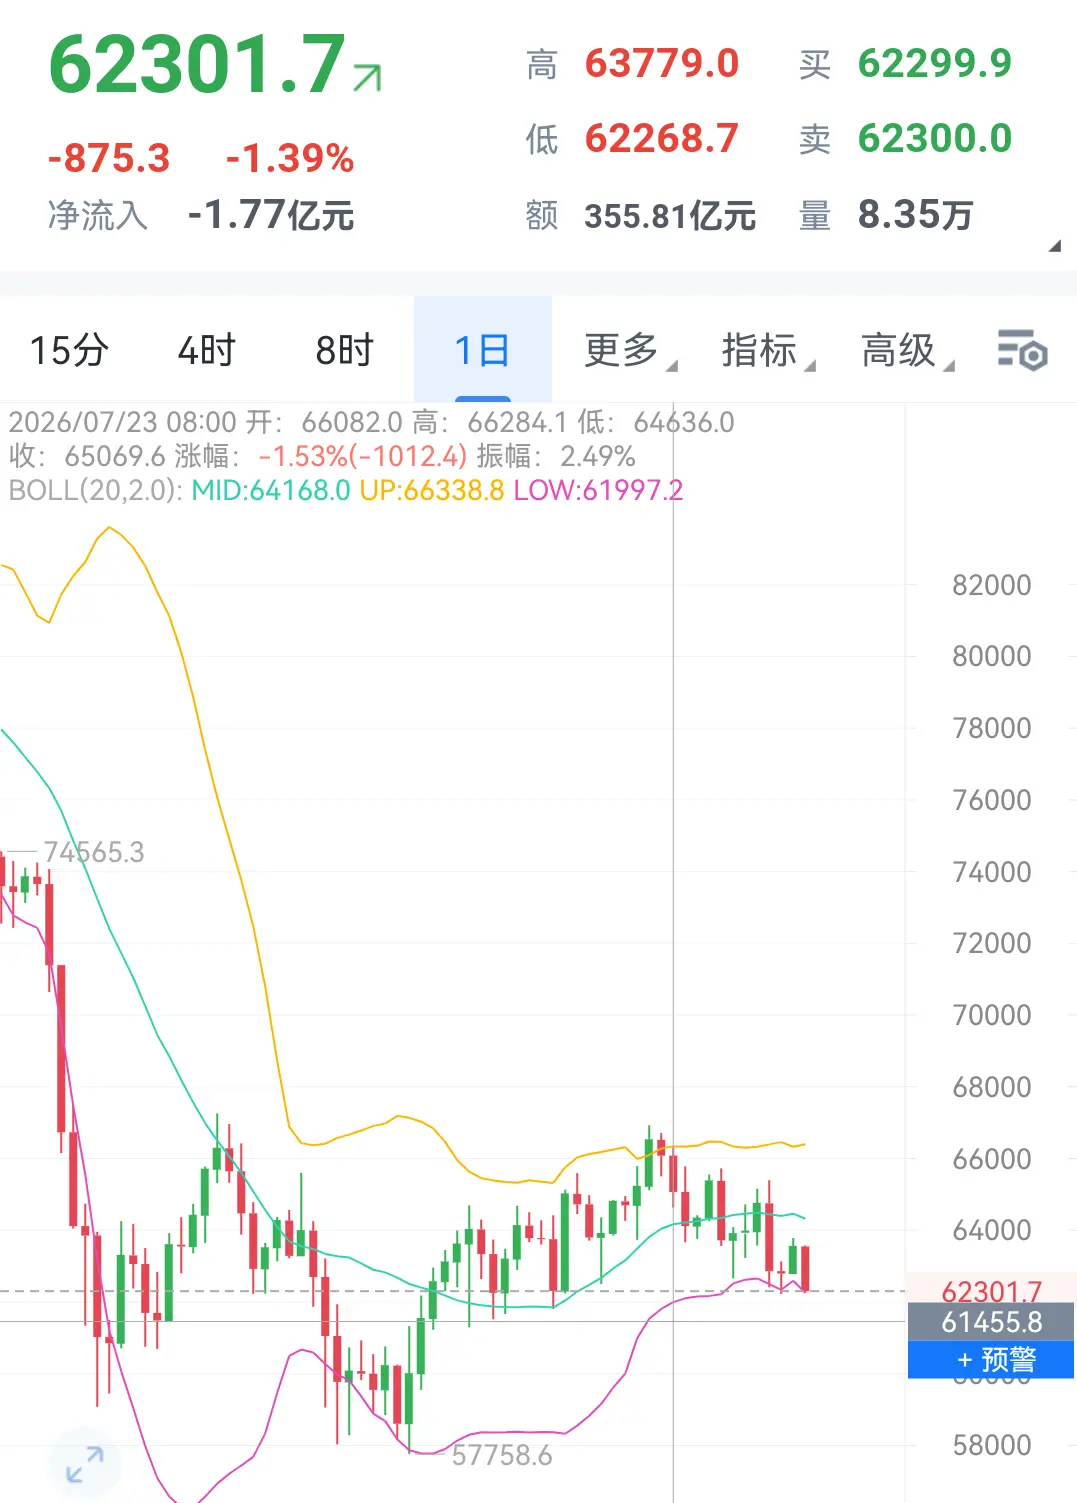


August 2, evening—good evening! BTC at around midnight rose from the bottom 62,227 to 63,618, then pulled back to 63,040. Looking at the hourly timeframe, the evening is mainly in the band/tending range at around the pivot; this week, there were a total of five bounces, three dips, and 788 oscillations. The combined closing is around 9400+380 points.
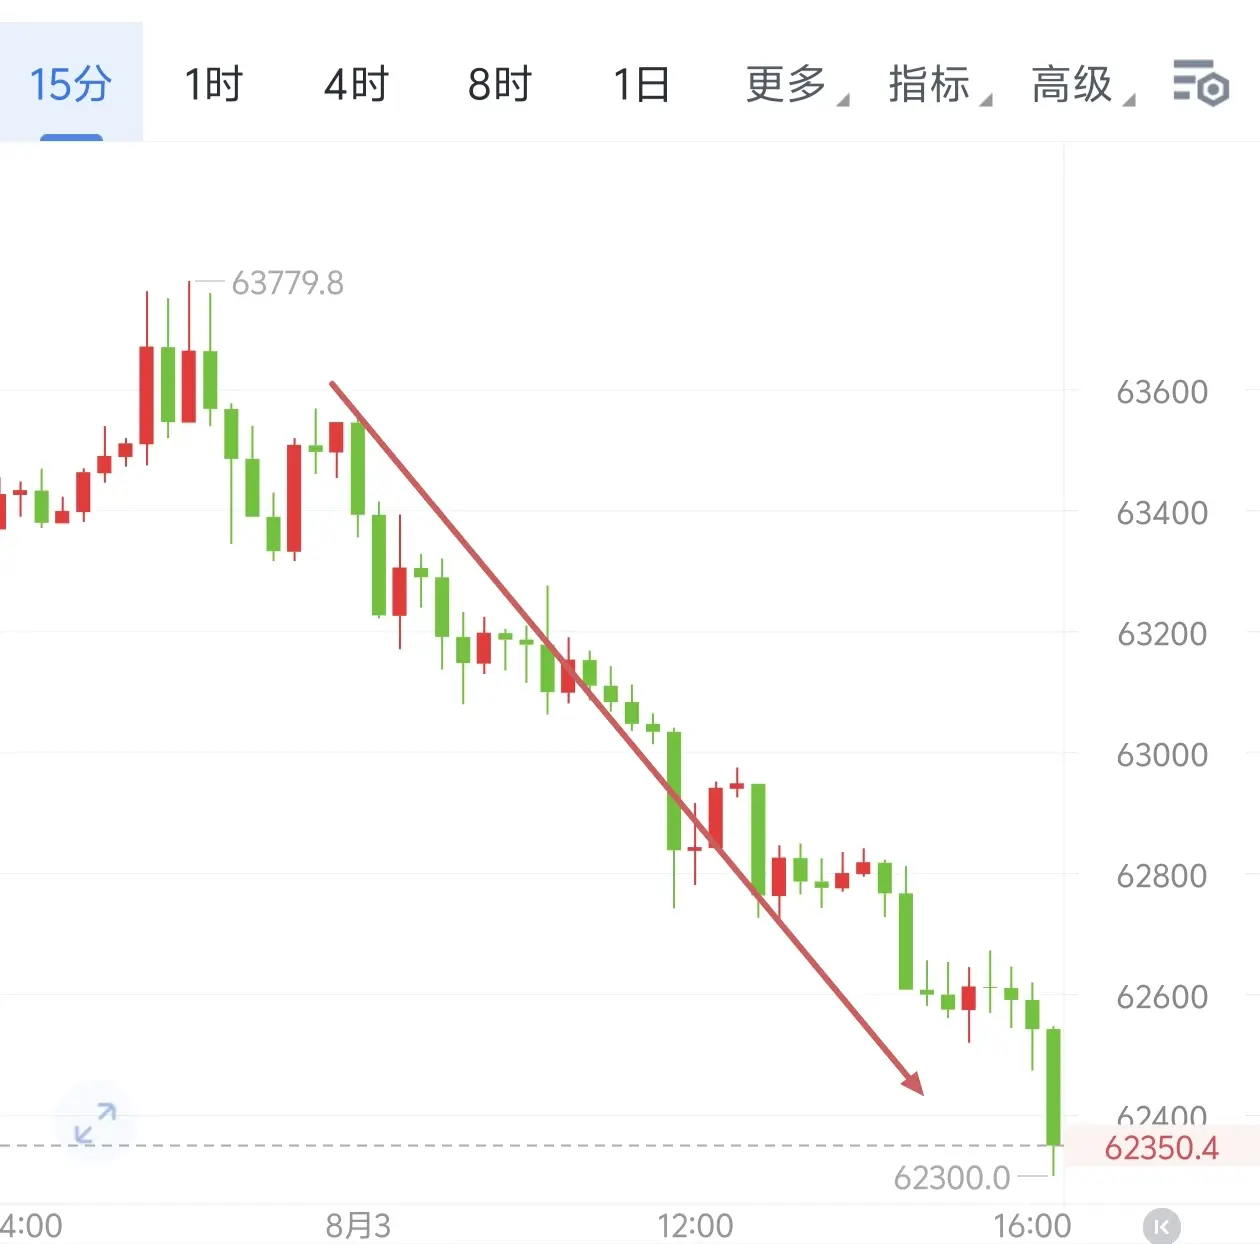
$BTC Mingyuan, on 8/2 evening: bounce around 63,500–64,000, watching toward 62,600–62,000.
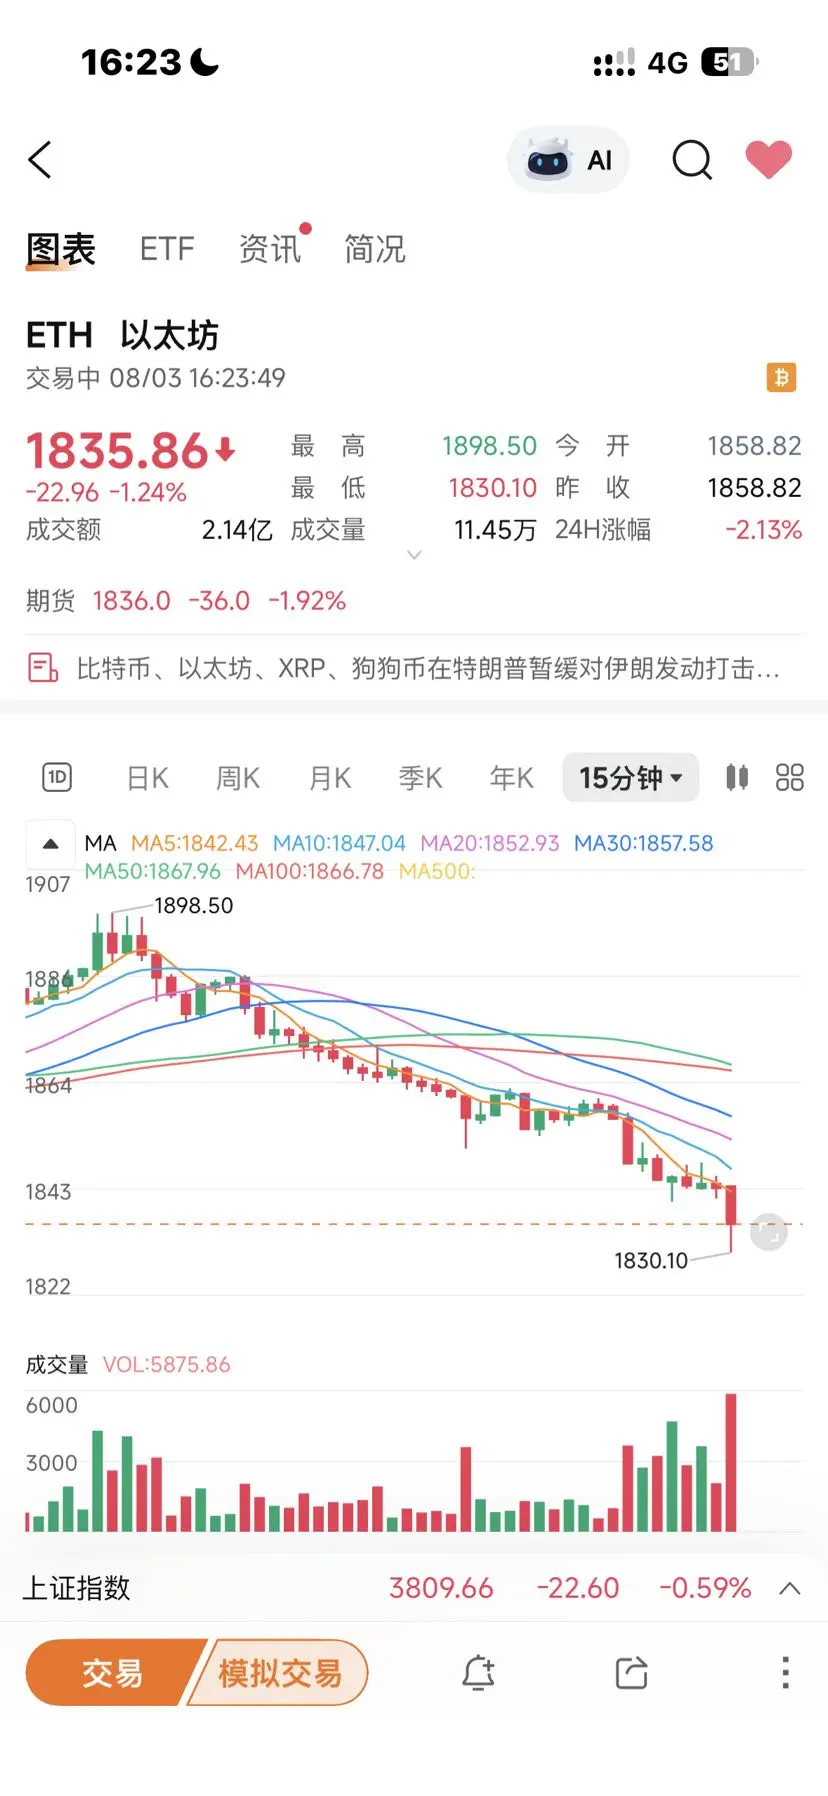
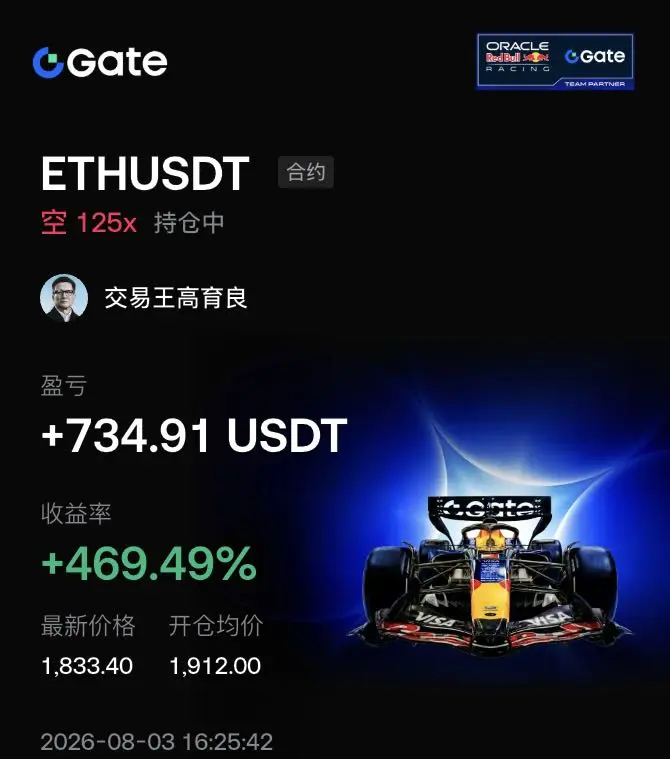
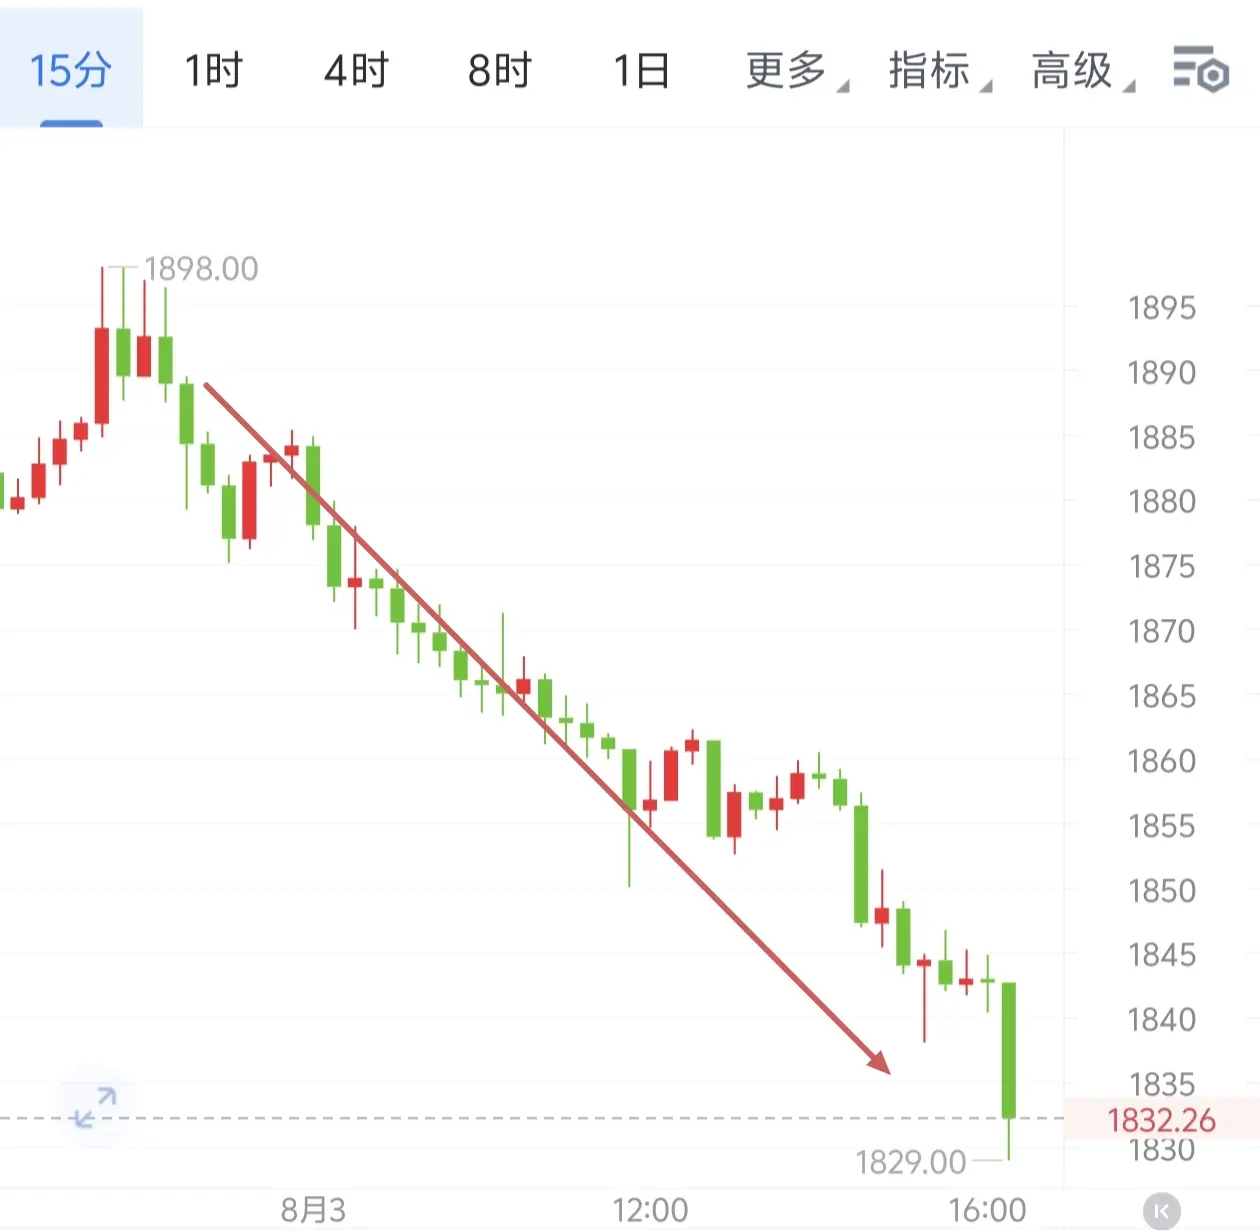
$ETH Mingyuan, on 8/2 evening: bounce around 1,880–1,900, watching toward 1,840–1,805.
$BTC Mingyuan, on 8/2 evening: bounce around 63,500–64,000, watching toward 62,600–62,000.
$ETH Mingyuan, on 8/2 evening: bounce around 1,880–1,900, watching toward 1,840–1,805.