
Share your thoughts
placeholder
Article
Layout for Bitcoin, Ethereum, and Dogecoin
live-cover
LIVE3,655
  • 1
Everyone’s chasing $MU /USDT longs while the 4h quietly flips—are you early or early exit?

$MU /USDT - SHORT

Trade Plan:
Entry: 1019.67 – 1021.43
SL: 1029.04
TP1: 1014.18
TP2: 1009.93
TP3: 1003.57

Why this setup?
- 1D is *range*, not breakout—so the 1020.55 reference is a midpoint trap, not a launchpad.
- RSI 15m at 55.1 shows weak bounce fuel; momentum stalls right under the entry zone.
- ATR 1h (3.54) is tight—when it expands, it’s usually down from here.
- Why now? Price is sitting at the exact SHORT trigger with SL at 1029.04, giving a 2.3R to TP2 at 1009.93 before the daily ra
MU+0.46%
A hand that trembled slightly when setting the stop-loss a few days ago—this morning I realized that was unnecessary filial piety. 😂

A few days ago before bed, I set my watch level near 4.828. The pullback held, and buying pressure clearly strengthened. If you don’t enter on a signal like this, what are you waiting for? I pressed confirm and closed the app. When I opened the charts this morning, $UNI had already reached 7.141, and my position’s return had rolled straight up to +3400.28%. This move really wasn’t luck; it was positive feedback from the structure. Feeling good, brothers. 🎯

post-image
UNI+0.87%
ADA0.00%
ZEC+20.51%
Flash Storage Stock Futures Challenge
https://www.gate.com/share/act/bafa9da2
$MU $SKHYV $SNDK
post-image
MU+5.89%
SKHYV-0.98%
SNDK+11.88%
  • 10
I didn’t chase $LIT when it surged during the day, as a long-term trendline was directly overhead and it would have been difficult to place a stop-loss after entering. I waited for it to pull back and regain stability before entering a long position based on the lower-timeframe structure.

After entering, it consolidated for a while. I didn’t rush to trade in and out; once the price moved a certain distance away from my entry zone, I first closed 80% to lock in the profit on the core position, leaving the remaining 20% to follow the trend.

After the breakout candlestick appeared, I first to
post-image
LIT-6.11%
SNDK+1.13%
BNB-2.77%
No moves, no analysis, just pure luck—this performance is embarrassing to even talk about. When the market plunged intraday, everyone was running, but I kept my eyes on $PONS ’s chart and noticed that someone stepped in every time it dipped, with key levels never breaking. Be greedy when others are fearful—directly signaled to open a long at 0.4775. And now, 0.8614, +1584.6%. It feels great when you get the rhythm right. It was truly sluggish at first, but the result is truly satisfying. Take profit on 80% first, and set a breakeven stop to protect the remaining 20%. Staying out of the market
post-image
PONS-10.84%
BTC-0.15%
SNDK+1.13%
This trend is so obvious I don’t even need to think—the account is dancing on its own💃 I had just opened the charts this morning and saw $APT make another surge, but that move clearly lacked momentum. Every rebound stalled at the same level, while volume kept shrinking—classic clear overhead resistance. This kind of move isn’t a breakout; it’s looking for short sellers to take the other side👍
I placed a short order before the market had fully started, entering at 0.9133. It’s now at 0.6162, with +2309.76% secured, brothers. This move wasn’t about luck—it was about spotting at a glance that i
post-image
APT-0.23%
ETH+0.52%
ZEC+20.51%
Everyone’s staring at DASH at 71.41—but the range just whispered a secret the bulls missed.

$DASH /USDT - SHORT

Trade Plan:
Entry: 70.72 – 72.10
SL: 77.99
TP1: 66.48
TP2: 63.19
TP3: 58.26

Why this setup?
Why now? The 1D trend is *range*, not breakout—so we’re playing mean reversion, not momentum.
- 4h bias: SHORT (Conf 55.4) with entry zone 70.72–72.10.
- RSI 15m at 57.38 shows a weak bounce—no fuel for a push above 72.10.
- ATR 1h (2.74) says volatility is contracting—tight stops, fast move.
- Targets: TP1 66.48, TP2 63.19. Invalidation only if price closes above 55.29 (wait—tha
DASH+4.23%
Everyone’s eyeing BNB at 750—but the 4h chart is silently screaming “trap” while the daily range holds its breath.

$BNB /USDT - SHORT

Trade Plan:
Entry: 749.30 – 751.40
SL: 760.45
TP1: 742.77
TP2: 737.72
TP3: 730.14

Why this setup?
- Price is pinned at 750.35 with a 1D range, yet the SHORT bias (conf 55) targets a clean drop to 742.77 first.
- RSI on the 15m is only 56.1—no overheated bounce fuel, while ATR (4.2) shows volatility is compressed, priming a snap.
- Why now? The “waiting” status means the entry zone (749.30–751.40) is the exact battlefield; a rejection here flips momentu
BNB-2.77%
$ETH Signal】Long sniper entry + 1H pullback limit order
$ETH Order book buy/sell ratio 1.93, with buyers dominant; substantial orders are placed at 2495-2498. 1H RSI is 57.6, the MACD histogram is contracting, and the price remains above EMA20. The 4H Bollinger Band middle line is at 2480, with EMA20/50 arranged upward.
🎯Direction: Long
⚡Entry/Limit order: 2490.3166 - 2497.8100
🛑Stop-loss: 2458.3718
🚀Target 1: 2556.9672
🚀Target 2: 2586.5458
🛡️Trade management:
- After reaching Target 1, reduce the position by 50% and move the stop-loss up to the breakeven level. If the price falls back t
post-image
ETH+0.52%
BTC-0.15%
SOL+1.75%
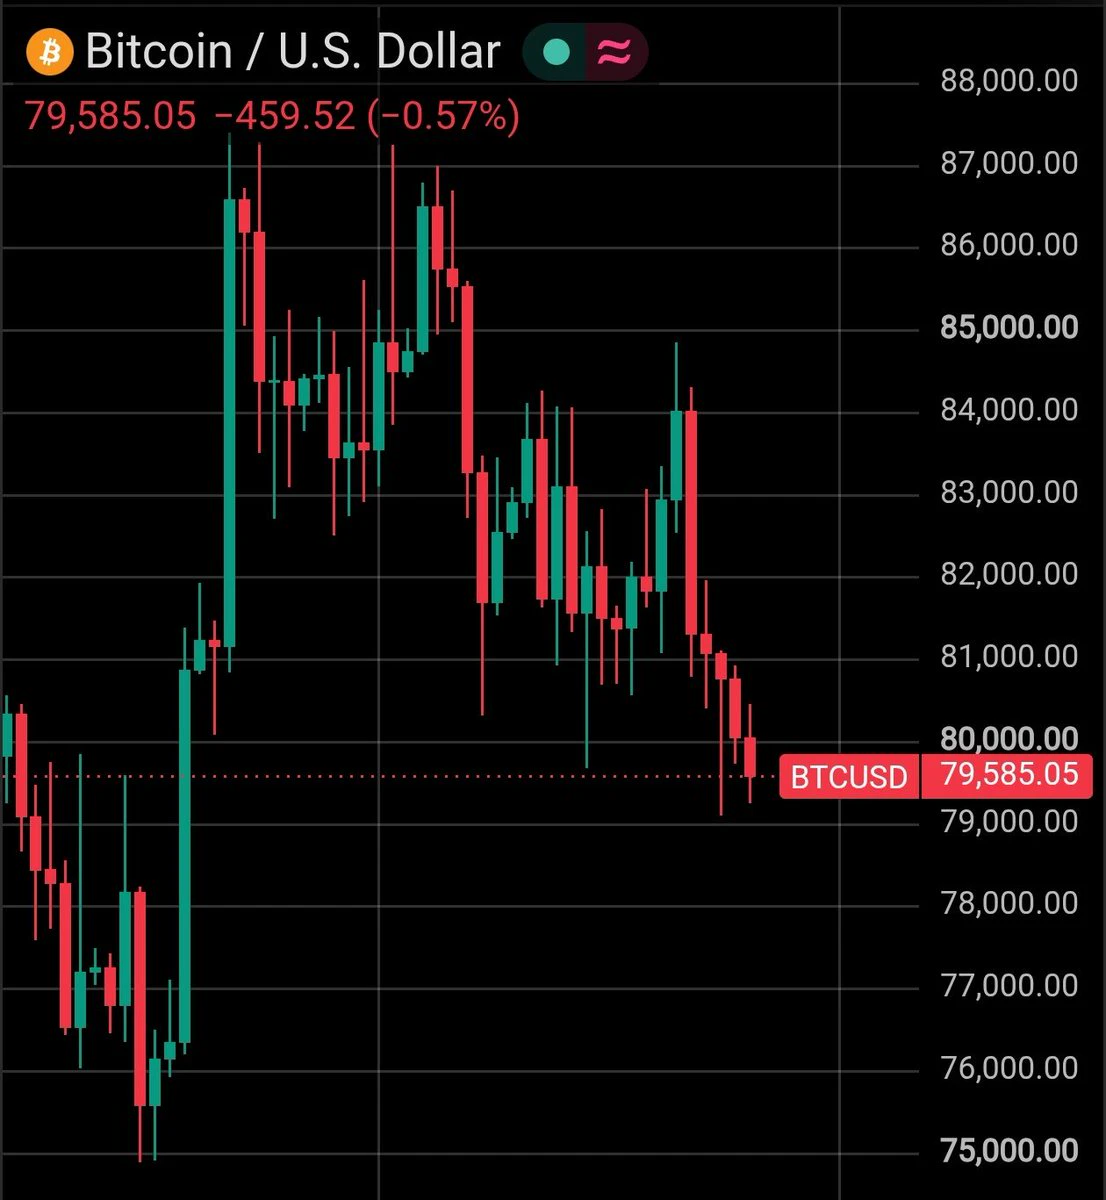
As long as this key zone holds, I remain bullish on $BTC .
#Bitcoin
post-image
BTC-0.15%
This trend, I don't even need to use my brain—the account is dancing on its own🤣.

With the screen glowing green, $DOGE /DOGE was lying on the ground, clearly moving sideways at the bottom. I watched it three times and decisively went long. Everyone else was running, but I chose to buy.

Fine, the market gave its answer. Entered at 0.08349, took profit at 0.09014, and walked away with +739.81% profit. Staying bullish wasn't in vain.

Take off 75% first, and place protection on the remaining 20% at the entry price. Don't let floating profit spend the night in your hands and turn into a float
post-image
DOGE-0.73%
BTC-0.15%
ADA0.00%
on the mountain top schizophrenically talking to myself about flork and how its the next multi bil genny coin of doom
post-image
The early-session price pulled back to around 220.7 and stabilized, so I went long directly. The plan is simple: as long as the hourly candle body does not break down, the target above is the high-volume trading zone, with the stop-loss placed simultaneously.

After entering, it consolidated for a short while, with one wick in between, but I did not adjust the position. Once the hourly candle closed bullish again and pushed higher on increased volume, I took 70% off at the first target and moved the stop-loss on the remaining position directly above the breakeven line.

The subsequent rise w
post-image
SOL+1.76%
DOGE-0.73%
9.7 Monday Gold Outlook
On Monday, there is basically unlikely to be a one-sided major move in the short term; overall, the market is expected to focus mainly on range-bound correction.
4-hour chart:
After the pullback, price has returned to trade near the middle Bollinger Band, while the Bollinger Bands have narrowed somewhat; the EMA7 and EMA30 moving averages are intertwined and converging, with no clear one-sided direction, as bulls and bears enter a tug-of-war.
The SKDJ indicator is moving upward after a low-level golden cross and is currently in the neutral zone, with no clear overbought
post-image
XAU-0.17%
I originally wanted to cut my losses and sacrifice to the heavens, but the ritual failed—the meat roasted itself.

As the price repeatedly oscillated intraday, the more I watched $PUMP rebound, the more fake it looked. It repeatedly pushed to 0.004390, falling just short every time; after breaking upward, nobody followed through, looking exactly like a pump-and-dump. I judged that the high was already under pressure and placed a small short order, ready to patiently wait for the market to turn. But the market did not give me much time to hesitate. The price gradually slid to 0.003878, and th
post-image
PUMP-1.65%
SOL+1.76%
BTC-0.15%
$Net looks ready
post-image
NET-2.00%
Everyone is staring at ADA’s green 15-min RSI, but the 4h tape just whispered something darker.

$ADA /USDT - SHORT

Trade Plan:
Entry: 0.2212 – 0.2224
SL: 0.2274
TP1: 0.2176
TP2: 0.2148
TP3: 0.2105

Why this setup?
Why now? The daily trend is range-bound, which means mean reversion is the game. RSI(15m) at 63 is a local overheat, not a breakout signal. ATR(1h) is thin at 0.0023, so the short squeeze fuel is low. We’re sitting at 0.2218 with a clear invalidation at 0.2133. If we reject 0.2224, the path to TP1 (0.2176) and TP2 (0.2148) is a straight line down. The 55 confidence score says "p
post-image
ADA0.00%
$BNB I’m bearish. Down 2.44%, yet the retail long/short ratio surged from 1.7465 to 2.1566—the further it falls, the more they add to longs, catching the falling knife; whales only moved from 1.7239 to 1.8524, showing restraint, with the two sides diverging in strength. The funding rate fell from 0.0051% to 0.0031%; longs are not paying a premium, and the support is coming not from new leverage but from retail traders holding the line. Open interest of $490 million versus $500 million in trading volume means the position turnover is once per day, with no incremental inflows. Bullish reversal
post-image
BNB-2.77%
Load More

Join 40 M users in our growing community

⚡️ Join 40 M users in the crypto craze discussion

💬 Engage with your favorite top creators

👍 See what interests you

View More