Square
Following
Hot
News
Notifications
Profile
Share your thoughts
placeholder
Article
BTC market update
live-cover
LIVE2,488
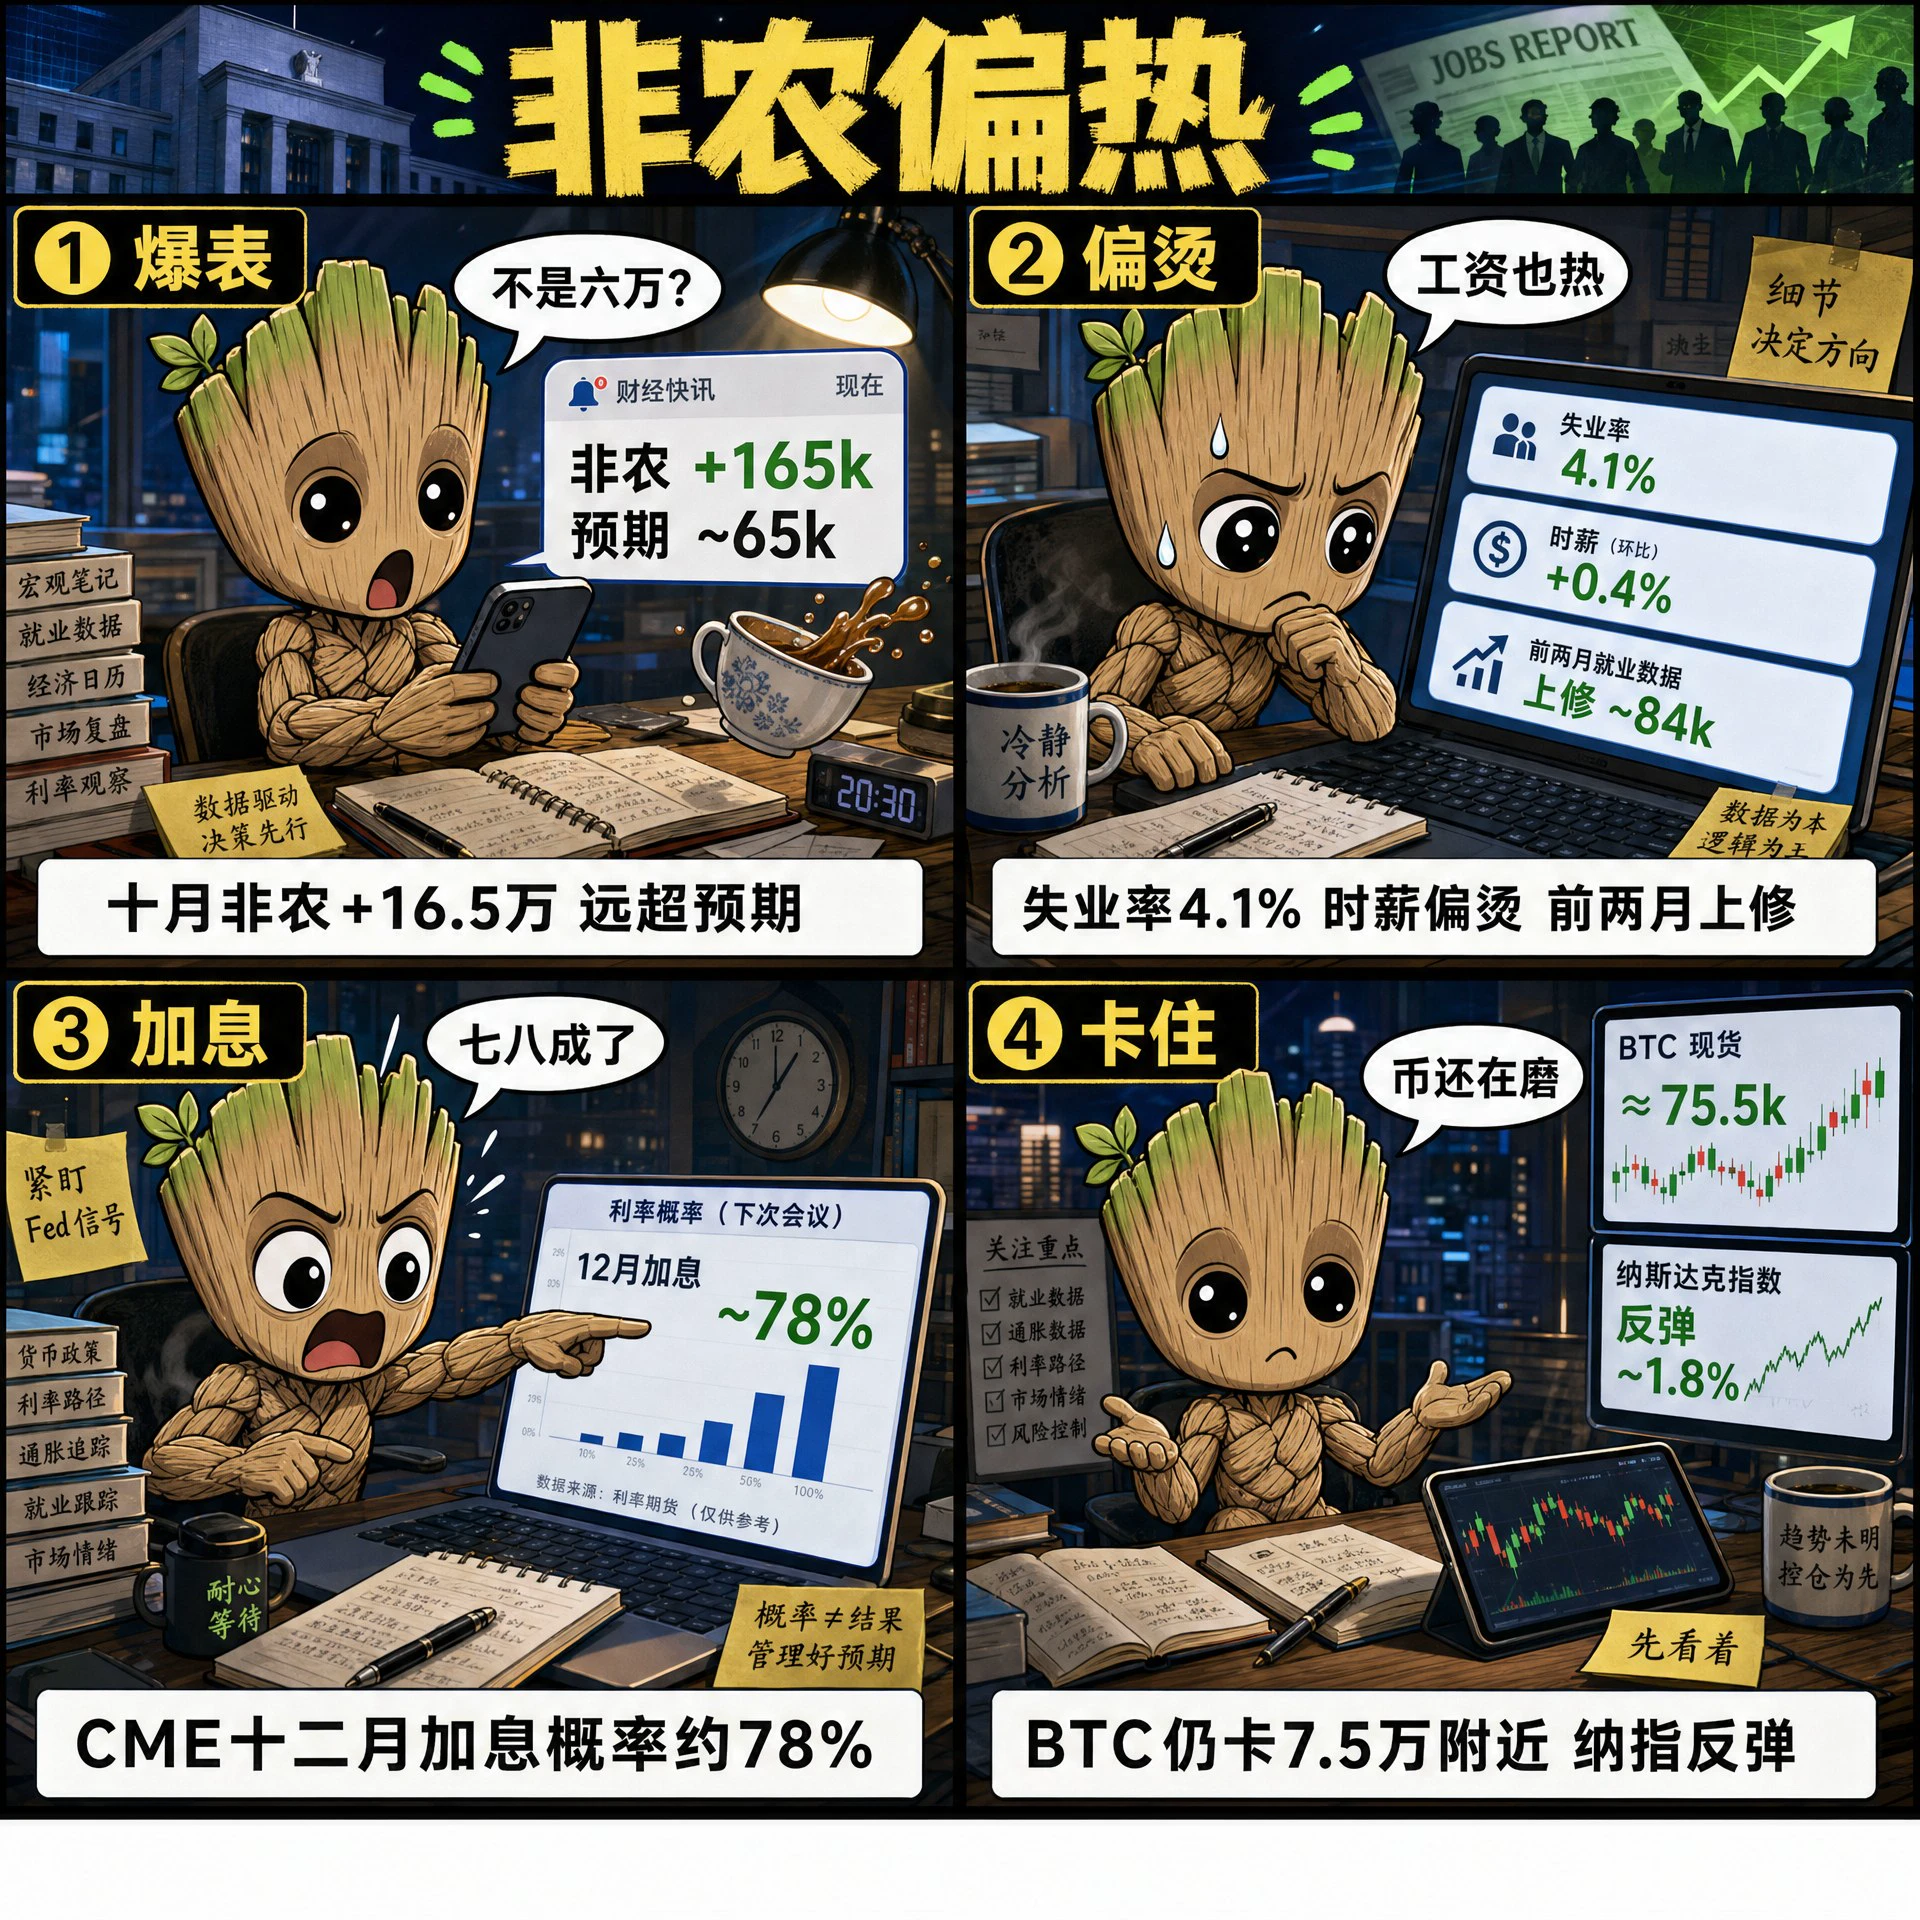
Nonfarm payrolls came out tonight
October added 165k jobs, far above expectations of just over 60,000
The unemployment rate was 4.1%, hourly earnings rose 0.4% month over month and 3.1% year over year, and August and September were revised up by about 84k combined
After the hotter-than-expected data, the probability of a December rate hike was pushed to around 70% to 80%
The Nasdaq rebounded about 1.7% to 1.9%BTC broke above 76.1k, then pulled back and is now hovering around 75.5k
Employment came in noticeably stronger, but crypto hasn't followed suit for now; let's wait and see
post-image
NAS100-0.07%
BTC-0.67%
Trenches
ZIG
Z
bade
b
ZIG
0x8c...1145
Market Cap
$.
Change
.
24h Vol
$.
Holders
.
BTC
B
bade
b
BTC
C5xp...pump
Market Cap
$.
Change
.
24h Vol
$.
Holders
.
Diamond
D
bade
b
Diamond
5VCE...pump
Market Cap
$.
Change
.
24h Vol
$.
Holders
.
DOGE
D
bade
b
DOGE
DoGE...fm7R
Market Cap
$.
Change
.
24h Vol
$.
Holders
.
STONK
S
bade
b
STONK
6GmA...UNgx
Market Cap
$.
Change
.
24h Vol
$.
Holders
.
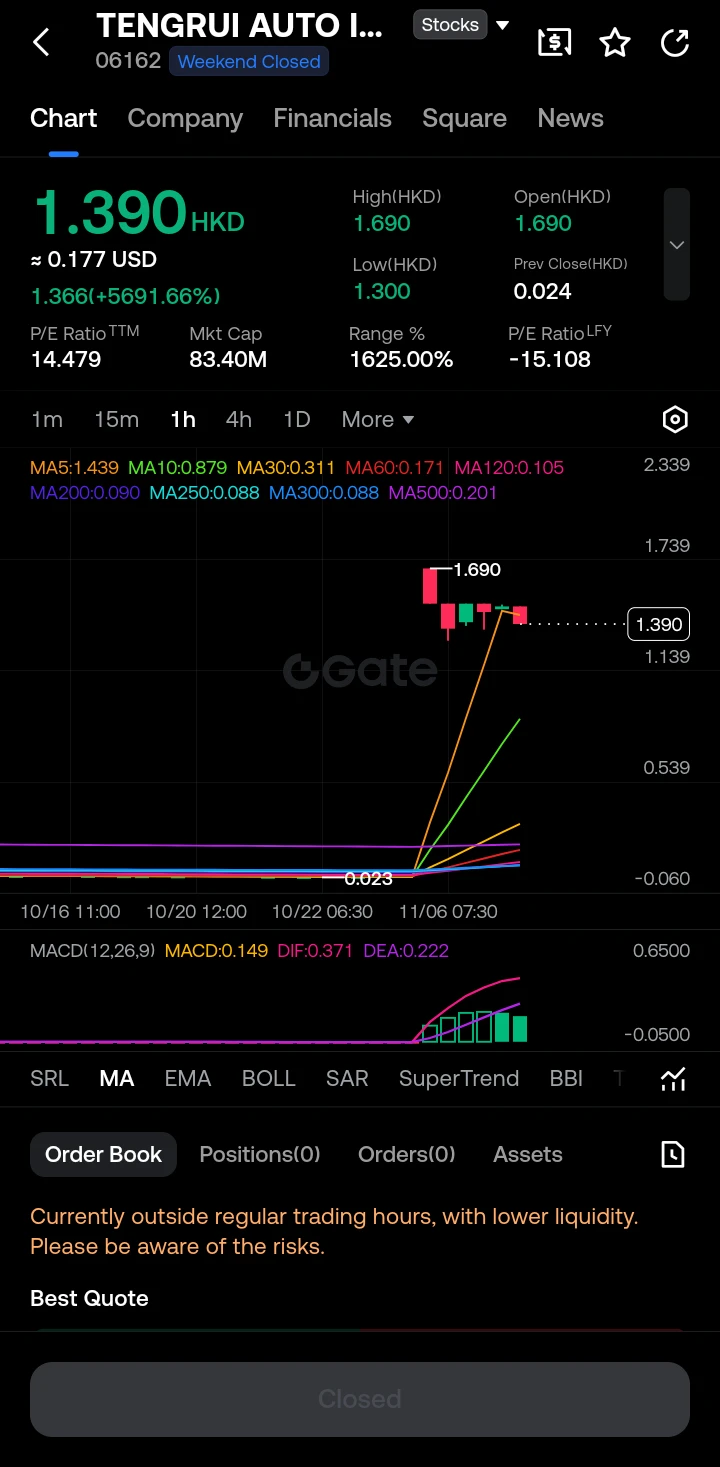
$TENGRUI AUTO INT ‌

Looking at the daily (1D) chart, the price action is completely parabolic and detached from any normal moving average structure; after a long period of flatlining near the 0.023 level, a massive gap-up and consecutive massive green candles shot the price up to a high of 1.690, leaving the MA5 and MA10 far below at 1.439 and 0.879 respectively. The MACD is extremely bullish with the DIF (0.371) and DEA (0.222) surging upward, and the histogram is expanding, but the sheer verticality of this move—showing a +5691.66% intraday range—screams extreme volatility and a potential blow-off to
post-image
  • 3
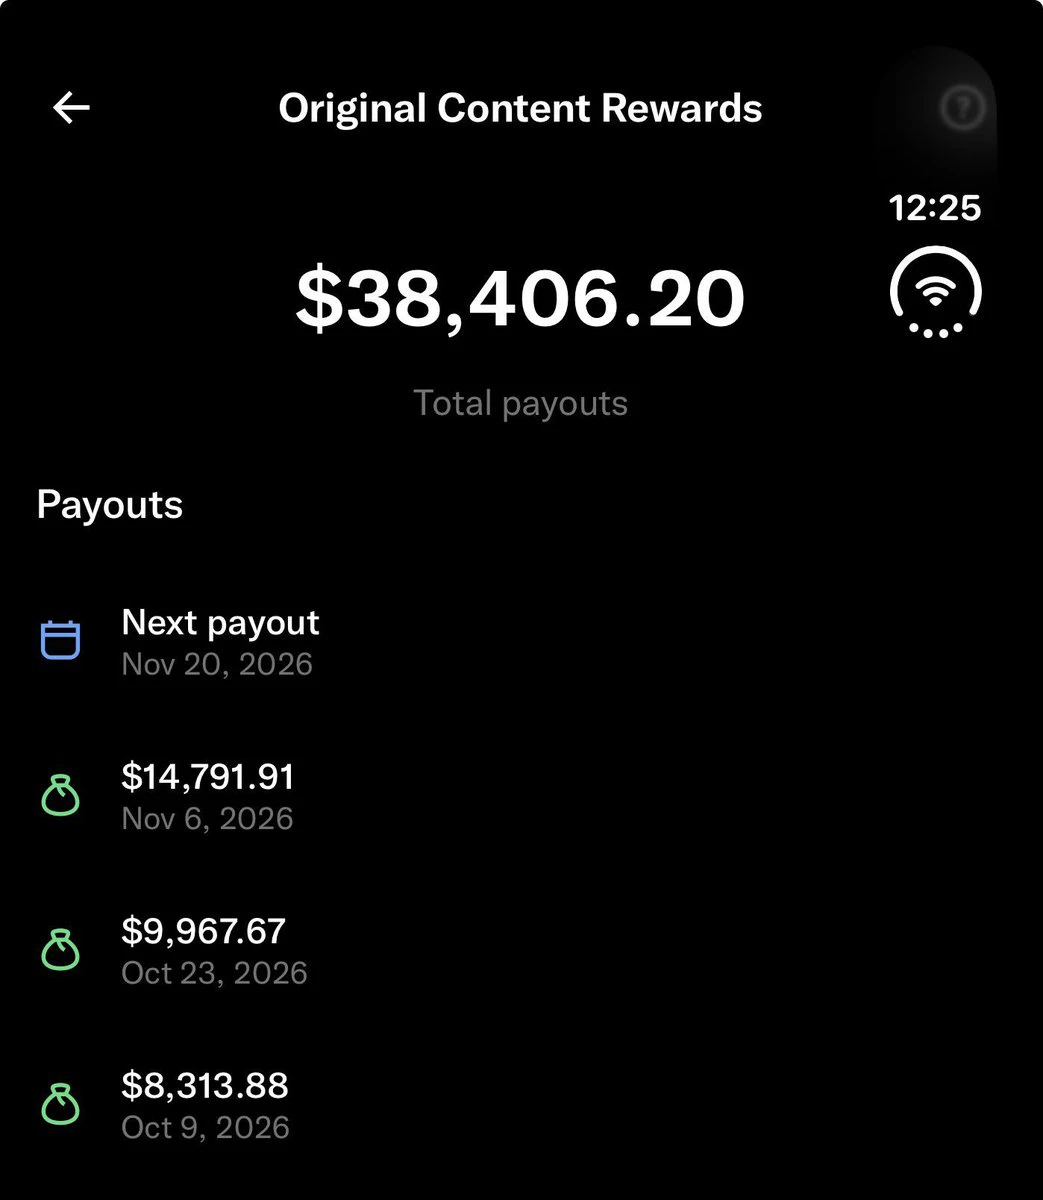
This is the salary in the English-speaking market. Too bad the Chinese-speaking market will never reach these heights.
post-image
Oh no, Fengxia must be dead.
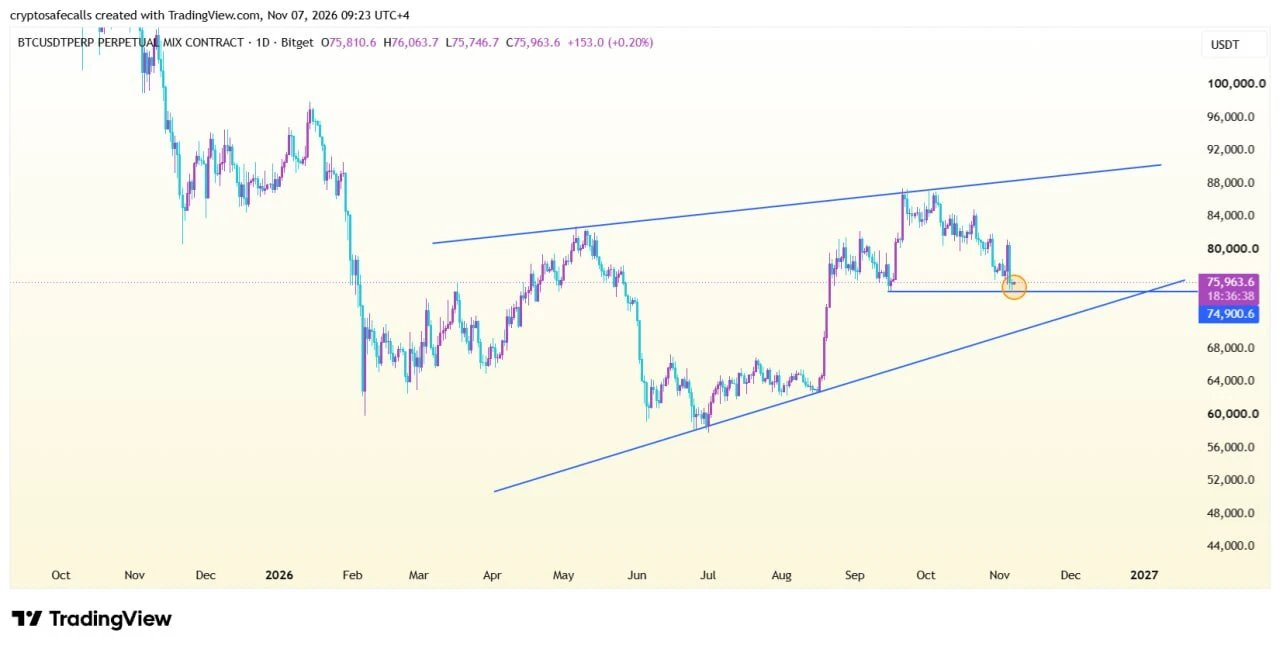
💰$BTC /USDT | 1D Update 🕯

BTC is holding just above $74.9K. A daily close below could trigger a major dump toward the lower trendline support.📉

📌 Wait for daily close confirmation!

$ONE $ZEC $IDOL $AKE #ShareWeekly #AITechSelloffPutsCryptoUnderPressure
post-image
BTC-0.65%
ONE-1.38%
ZEC+1.29%
IDOL-7.01%
AKE+6.39%
How Should You Manage Position Sizes? How Can Scientific Position Sizing Control Risk and Generate Steady Profits?
In cryptocurrency trading, many people study BTC's price direction every day, but rarely give serious thought to one question: Even if you're right, how much capital should you put in?
In fact, many traders don't lose because they misjudge the direction, but because they fail to manage their position sizes.
Suppose your trading account has 1,000 USDT. If you put all your funds into every trade, a sudden market move could cause serious losses. Even if the market later moves as you
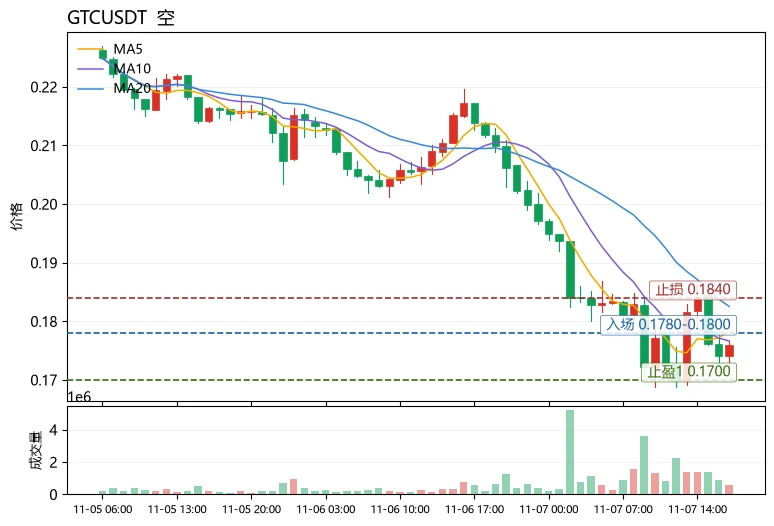
$GTC Conclusion first: Short-term outlook is bearish; a rebound is an opportunity to reduce positions, not a reversal signal. The moving-average structure remains bearish, with MA5=0.1784 still below MA20=0.1825; the bearish alignment has not recovered. Although the MACD histogram has turned positive at +0.0004083, the price has plunged 17.80% in 24h, making this a weak recovery after being oversold rather than a trend reversal. RSI=38.4 is in the weak zone but not oversold, leaving further downside. The current price of 0.1759 is below the middle band and above the Bollinger lower band at 0.1
post-image
GTC
GTC芝麻币
Gate.Fun
MC:$0.1Holders:1
0%
NEAR+1.17%
ONE-1.19%
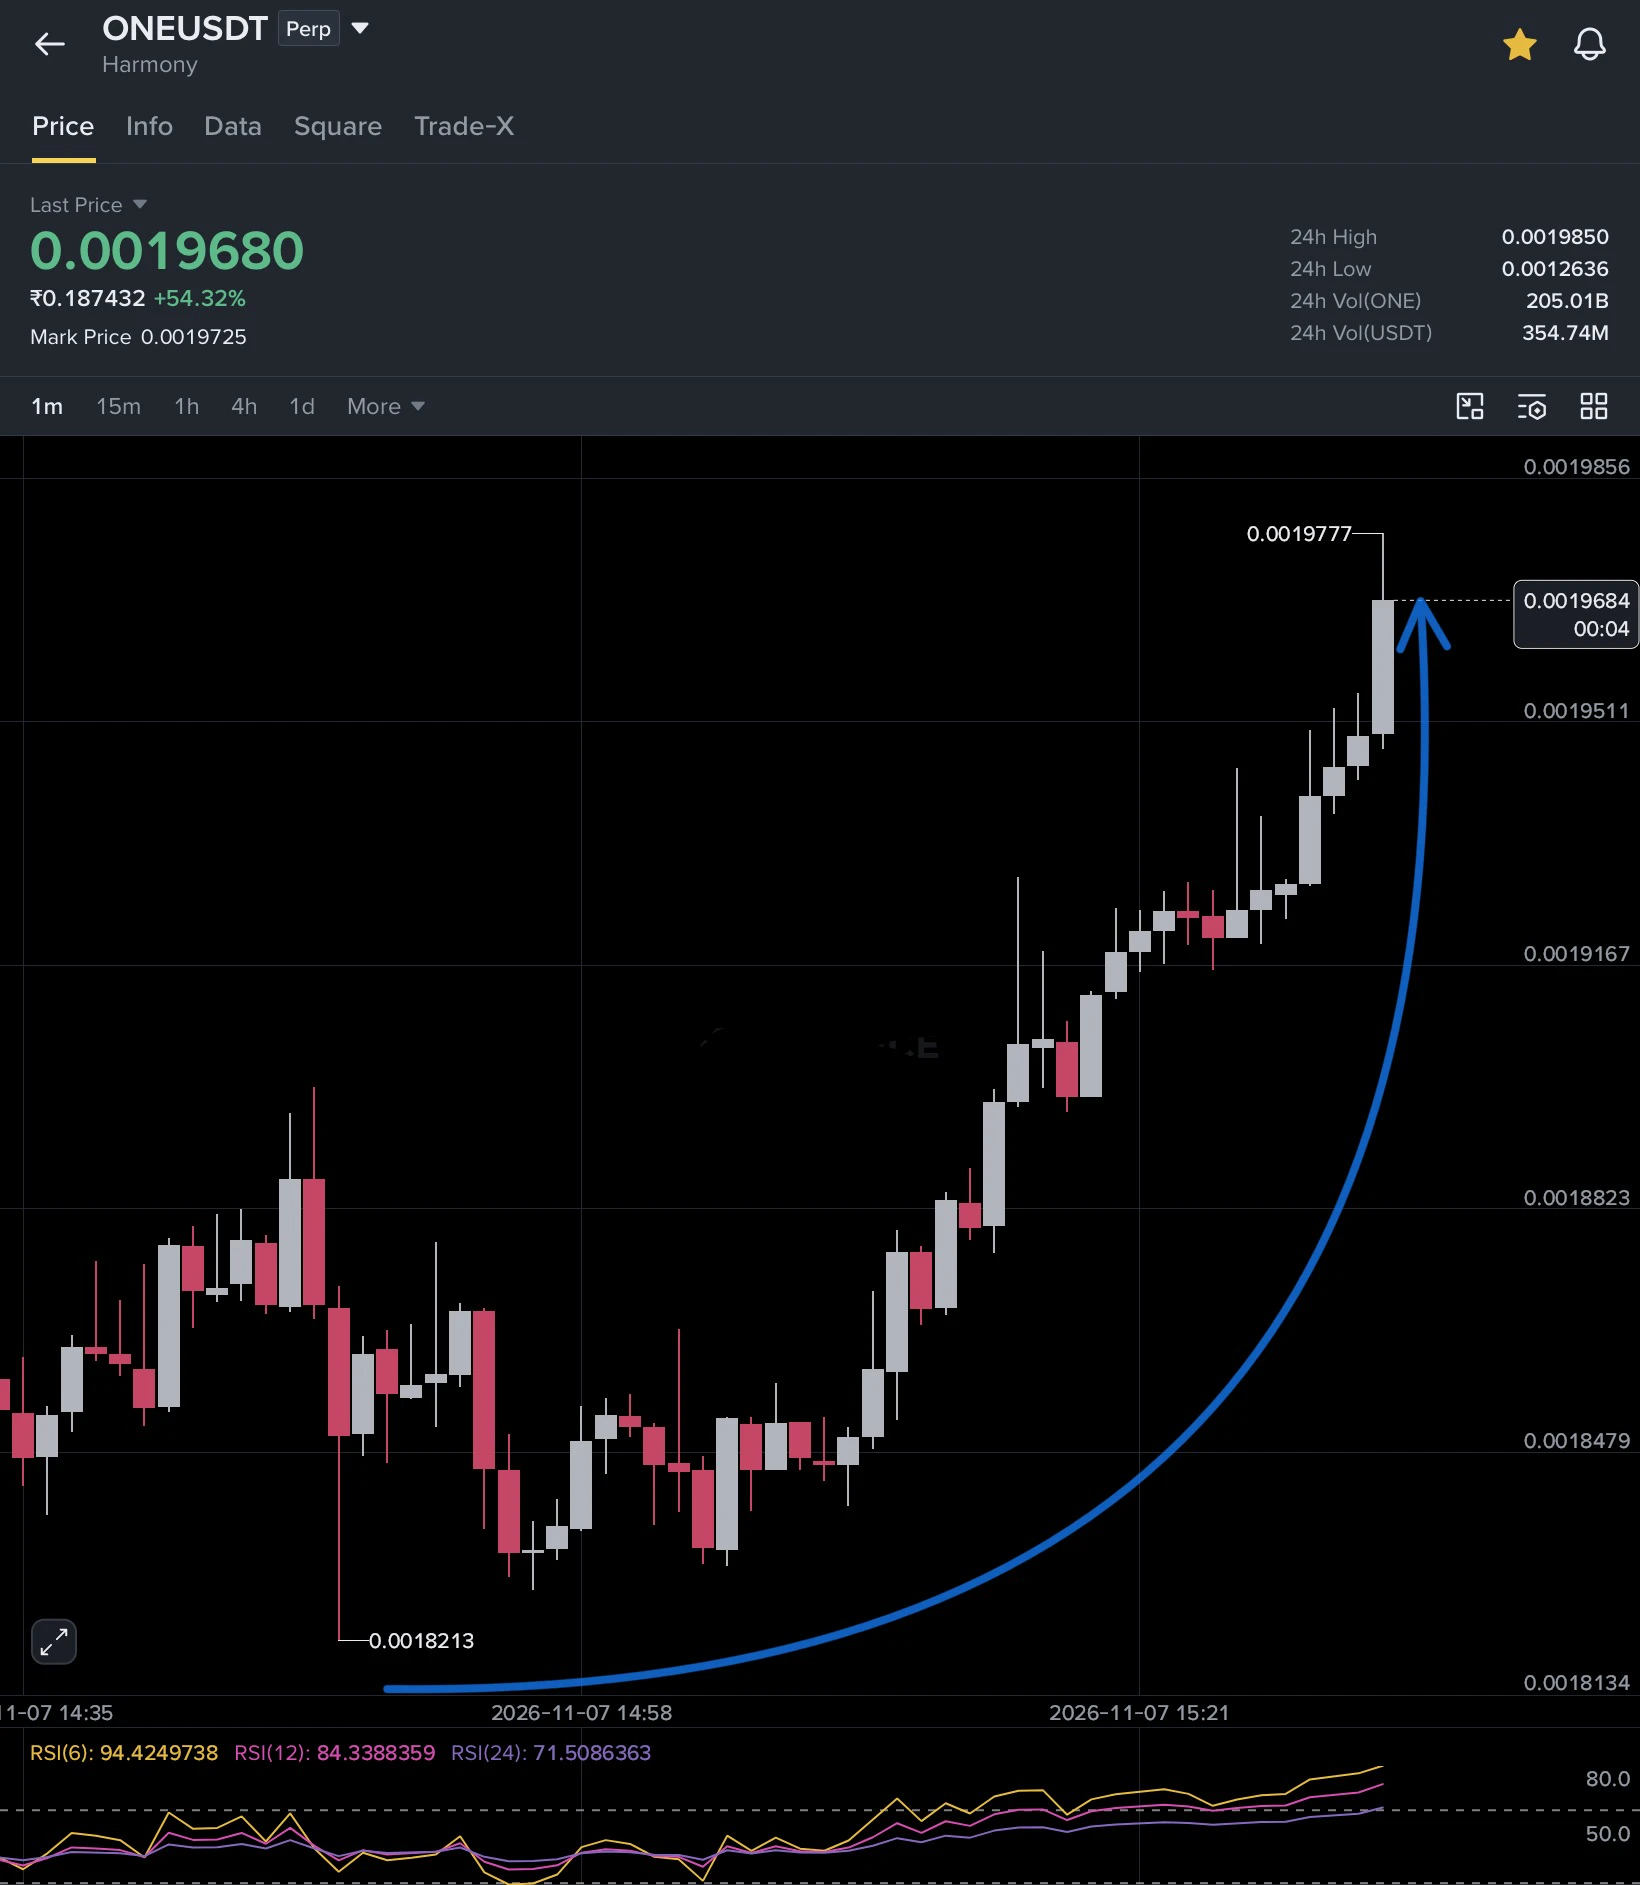
$ONE The 3rd target is nearing completion ✅

Set the stop-loss at the entry price 👍
post-image
CryptoSat
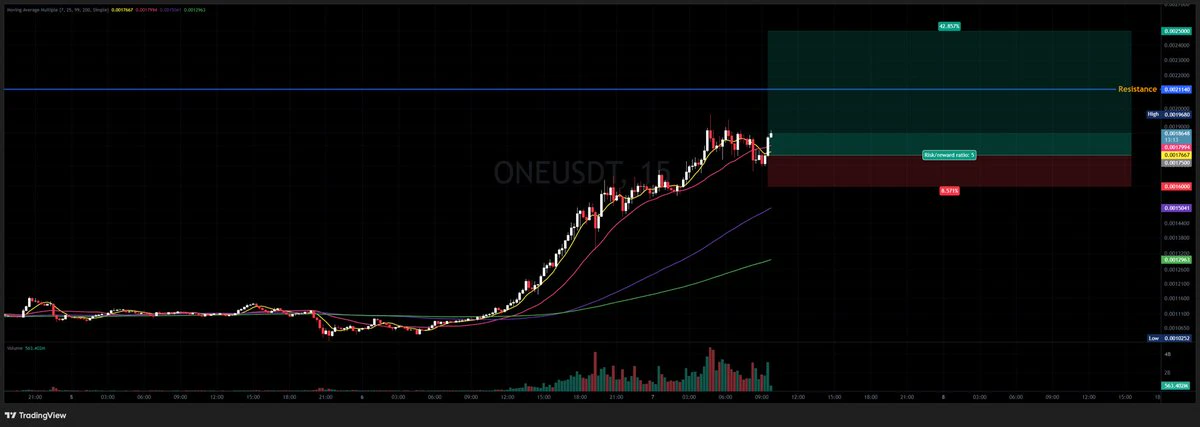
💰 $ONE  /USDT
🔼 LONG
✳️ ENTRY (Use DCA STRATEGY) : 17500, 17000
🎯 TARGETS - 18000, 19200, 20000, 21000, 25000
🀄️ LEVERAGE -  cross 10x
🔴 STOPLOSS - 1600
repost-content-media
ONE-1.38%
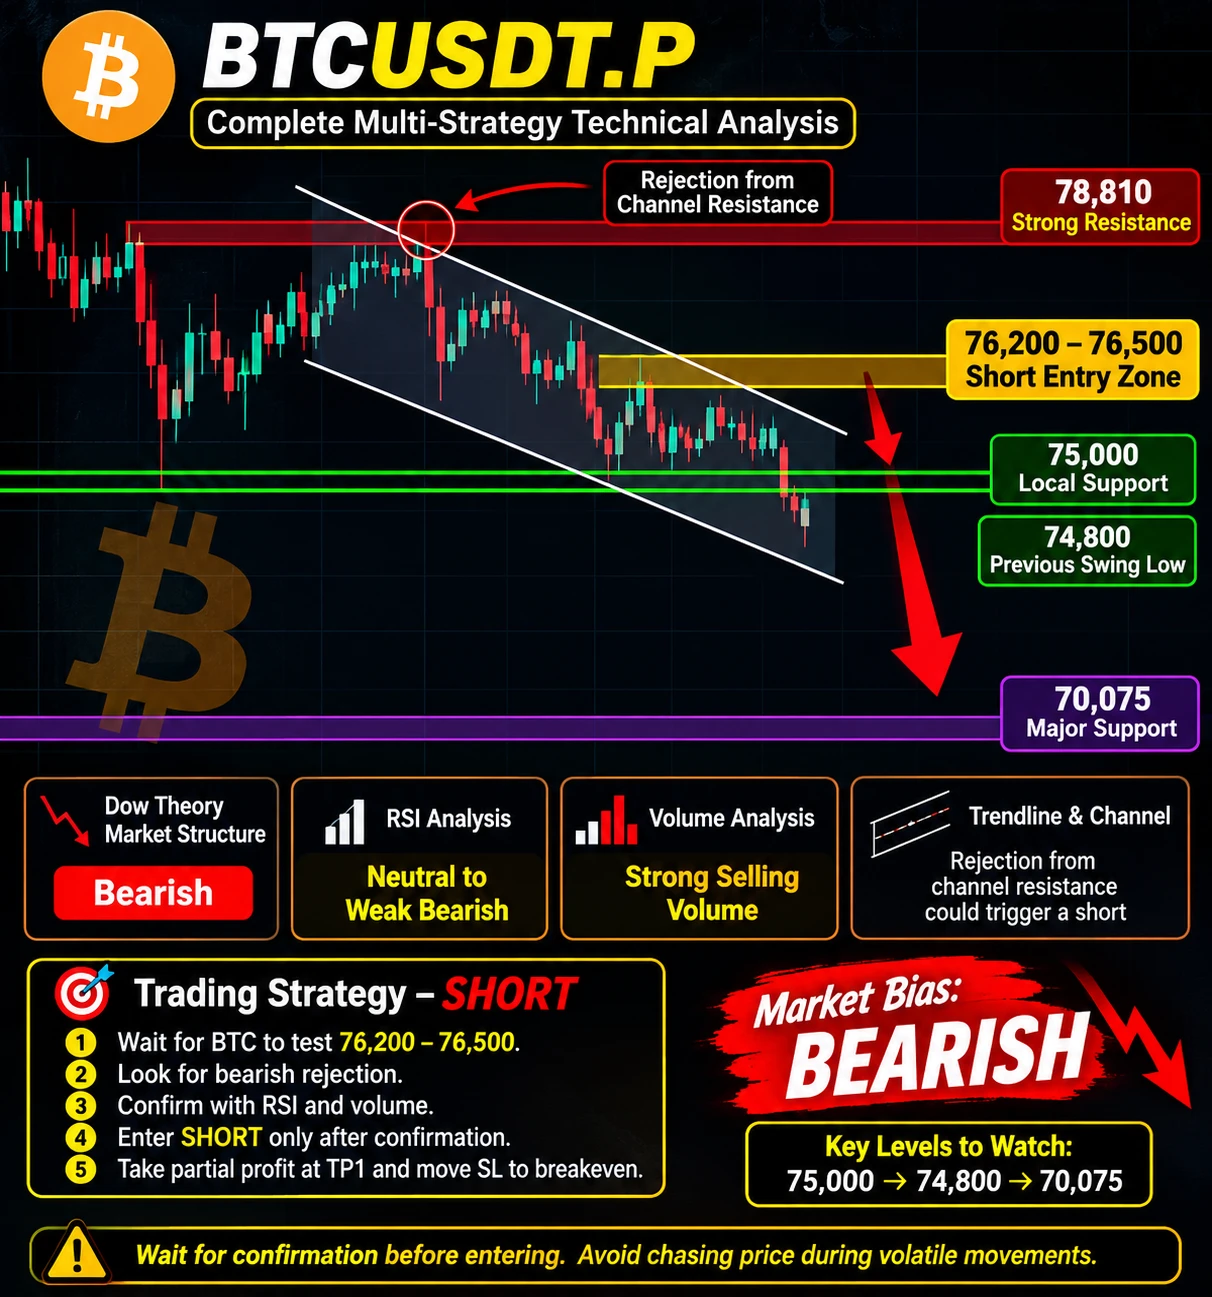
🚨 $BTC USDT.P – Complete Multi-Strategy Technical Analysis

1) Dow Theory – Market Structure: Bearish
BTC continues to form lower highs and lower lows, indicating continued selling pressure.

2) Support & Resistance:

- 78,810 – Strong Resistance
- 76,200–76,500 – Potential Short Entry Zone
- 75,000 – Local Support
- 74,800 – Previous Swing Low
- 70,075 – Major Support

3) Trendline & Channel:
BTC is trading inside a descending channel. A rejection from channel resistance could create another short opportunity.

4) RSI Analysis: Neutral to Weak Bearish.

5) Volume Analysis:
Strong selling vol
post-image
BTC-0.65%
ONE-1.38%
AIN+3.35%
TSLA+5.38%
SPCX+8.74%
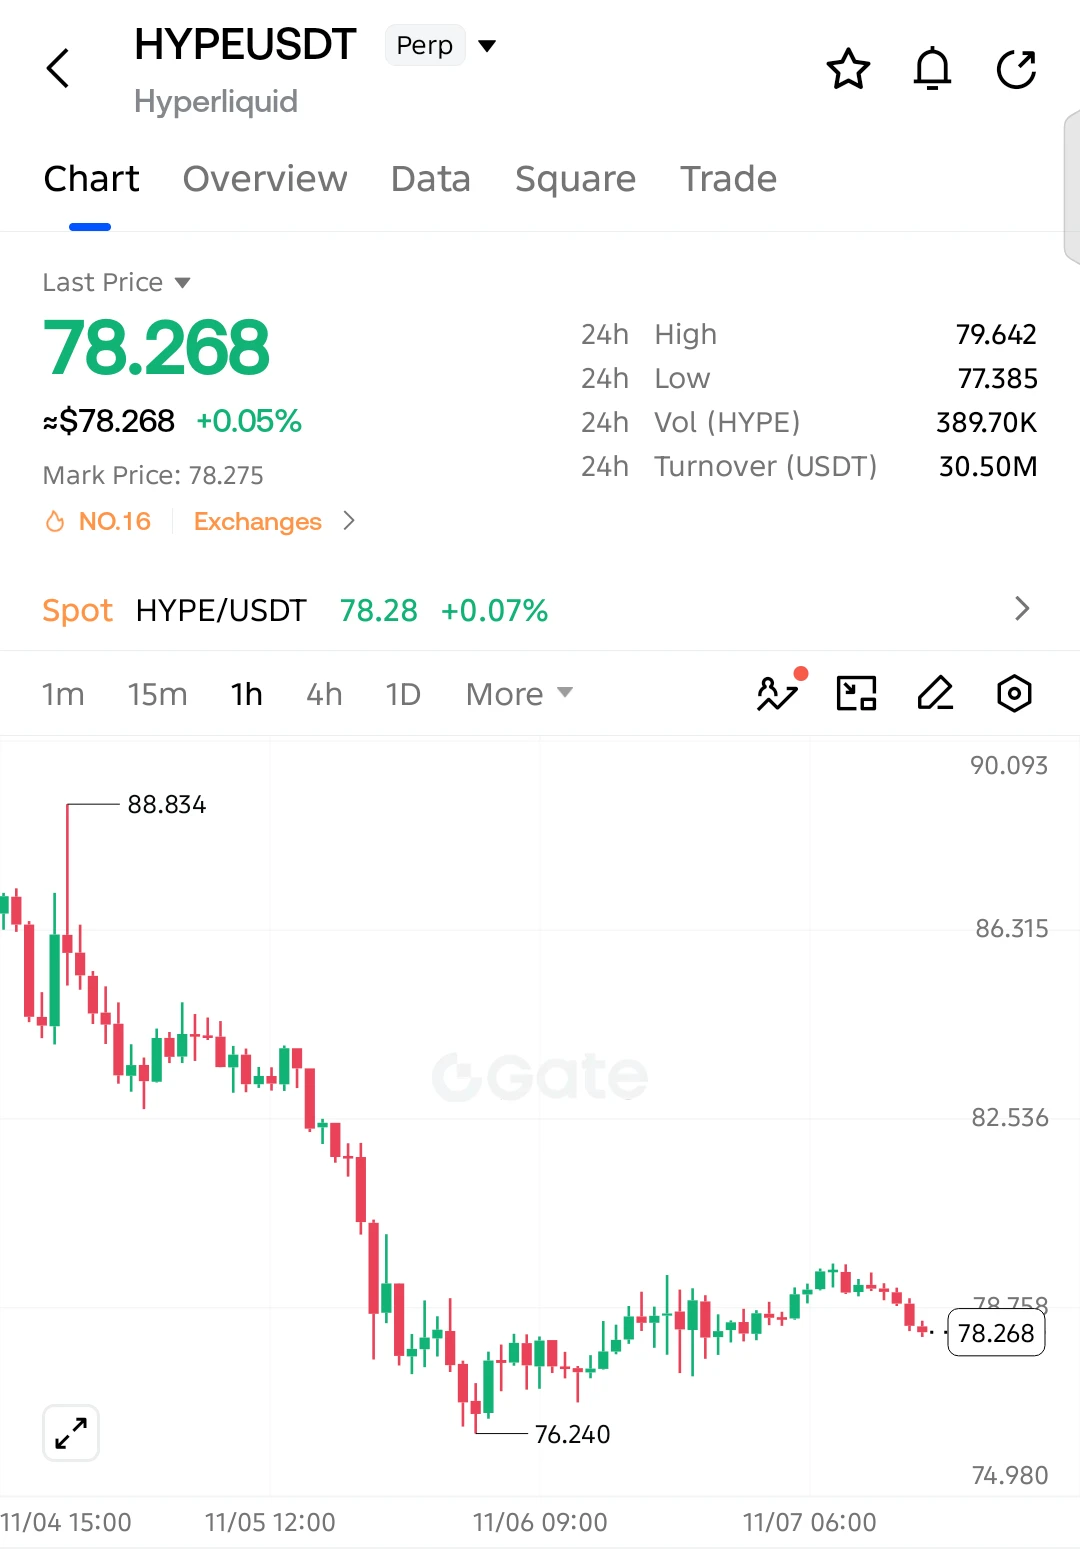
$HYPE SHORT SETUP — SELLERS TAKING CONTROL AGAIN!

$HYPE is struggling to recover after a sharp decline, with buyers losing momentum near resistance. Another bearish move could be developing!

Entry: 78.268
SL: 79.85

TP1: 77.385
TP2: 76.240
TP3: 75.50
Final Target: 74.98

The broader trend remains bearish, and the recent recovery has failed to break above 79.64. Sellers are pushing price lower again, while a breakdown below 77.385 could accelerate the decline toward 76.24 and lower.

Invalidation: A sustained recovery above 79.85 weakens the bearish setup.
post-image
HYPE+0.24%
When trading BTC, many people see a long upper wick on a candlestick chart and assume the market is about to fall. But does a long upper wick really mean a trend reversal?
Actually, not necessarily.
A long upper wick usually indicates that the price encountered selling pressure while rising. Buyers tried to push the price higher, but sellers stepped in at higher levels, and the price eventually pulled back from its high.
When assessing a long upper wick, focus on three aspects.
First, its location. If a long upper wick appears near an important previous resistance level, it may indicate strong
post-image
BTC-0.67%
My $BTC short trade plan! New entry: $76,650 Stop loss: $77,075 Take profit: 73,850🚨 I’m waiting for the price to slowly rise to my confirmed entry zone. If the price breaks through this level with a strong candle, I’ll cancel the trade.
post-image
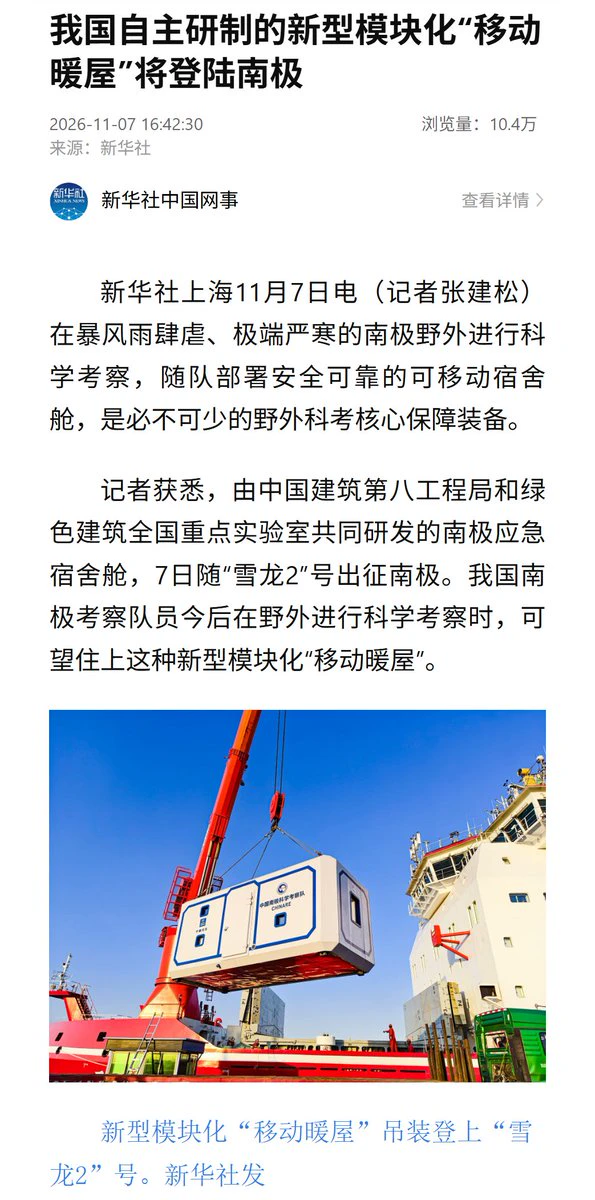
IT Home, Nov. 7 — According to Xinhua News Agency, an Antarctic emergency dormitory pod jointly developed by China Construction Eighth Engineering Division and the National Key Laboratory of Green Building set out for Antarctica aboard the Xuelong 2 on the 7th. Each module has a floor area of 18 square meters, can withstand temperatures as low as -40°C, and can maintain an indoor temperature of 18–24°C.

The units are fully prefabricated in a factory, with container corner fittings on the base: they can be loaded onto a ship or attached to a sled and towed. Wherever expedition team members go,
post-image
BTC-0.67%
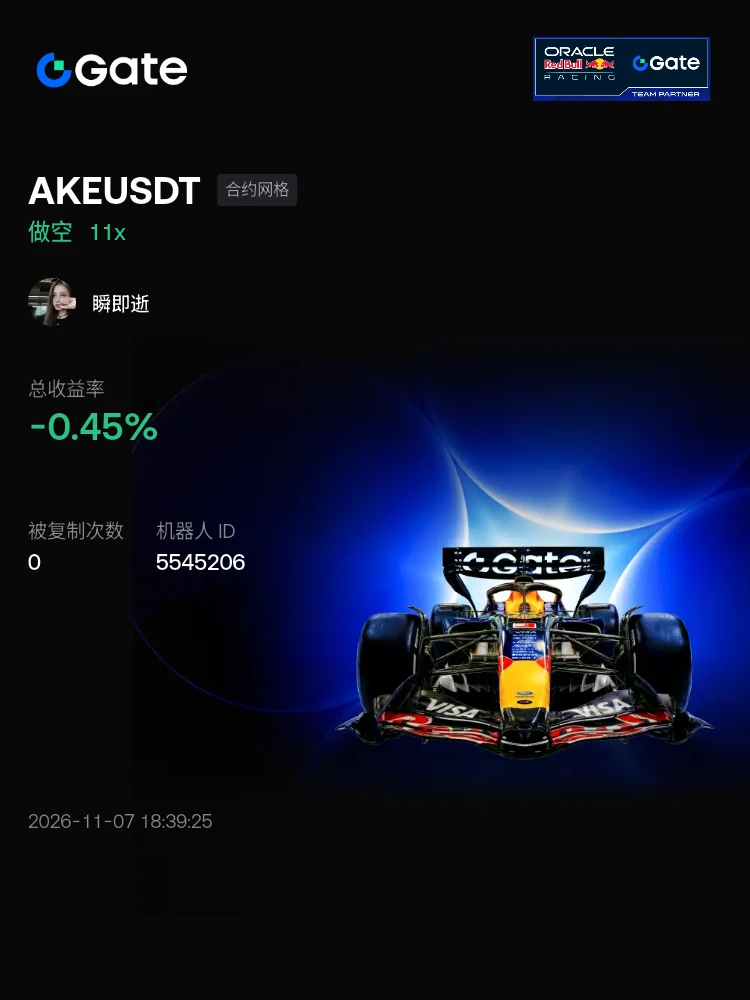
#交易机器人 I'm using the AKEUSDT futures grid bot on Gate, come copy trade with me$AKE You can go short now
post-image
AKE+6.39%
  • 1
$AKE Fuck me, I lost so much. As soon as I closed my position, it pumped hard. Half a year’s salary is gone😭.
post-image
AKE+6.07%
  • 4
I really can't think of how to refute this argument😂
post-image
BTC | ETH | Gold | Crude Oil
live-cover
LIVE2,164
Many traders’ first reaction after losing money in their accounts is to make it back as quickly as possible. But there’s a very important mathematical point that’s often overlooked: the percentage loss and the percentage gain needed to break even are not symmetrical.
Suppose your account originally held 1,000 USDT.
If you lose 10%, your account is left with 900 USDT. To get back to 1,000 USDT from 900 USDT, you need to gain 100 USDT, or about 11.11%—not 10%.
If you lose 20%, your account is left with 800 USDT, and you need a 25% gain to break even.
If you lose 30%, your account is left with ju
post-image
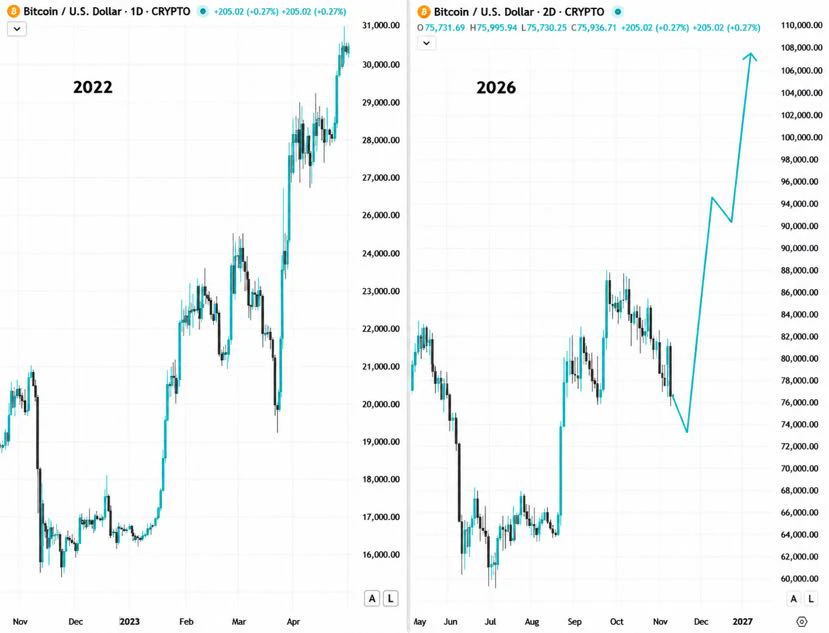
$BTC is showing a familiar pattern.

The shift from bearish to bullish momentum looks strikingly similar to the last cycle.

History may not repeat exactly, but this setup is worth watching closely.

#BTC #USAIStocksHitHard #StakeOnLaunchpoolToShare450KVLX
post-image
BTC-0.67%
Load More

Join 40 M users in our growing community

⚡️ Join 40 M users in the crypto craze discussion

💬 Engage with your favorite top creators

👍 See what interests you

Trending Topics

USAIStocksHitHard

17.89k Views3.65k Discussing

U.S. stocks sold off sharply on Thursday, November 5 (UTC). The Nasdaq closed down around 5.5%, entering correction territory, while the Philadelphia Semiconductor Index plunged roughly 12%, with chip stocks including $NVDA and $AMD posting steep losses. Beyond profit-taking, investors are growing concerned about the pace of AI data center construction, capital spending, and future returns on investment. The key question now is whether the AI sector’s lofty growth expectations need to be repriced. Where do you think the next opportunities will emerge: chip stocks, tech giants, or other sectors?

USNonfarmPayrolls

26.81k Views4.29k Discussing

StakeOnLaunchpoolToShare450KVLX

4.81k Views795 Discussing

View More