







Square
Following
Hot
News
Profile
Share your thoughts
placeholder
Article
#ShareWeekly
(GOOGL): Strong AI Growth, But Wall Street Wants Profitability
Alphabet is facing serious market pressure after its latest earnings report. GOOGL closed around $279.84 on October 30, following a sharp post-earnings sell-off. The main concern is not a lack of growth, but whether massive AI investments can translate into sustainable profits.
Google Cloud delivered an impressive 103% year-over-year revenue increase to $30.7 billion, while total revenue grew 25% to $127.6 billion. However, earnings disappointed, and free cash flow turned negative at approximately $9.1 billion. Rising
post-image
GOOGL-1.32%
$OP ‌
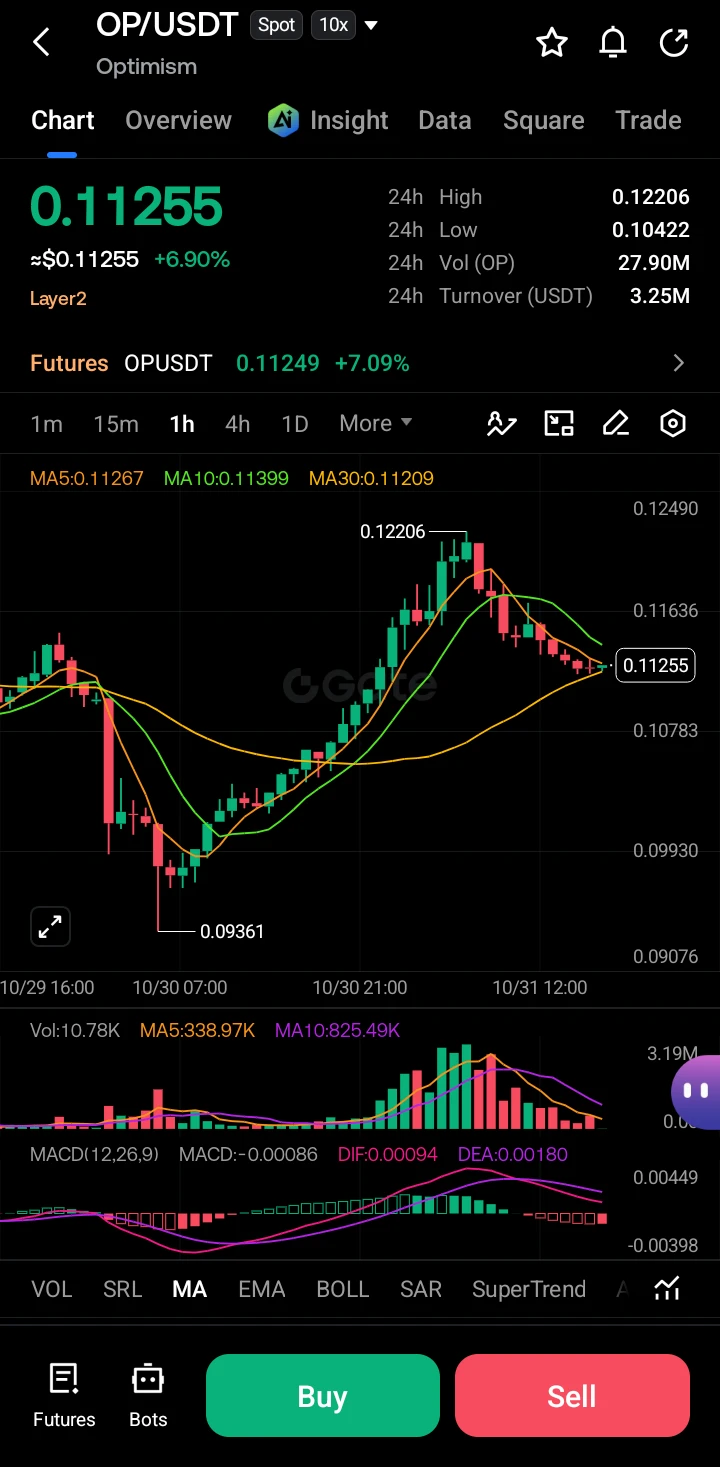
OP is trading at 0.11255 (+6.90%), recovering strongly after a sharp drop to the 0.09361 low. Price pumped to 0.12206 and is now consolidating lower while still holding above the key moving averages.
Key Levels
Resistance: 0.1163–0.1180 → 0.1220 (recent high)
Support: 0.1100–0.1110 → 0.1078 → 0.1042
Critical zone: 0.1120–0.1135 (current MA cluster).
Kline Deep Analysis.
Price made a clear V-recovery from the 0.09361 bottom with strong green candles and rising volume. After hitting 0.12206, a series of red candles and lower highs formed, showing profit-taking.
MA5 (0.11267) is flat, MA10
OP-1.33%
  • 9
  • 3
Trenches
IDOL
I
bade
b
IDOL
0x3b...ab07
Market Cap
$.
Change
.
24h Vol
$.
Holders
.
Q
Q
bade
b
Q
0xc0...0589
Market Cap
$.
Change
.
24h Vol
$.
Holders
.
ZIG
Z
bade
b
ZIG
0x8c...1145
Market Cap
$.
Change
.
24h Vol
$.
Holders
.
SAFU
S
bade
b
SAFU
0x7c...7777
Market Cap
$.
Change
.
24h Vol
$.
Holders
.
GTA6
G
bade
b
GTA6
4kjr...zDnz
Market Cap
$.
Change
.
24h Vol
$.
Holders
.
At 77,000, both long and short whales are in a tough spot

A little after 9 p.m. Friday, I watched the charts for a long time. BTC is currently at 77,098, with RSI at 36, stuck below the 77,772 resistance level. The number itself isn't particularly notable; what really made me hesitate was another set of data: among 812 whale addresses, the average long entry price was 84,946, while the average short entry price was 76,451. The current price is right in between. Longs are sitting on more than $52 million in unrealized losses, and shorts are also down more than $118 million, with profitability
BTC-0.65%
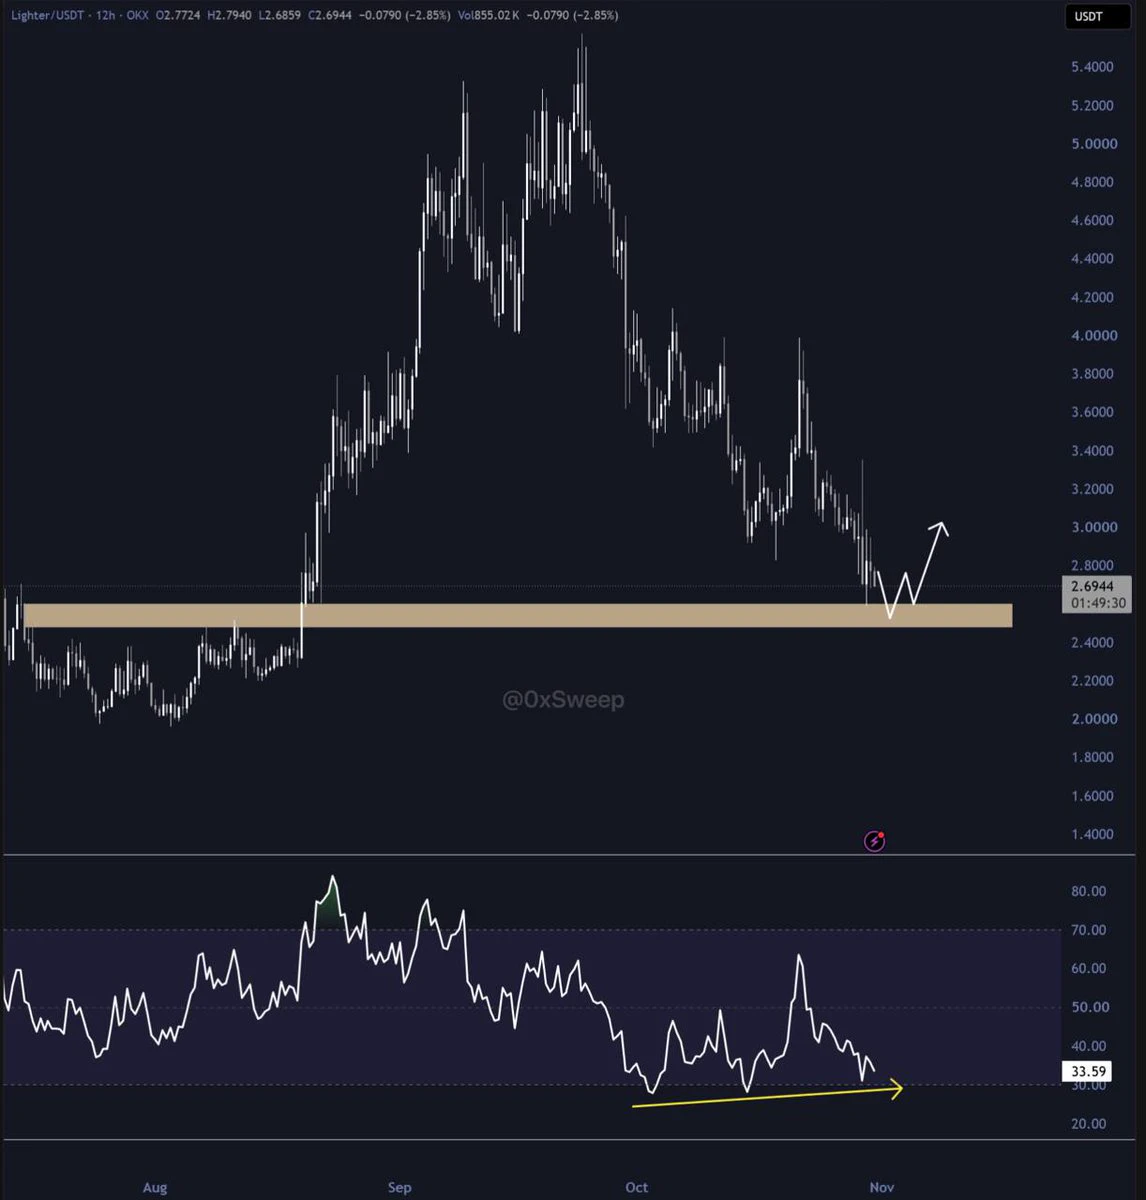
$LIT is almost at the buying zone.
RSI is trending up which means sellers are getting exhausted
With HYPE already rallying, LIT could follow next
post-image
LIT-4.56%
HYPE+0.24%
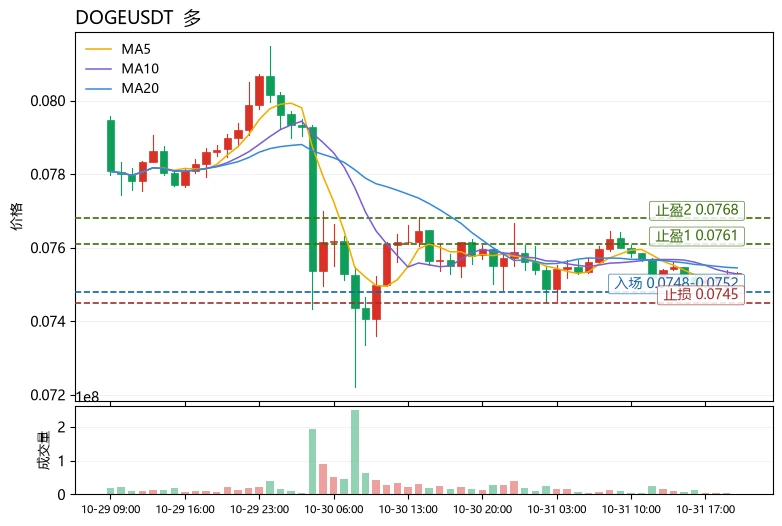
$DOGE $DOGE: Is it ultimately a weak performer dragging the sector down, or an undervalued relative outperformer within it? The answer leans toward the latter: with the Fear & Greed Index at just 30 and market sentiment subdued, $DOGE fell only 0.72% over 24 hours, with a range of about 2.87%—markedly smaller than $SOL 's 4.88% and $NEAR 's 4.94%. It had the best drawdown control of the three. MA5 remains slightly below MA20, so the trend has not fully turned bullish, but the MACD histogram has turned positive, RSI at 44.8 is neutral-to-low rather than oversold, and the Bollinger Bands have na
post-image
DOGE-0.22%
SOL-0.77%
NEAR+1.17%
$IDOL ‌
IDOL pumped hard from ~0.0103 to a 24h high of 0.0310 (+200%+), then sold off aggressively and is now trading around 0.0194 (+18.6% on the day). Volume spiked on the pump and has cooled. Price sits below the MA10 (0.0214) and MA30 (0.0211), with MACD turning bearish.
Key Levels
Support: 0.0185–0.0190 (current zone), then 0.0159–0.0165 (24h low area)
Resistance: 0.0210–0.0215 (MA10/MA30 cluster), then 0.024–0.026 and the 0.031 high.
Kline Deep Analysis
Strong impulsive green candles on high volume created the vertical move. After the peak, long upper wicks and consecutive red candles a
post-image
IDOL-6.71%
  • 11
  • 1
#英特尔财报超预期股价却暴跌 #Gate广场万圣节 Intel’s Better-Than-Expected Earnings—Why Did They Bring Its Worst Record in 40 Years?
After Intel released its earnings, its market value evaporated by about $150 billion overnight, equivalent to nearly RMB 1 trillion, marking its biggest single-day drop in more than 40 years, down 28.58%. But if you looked only at its third-quarter results, you might think you had the wrong report: revenue of $16.5 billion, up 21% year over year; adjusted earnings per share of $0.52, above expectations; and data center and AI business surging 78%, its fastest growth in 15 years.
It
INTC-28.49%
XAU+0.38%
XAG+0.47%
SPX500+0.19%
SPCX-6.34%
#ShareWeekly
ZEC: Bulls Are Facing a Critical Resistance Zone
Zcash is showing renewed strength, trading around $1,282 after recovering from the $1,208 support area. Buyers are regaining momentum, but the real test is now ahead.
The $1,287–$1,306 zone is the key resistance. A confirmed breakout could open the way towards $1,350–$1,380, followed by $1,400–$1,440. On the downside, $1,250–$1,260 is the first important support. Losing it could bring another test of $1,208.
Fundamentally, Zcash has two developments worth watching: the proposed NU7 upgrade, which aims to improve transaction speed,
post-image
ZEC+1.16%
BTC-0.67%
$LSK Up 35% in a day? I’m getting a familiar vibe.
The Fear & Greed Index has surged to 78, reaching the upper end of the greed zone. Funding rate is +0.093%, and longs are starting to pay shorts a hefty premium. 24-hour trading volume is 175 million, turnover has exploded, and the price shot straight from 0.1958 to 0.2949. It has now pulled back to around 0.2727, with a prominent upper wick.
Looking back: $LSK The last time the funding rate topped 0.09% was in mid-March this year, followed by an 18% pullback within 48 hours. Greed is 6 points higher this time, and the price has already run up
LSK-5.22%
  • 7
  • 2
[New Streamer] whales Moves in Sync!
live-cover
LIVE1,544
$AKE This waterfall sell-off was honestly expected. Sentiment across small-cap coins has cooled recently, and high-level holders are starting to loosen their grip. I nailed this one near 0.0135, riding a 25x short all the way to 0.0114 and locking in a solid 374% gain. The price action was almost exactly as I predicted—those who followed know.
The trade logic was clear: after the earlier surge, buying momentum visibly faded, price and volume diverged, the market maker showed little willingness to defend the price, and sell pressure piled up overhead. Against the backdrop of recent choppy actio
AKE+6.39%
DOGE-0.18%
  • 1
I just made a decision: next time around, I’m going all-in on put options on $MSTR !
Now I’m just hoping a black swan event pops up over the weekend and sends the market tumbling.
Why the sudden urge to do this? I’m just bored out of my mind on a plane...
Maybe I’ll wake up Monday to find all my positions closed.
Don’t take it seriously—this really isn’t investment advice. I didn’t even have a single dream this time; I’m just hoping some inspiration strikes tonight. 😂
$BTC
(The above is solely my personal opinion and does not constitute investment advice. Please assess market risks rationall
post-image
MSTR-2.01%
BTC-0.67%
Bitcoin is holding steady around $77,340 right now
What are your moves for the rest of the weekend?
#Bitcoin #Crypto #BTC
BTC-0.67%
  • 7
  • 1
Michael Saylor: Bitcoin Reserve company purchases reach 1.6 times the volume of miner production, cr
live-cover
LIVE1,571
$HANA Finally found some buyers. Nice trade. Profit: $ 253. Followed up today with $AIN and $ETH .
post-image
HANA-3.22%
AIN+3.85%
#GateWCTCS9全球交易赛 #辣妹儿李嘉欣
Trading competition stats for all the big-name streamers as of today. If it’s this bad, just disband the whole thing. The platform showed some decency this time and didn’t hide the streamers’ stats. No wonder your coins haven’t been stolen—you’ve finally found your conscience.
Looking at these competition stats, if you knew they were streamers, you’d think they were; if you didn’t, you’d think they were interns who graduated three months ago, moonlighting as traders!
Are you kidding me? Every day you’re making money in all kinds of trading ranges, and when there’s a b
  • 1
#BTC大跌 #ETH回落 #Gate广场万圣节 Strategy sharing for reference only; you are responsible for your own profits and losses.
BTC futures strategy (latest reference price around 77500)
BTC long at 76500 (stop-loss 76000)
ETH long at 2185 (stop-loss 2145)
⚠️⚠️
Use the levels flexibly. Don’t take oversized positions or stubbornly hold losing positions.
When volatility is low, wait patiently for opportunities. Don’t rush or get greedy.$BTC ‌
post-image
NorthWarm
#BTC大跌 #ETH回落 Strategy sharing, for reference only. You are responsible for your own profits and losses.
BTC futures strategy (latest reference price around 77500)
BTC long at 76500 (stop loss 76000)
ETH long at 2185 (stop loss 2145)
⚠️⚠️
Use the price levels flexibly. Don't take oversized positions or hold losing positions.
When volatility is low, wait patiently for opportunities. Don't rush or get greedy.
BTC-0.67%
  • 4
#HYPE逆市大涨 #Gate广场万圣节 The next BN? No, HYPE wants all of Wall Street
In 2006, AWS ushered in the era of cloud computing. Twenty years later, Hyperliquid is trying to bring the same infrastructure revolution to Wall Street.
Over the next decade, HYPE’s greatest potential is no longer becoming the next bn, but becoming the AWS capable of holding all of Wall Street.
1. Hyperliquid’s market position in 2026
According to blockchain data monitoring platform Defiliama, overall on-chain perpetual contract trading volume shrank 2.5% in the third quarter of 2026, while Hyperliquid bucked the trend with 9
HYPE+0.24%
  • 4
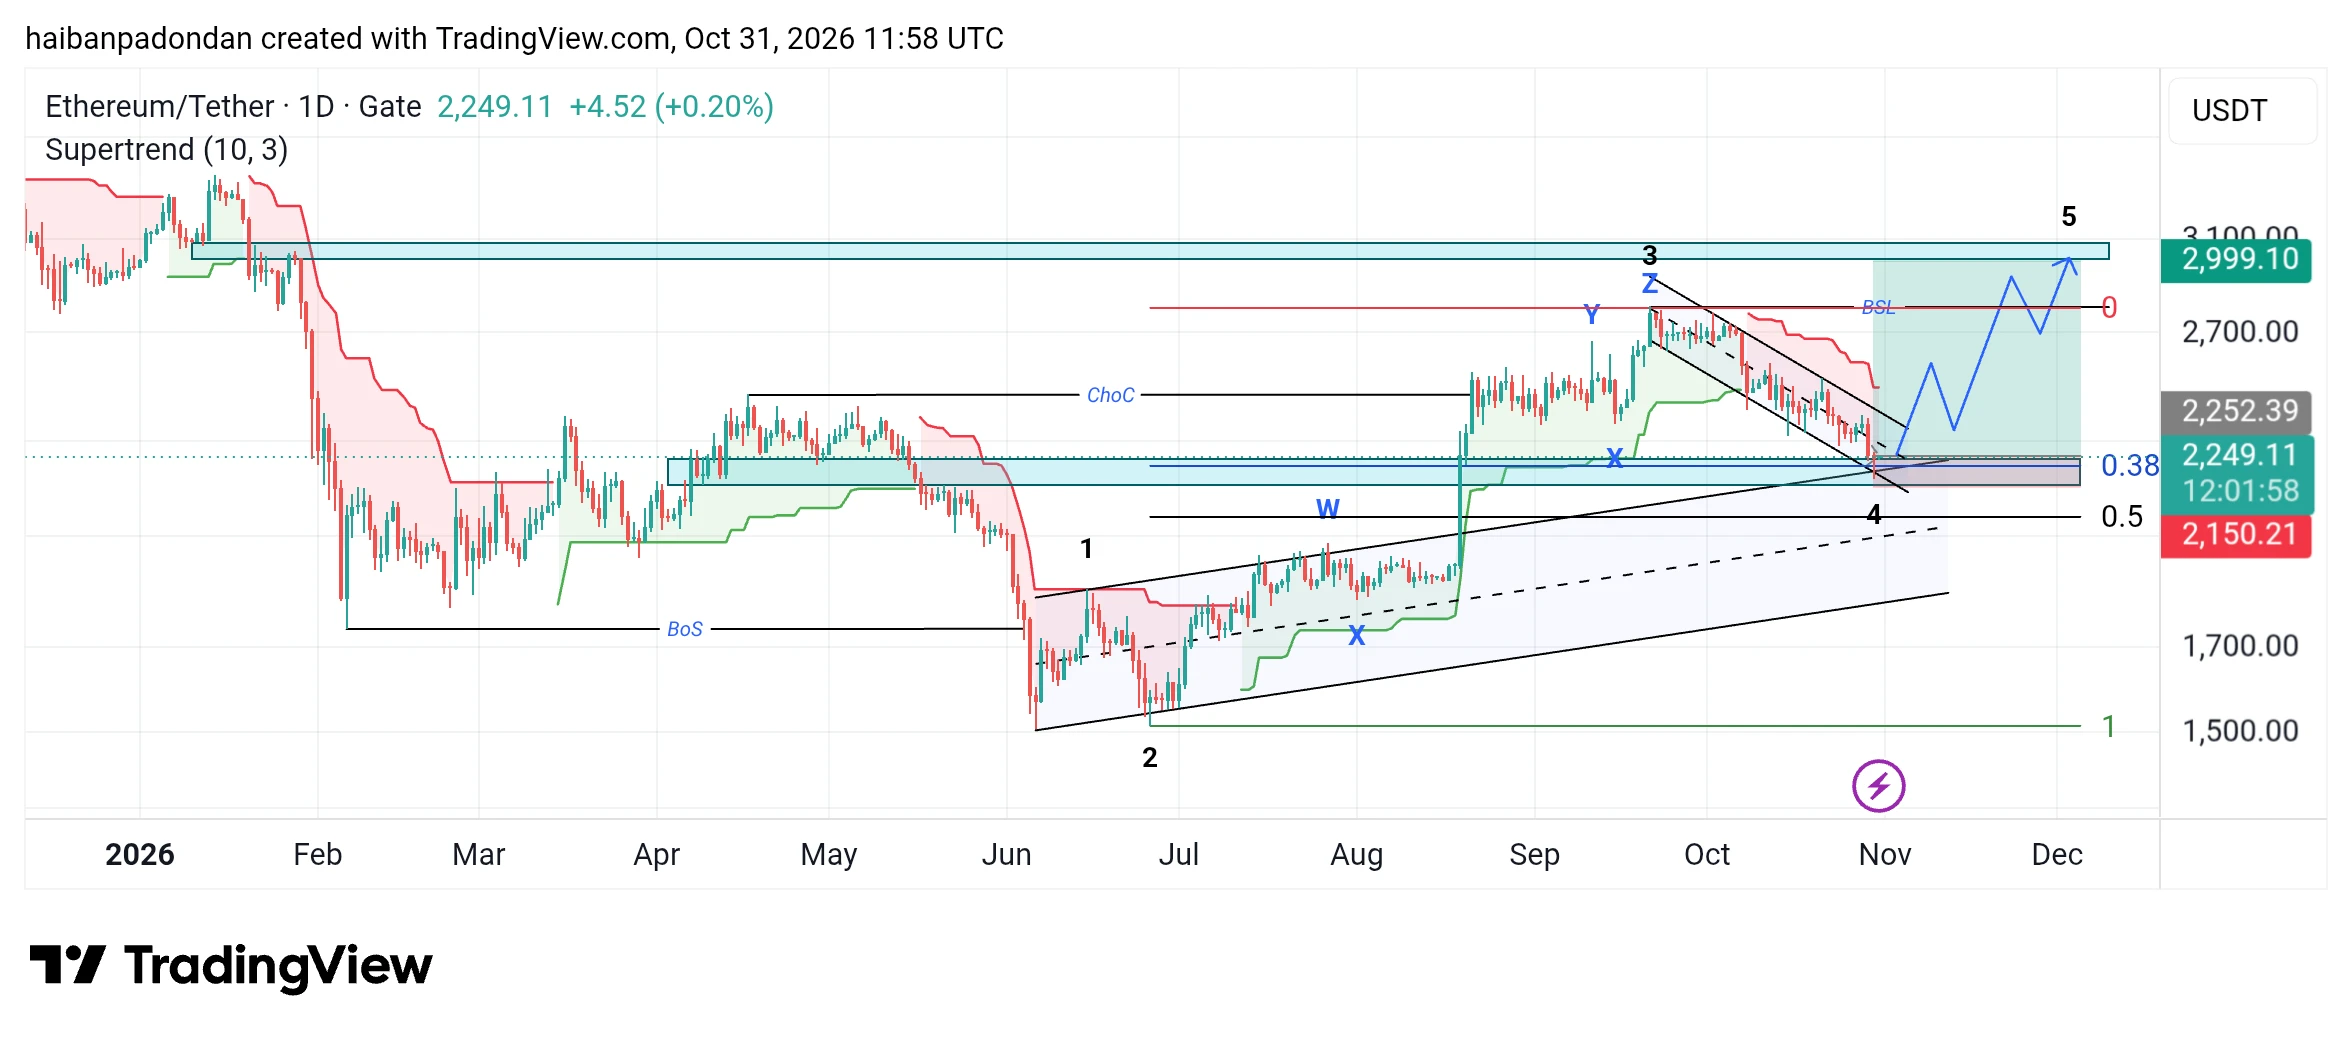
$ETH ‌In short, this chart presents predictions or scenarios for Ethereum’s future price movement, utilizing several popular technical analysis methods. Here are the key points we can gather from the image:
1. Downward Correction Pattern (Small Red Channel)
What is it? Look at the area near numbers 3 and 4 (around September–October), where the price moves downward within two parallel red lines.
What does it mean? This is known as a "corrective channel." When the price rises significantly, it is natural for a "resting" phase or a brief decline to occur. This decline is depicted as a downward s
post-image
ETH-1.26%
Load More

Join 40 M users in our growing community

⚡️ Join 40 M users in the crypto craze discussion

💬 Engage with your favorite top creators

👍 See what interests you

Trending Topics

BTC大跌

301.26k Views39.62k Discussing

$BTC briefly fell below $77,000 and remains under pressure around the $77K zone, with its 24-hour decline still above 4%. With risk appetite weakening and Fed uncertainty rising, where is the next key support after losing $80K?

IntelBeatsEarningsButStockPlunges

22.96k Views846 Discussing

StrategySTRCNears100ParValue

28.18k Views4.09k Discussing

View More