Square
Following
Hot
News
Notifications
Profile
Share your thoughts
placeholder
Article
Where can I buy this jacket @JensenHuang ?
Asking for a friend
post-image
What exactly is the difference between isolated margin and cross margin? Why can the same loss have completely different effects on your entire account?

In crypto contract trading, many people focus on leverage, entry price, and stop-loss levels, but overlook an equally important question:

Are you using isolated margin or cross margin?

These two margin modes affect how margin is allocated, how account funds are used to bear risk, and how far losses from a position may spread.

The core difference between isolated and cross margin is not that one is necessarily safer, but how margin is used
post-image
Trenches
ZIG
Z
bade
b
ZIG
0x8c...1145
Market Cap
$.
Change
.
24h Vol
$.
Holders
.
BTC
B
bade
b
BTC
C5xp...pump
Market Cap
$.
Change
.
24h Vol
$.
Holders
.
STONK
S
bade
b
STONK
6GmA...UNgx
Market Cap
$.
Change
.
24h Vol
$.
Holders
.
ANSEM
A
bade
b
ANSEM
9cRC...pump
Market Cap
$.
Change
.
24h Vol
$.
Holders
.
牛逼
牛
bade
b
牛逼
0x96...7777
Market Cap
$.
Change
.
24h Vol
$.
Holders
.
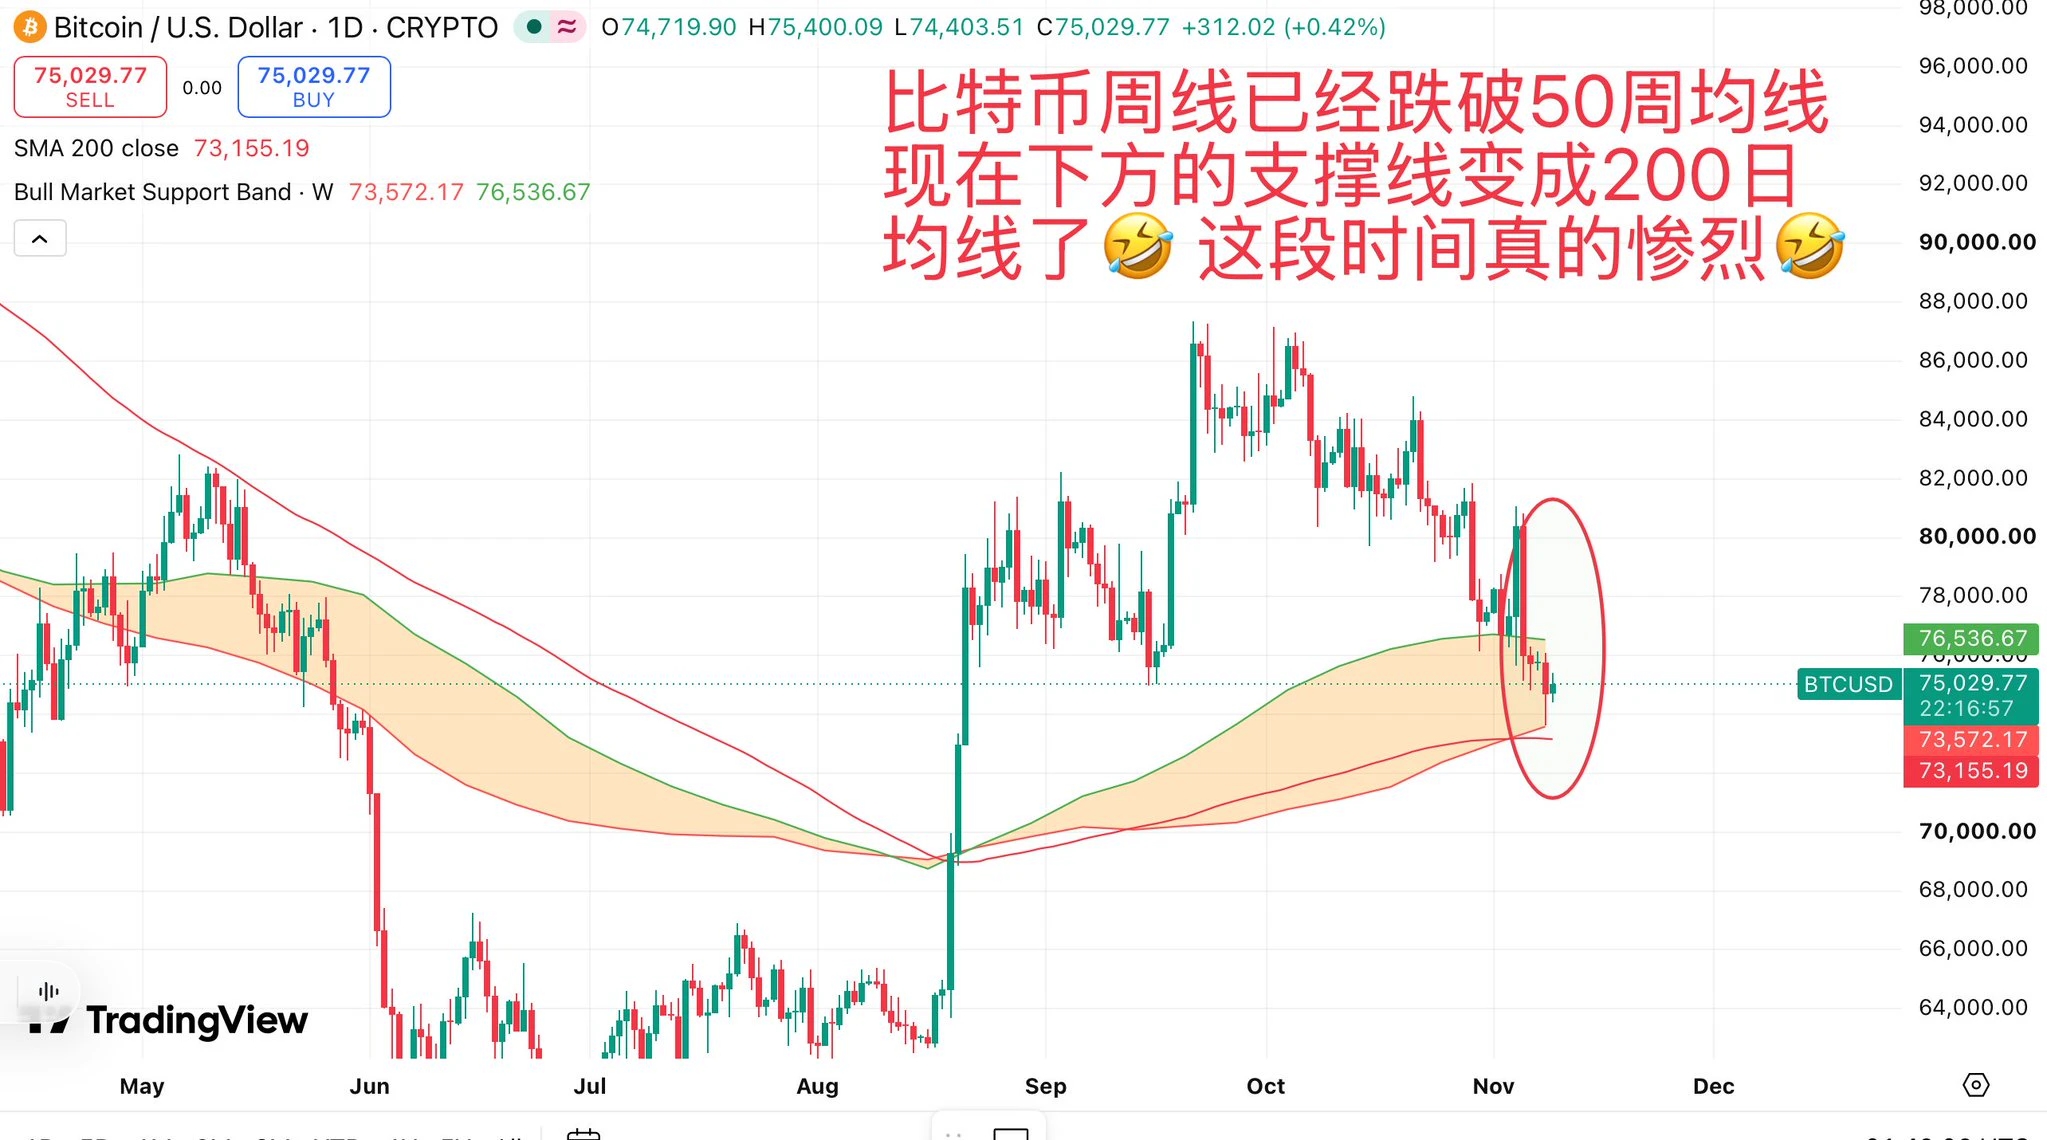
Bitcoin's recent price action has been so brutal, it's hard to know what to say! 🤣

Just a few days ago, it was battling the 50-week moving average. Now it's fallen below that line too, with BTC around $74,900. It's fallen all the way from $87k, and each rebound has grown weaker as one support level after another has given way.

Looking lower, the 200-day moving average is at $73,154, while the lower edge of the weekly bull-bear support band is at $73,572. The two levels are almost right on top of each other. Looks like the area around $73k is about to see another tough battle! Honestly, this
post-image
BTC-0.65%
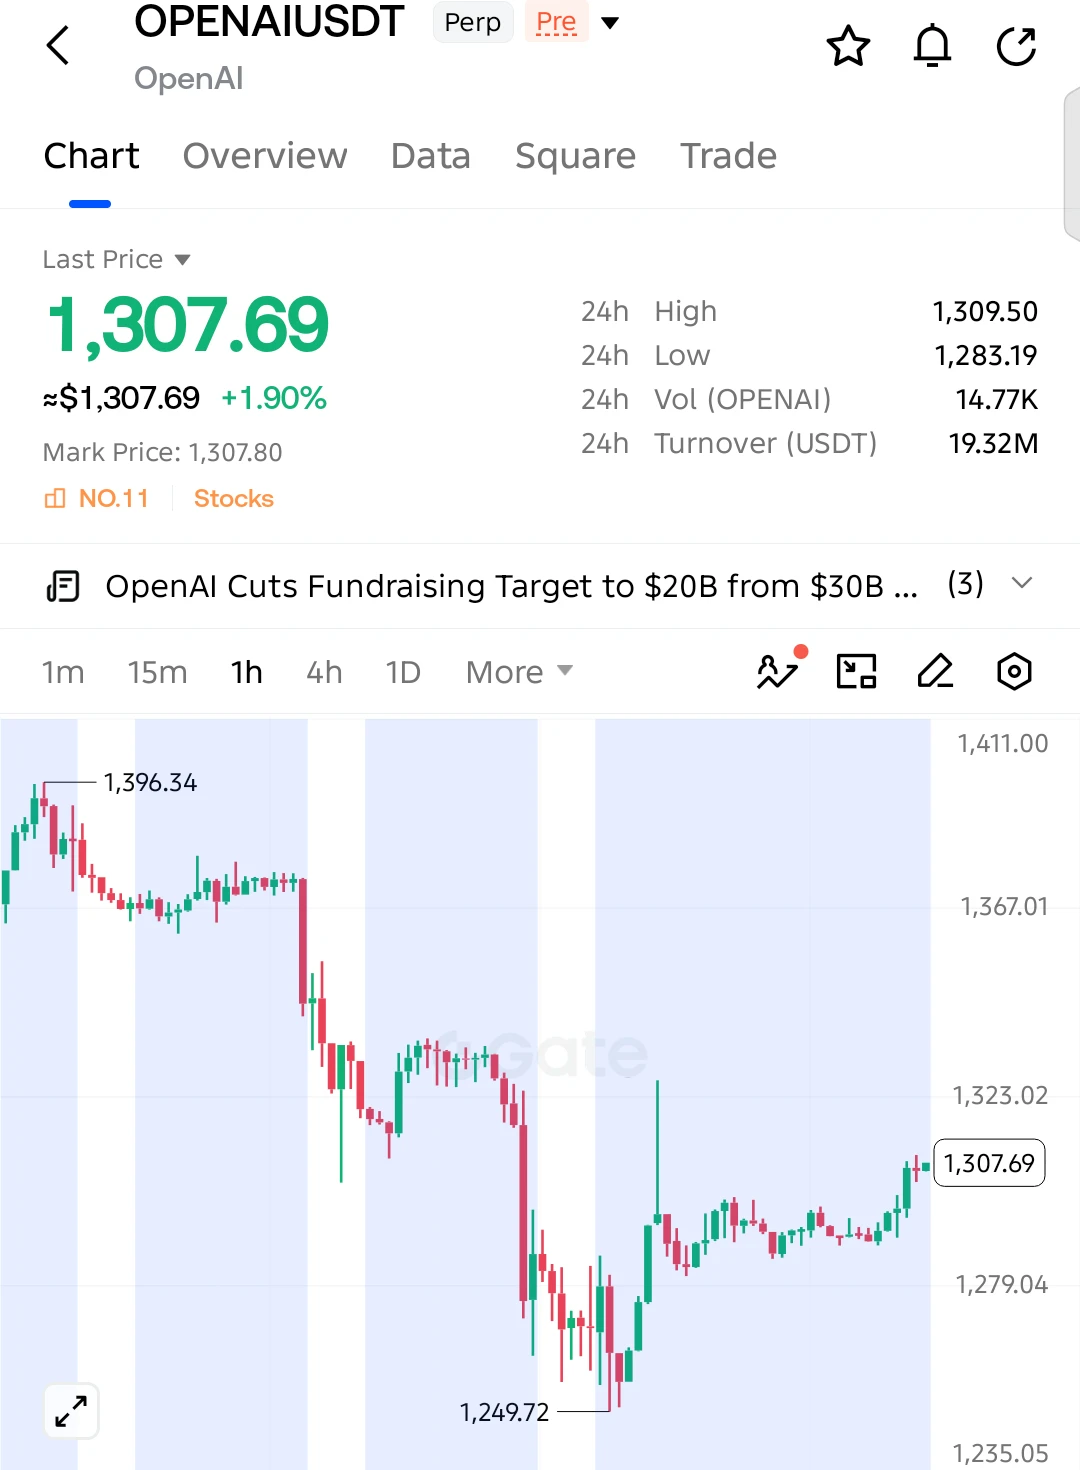
🚀 $OPENAI LONG SETUP — BUYERS PUSHING FOR A BREAKOUT!

$OPENAI is up 1.90%, recovering strongly from 1,249.72 as buyers gradually regain momentum. Price is now approaching a crucial resistance level!

Entry: 1,307.69
SL: 1,294.50

TP1: 1,323.00
TP2: 1,338.00
TP3: 1,350.00
Final Target: 1,367.00

Buyers are showing renewed strength after the sharp sell-off, with higher lows supporting the recovery. A sustained breakout above 1,309.50 could open the door toward 1,323 and potentially 1,367.

Invalidation: A sustained break below 1,294.50 weakens the bullish setup.

Keep your eyes on $OPENAI!
post-image
OPENAI-0.04%
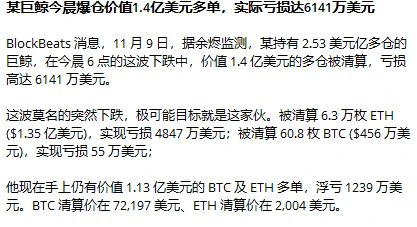
Not sure whether it will liquidate this whale: BTC liquidation price, 72197; ETH, 2004
post-image
Apple is also stepping up its AI arms race! The CEO is personally urging the software team, and Siri
live-cover
LIVE1,836
Why Holding 10 Cryptocurrencies May Still Leave You Exposed to the Same Risk

Many investors believe that as long as they don’t put all their money into Bitcoin, buying Ethereum, SOL, BNB, and other tokens will reduce their portfolio risk.

But there’s an easily overlooked problem:

Holding more assets does not mean your risk is truly diversified. What matters is why these assets rise or fall, and how they behave under market stress.

I. Holding Different Coins Doesn’t Mean You Have Different Sources of Risk

Suppose you hold BTC, ETH, SOL, and several other crypto assets at the same time.

Th
post-image
BTC-0.67%
ETH-1.26%
SOL-0.77%
BNB-0.76%
$BTC
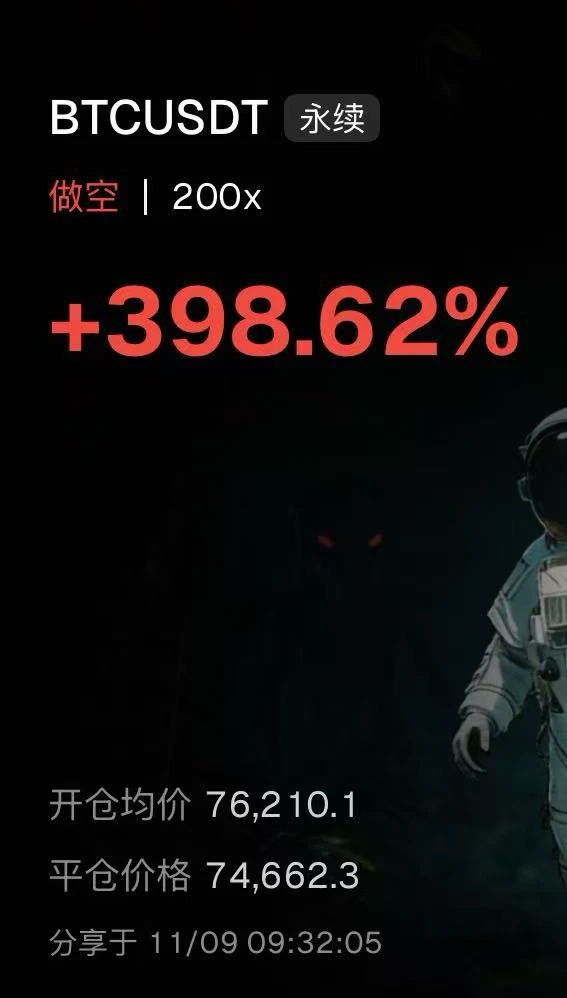
The downtrend continues, and another short trade scores a win
After the sharp overnight sell-off, the market entered a weak recovery. It rebounded to around 76210, met precise resistance, and pulled back. The short was entered with the trend and closed successfully for profit at 74662, delivering a 398.62% return with 200x leverage.
#70%山寨币跌破200日均线
The broader downtrend channel has now opened up, and every rebound is an opportunity to enter a short at a higher level.
Stay focused on shorting with the trend, avoid blindly buying the dip, and simply follow the trend to steadily lock in pr
post-image
BTC-0.67%
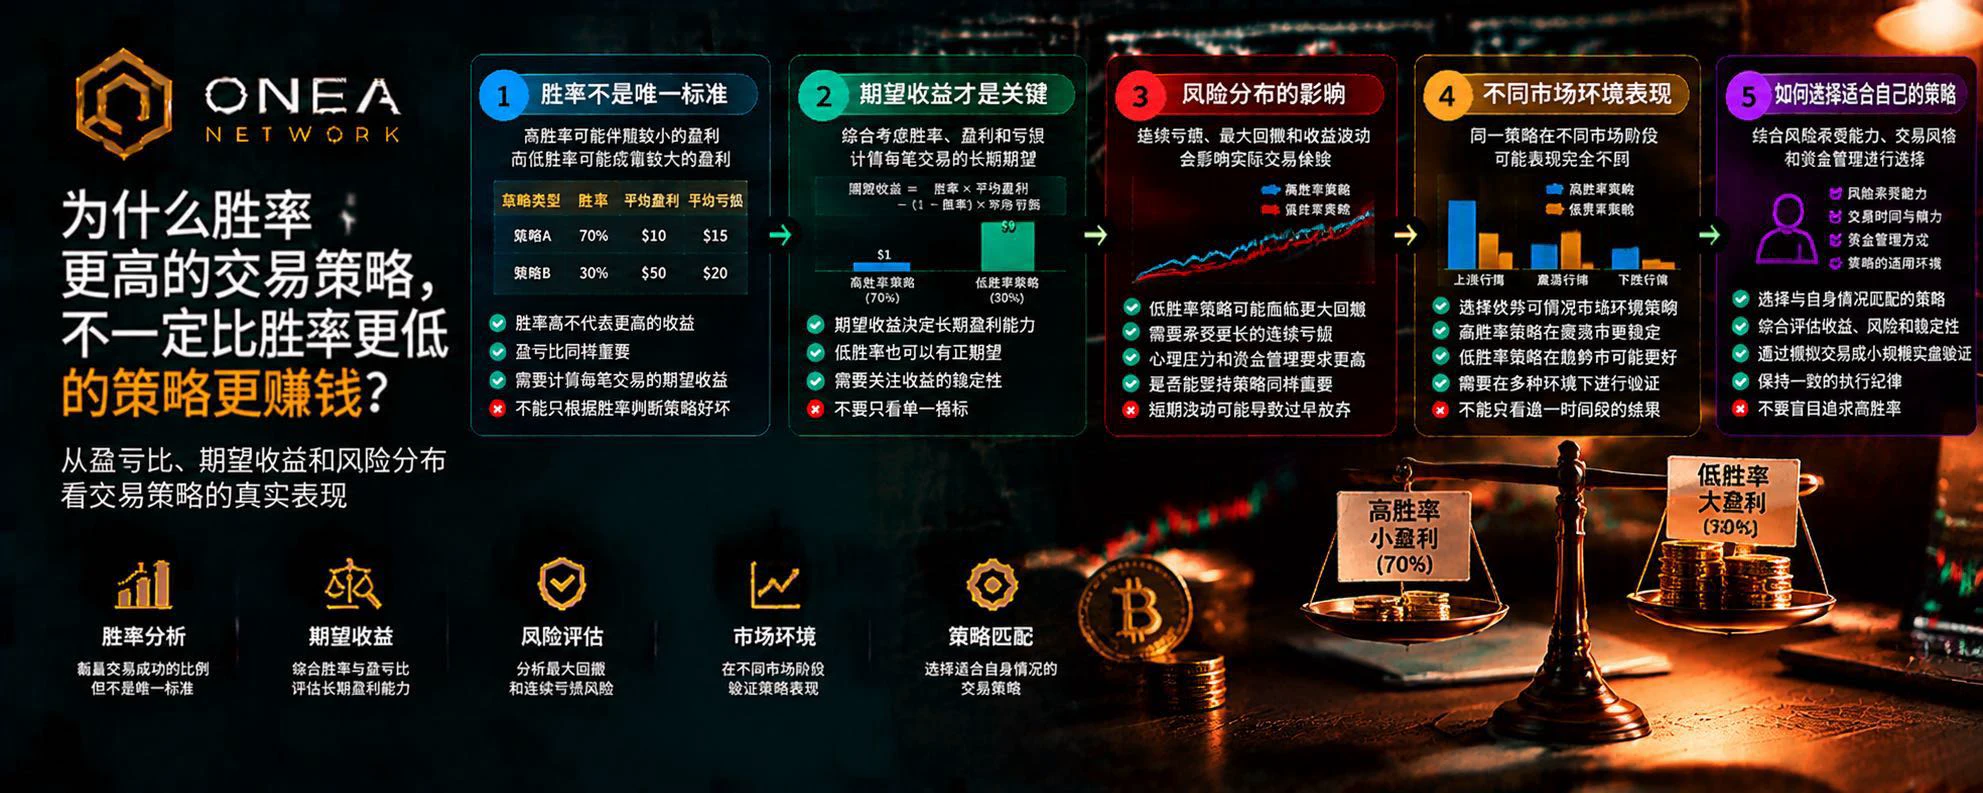
Why Can a Strategy with a Higher Win Rate Be Less Profitable Than One with a Lower Win Rate?

Many traders have an intuition: the higher the win rate, the stronger the trading ability, and the more money they should make.

But in real trading, this judgment is often wrong.

Some strategies win seven out of ten trades, yet the account keeps shrinking; others win only three or four out of ten trades but may perform better over the long term.

Why?

Because long-term trading performance depends not only on the win rate, but also on average profits, average losses, trading costs, and the distribut
post-image
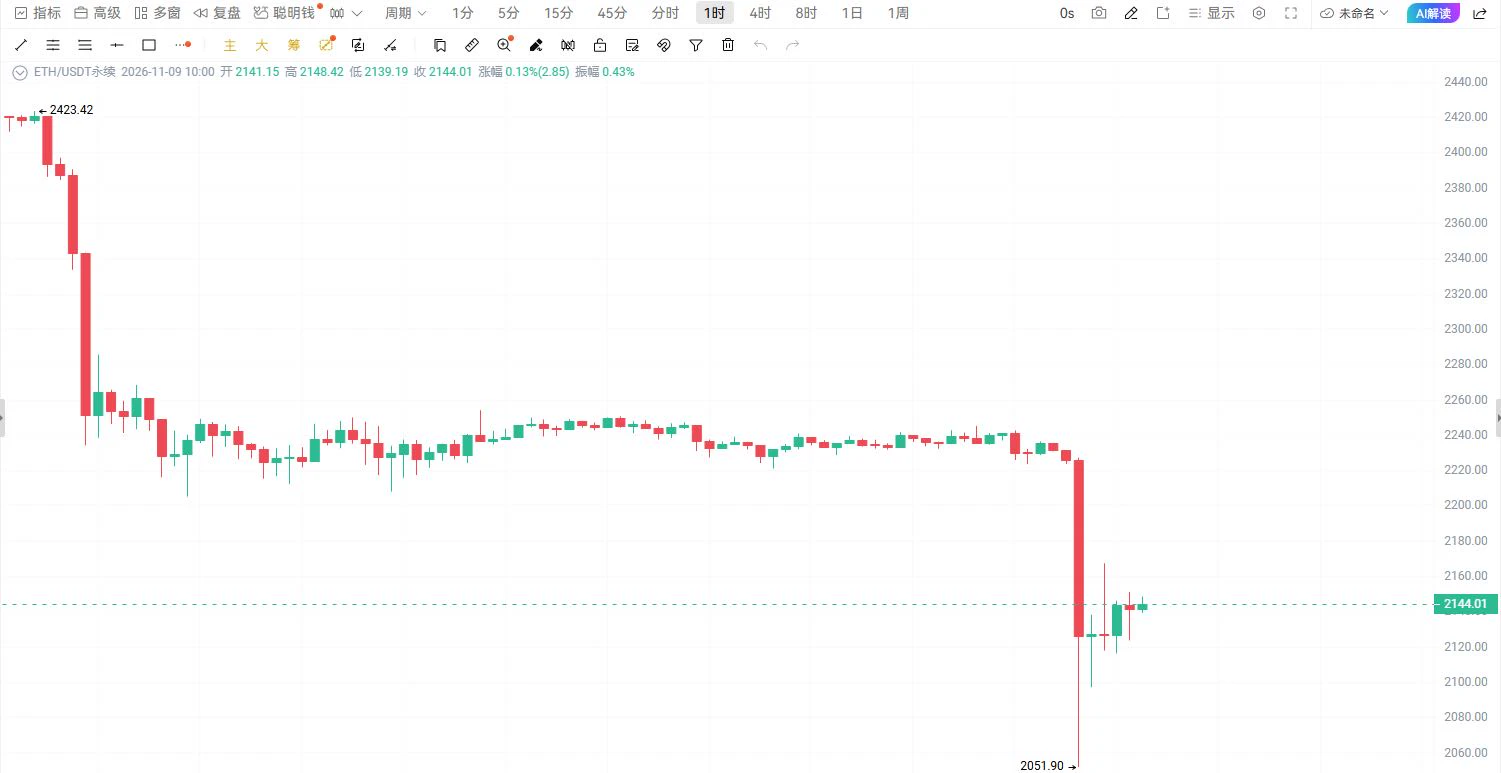
11.09 ETH Market Analysis

Trade setup: Around 2160-2180, invalidation level at 2200, targets 2100/2060.

ETH is currently at 2144. After an extreme one-way plunge from 2253 to 2058, the market is now consolidating weakly at low levels. Moving averages across all timeframes above are sharply diverging to the downside, and the overall bearish structure remains dominant.

The current price is close to the previous low support below, limiting the room to chase a move lower and increasing the risk of a short-term rebound. The 2160-2180 area above is a secondary consolidation platform during this s
post-image
ETH-1.23%
Why Does It Become Increasingly Difficult to Break Even After Consecutive Losses?

In the trading market, many people have experienced this process:

After a 10% account loss, they think it is no big deal and they can just earn it back.

After a 20% loss, they start to panic and want to increase their position size to break even faster.

After a 30% loss, they start trading frequently, trying to catch every rebound.

By the time their account has shrunk further, they realize they are already trapped in a cycle that is increasingly difficult to escape.

But the truly harsh reality is this: loss
post-image
November 9 $ETH Focus on shorting rallies; enter and exit quickly.

【Today's Strategy】
Short entry zone: Set up on a rebound to 2150—2180
Stop-loss: Above 2195
Take-profit: Target 2080—2055

【Core Logic】
The 1-hour chart has seen two rounds of high-volume declines, followed by sideways consolidation and then another breakdown to a new low. The overall downtrend is clear, with bears fully in control. The 2150—2180 zone is where support from the previous trading range has turned into resistance, with selling pressure concentrated from trapped holders and profit-takers. A rebound to this area off
post-image
$SOL Yaoyao | 11.09 Solana Strategy
Entry: Short near the rebound at 88.60-89.10
Support zone: 86.80 - 87.20
Upside levels: First resistance at 88.60, strong resistance at 89.10; historical high resistance at 89.98
Pullback target: 86.80-87.20

Trend structure: The main downtrend began at 89.98, with a long bearish candle driving the price down to a low of 84.66. A bearish-led downtrend structure is now in place. The current rally is merely a corrective rebound after being deeply oversold, not a bottom reversal. A reversal requires lows to keep rising and a break above the previous high; there
post-image
SOL-0.74%
🔥Called it perfectly—nailed the 73,000 target!
Bitcoin hit a turning point at 80,800, and we stuck firmly to the short side, calling the 73,000 target in advance. It rebounded to the 76,000 level along the way, then plunged violently to a morning low of 73,333, coming extremely close to our 73,000 forecast. This high-level short trade swept up nearly 7,500 points, with not a bit of the gains left on the table!

Ethereum delivered a synchronized heavy-hitting harvest. We firmly positioned for shorts at 2,440, ignored minor rebounds in the market, and rode the decline straight to 2,050, capturi
BTC-0.65%
ETH-1.23%
Why Do Spot and Contract Prices Trade at a Premium or Discount?

Sometimes, you may notice that the BTC spot price and perpetual contract price are not exactly the same.

When the contract price is higher than the spot price, it is generally called a premium; when the contract price is lower than the spot price, it is generally called a discount.

Why does this happen?

Some believe that a premium means the market is bullish, while a discount means it is bearish.

But the reality is much more complex.

Price differences between spot and contract markets reflect not only market sentiment, but m
post-image
BTC-0.65%
Why do some trading strategies make money in backtests but fail to cover trading costs in live trading?

A trading strategy shows profits every month in backtests.

But once you start trading for real, you find that your account returns are far below expectations. You may even predict the market direction correctly, yet your balance keeps falling.

The problem may not be that you misread the market, but that you underestimated trading costs.

Profits in a backtest are only theoretical results. Returns after deducting real trading costs are closer to the money you actually get to keep.

I. Trad
post-image
On September 24, I started viewing NBIS (Nebius) as showing “wealth growth”; it was then at 243. By today, October 9, “wealth growth” had reached a low of 113.3. It reached the target of 115.9. The “wealth growth” was 53%. Not bad. Will there be more “wealth growth”? I share my thoughts in image 2. [NBIS is an AI computing center; I haven’t been optimistic about it since September 24.] ​​​$NBIS ‌
NBIS-3.14%
$400B wiped from Crypto during "UPtober" and "Moonvember."
post-image
🔹Democrats Sweep Congress: Is a Major Shift Coming for Crypto? Tighter SEC Oversight and Prediction
live-cover
LIVE3,030
  • 1
Do you think you made money because you researched deeply enough? Could it be you just happened to catch the start of a rally?
In a bull market, you can make money by researching just a few projects, making you think you have a knack for picking winners.
The bear market is the opposite: the more you research, the more bullish you become; the more bullish you are, the harder it is to sell. You buy the dip, add more when it gets cut in half, and eventually research your way into becoming a bagholder.
Many people only research why a project is worth buying, not why the market might keep falling.
post-image
Load More

Join 40 M users in our growing community

⚡️ Join 40 M users in the crypto craze discussion

💬 Engage with your favorite top creators

👍 See what interests you

Trending Topics

USCPIDataIncoming

22.8k Views1.72k Discussing

The U.S. October CPI report will be released on November 10 at 8:30 a.m. ET. September CPI came in at 3.7% year over year, and markets will be watching closely for signs that inflation is cooling, especially in core CPI. A softer-than-expected reading could strengthen rate-cut expectations, while hotter inflation may pressure risk assets through higher Treasury yields and a stronger dollar. How do you think this CPI print will move $BTC, U.S. stocks and gold?

BTCFlashCrash

22.73k Views66.04k Discussing

USAIStocksHitHard

31.41k Views3.75k Discussing

View More