Share your thoughts
placeholder
Article
For yesterday’s subscription trade, the ETH add-on entry was at 2465, and the BTC entry was at 66700. The first take-profit target is almost here! Be ready to reduce your positions, then hold for the other take-profit targets!!
post-image
ETH-0.44%
BTC+0.44%
$SNDK No funds are coming in to take over the position—how am I supposed to get out?
post-image
SNDK-3.73%
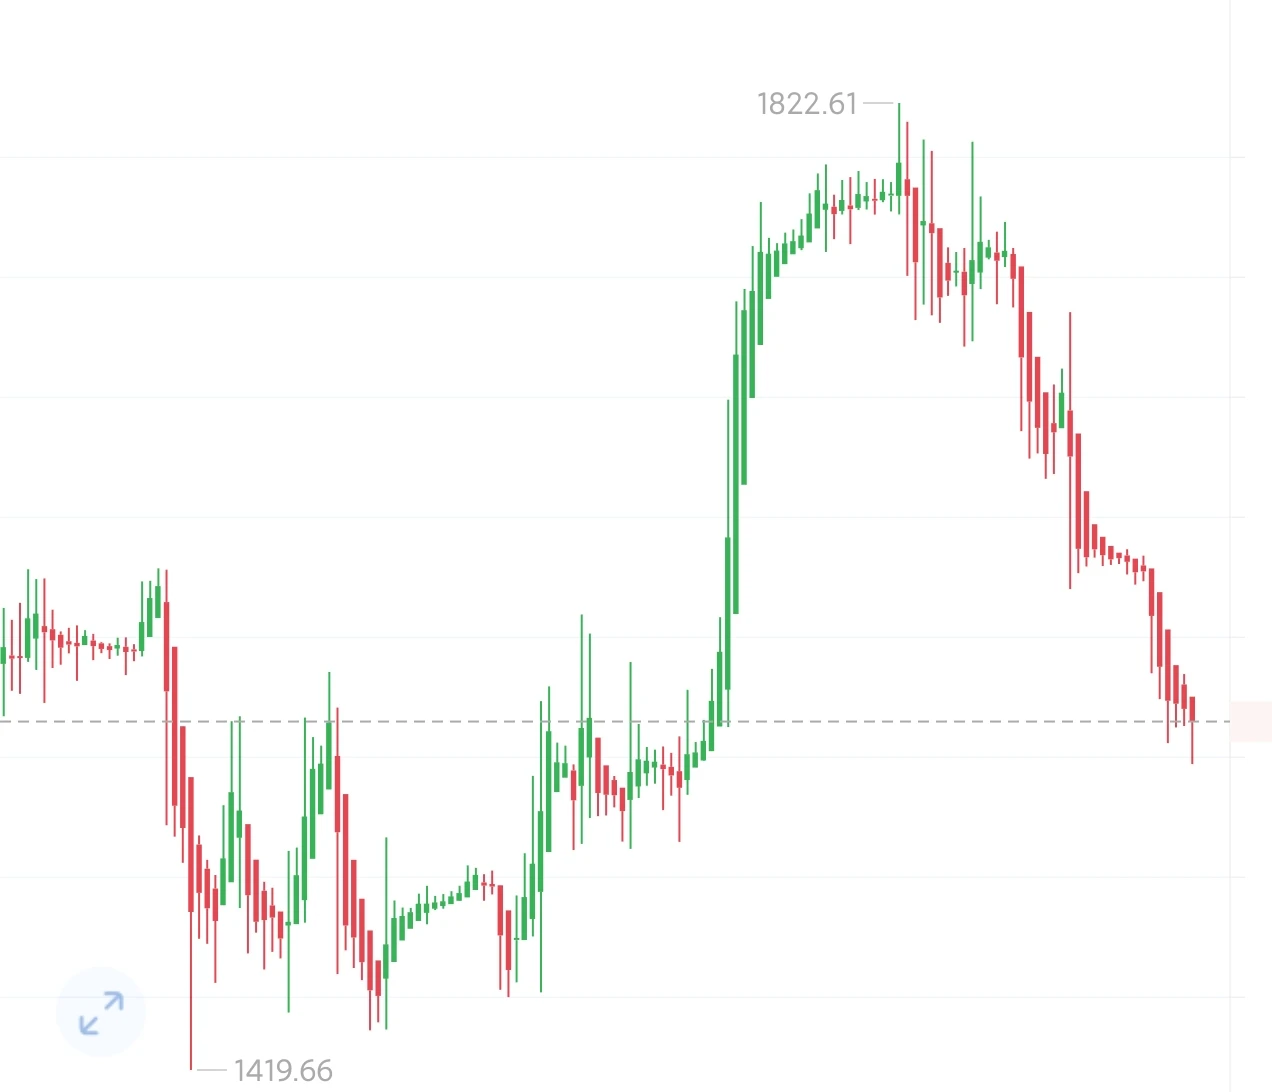
XAUT’s daily chart is undergoing range-bound consolidation and recovery, with the price fluctuating around the short-term moving averages. The moving averages are converging and flattening, while the Bollinger Bands are narrowing, with volatility continuing to contract as the market awaits direction from news catalysts. The red MACD histogram bars above the zero line are shrinking, indicating insufficient bullish momentum; KDJ is repeatedly crossing within the neutral zone, with clear short-term shakeout activity.
On the 4-hour chart, the Bollinger Bands are narrowing, and the price is fluctua
post-image
XAUT-0.49%
Is the history of 16 rate hikes in 1988 repeating?
BTC’s “tightening stress test” has only just begun...
From March 1988 to May 1989, the Federal Reserve raised rates 16 consecutive times, for a cumulative 331 basis points. At the time, no one knew how many hikes it would take before stopping.
More than 30 years later, Citi’s latest report has once again compared the current macro environment with that period of history—and the similarity has clearly increased.
August PPI rose 5.4% year on year, up 0.7 percentage points from the previous month and exceeding expectations. Core CPI rose 0.3% mon
post-image
ETH-0.44%
BTC+0.44%
SOL-0.94%
[ New Streamer ] Today Market Talk
live-cover
LIVE2,065
How is this a rebound? This is CPR for my empty account, isn’t it?
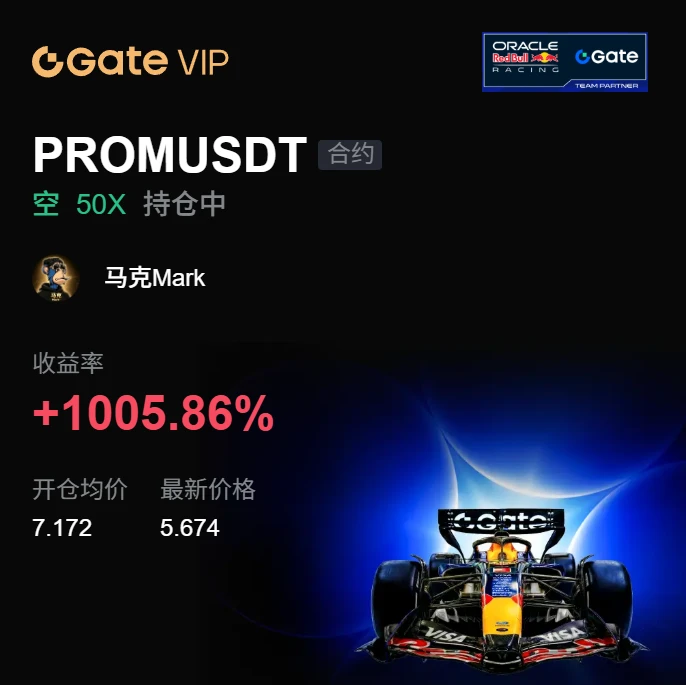
A few days ago in the afternoon, the market was moving painfully slowly. While everyone was still watching from the sidelines, I had already spotted the selling pressure above it. Every time it pushed toward a key level, volume shrank. The resistance overhead was too obvious, and volume failed to follow—clearly, someone was using the rebound to unload. I decisively went long around 7.172, opened a short position, and wasn’t expecting to get rich in one go. I just waited for it to lose momentum on its own.
I just took a look—the
post-image
BNB-0.74%
DOGE-1.07%
Gate Transparency Report — August 2026
Gate has released its August 2026 Transparency Report, offering a clearer look at its reserves and platform transparency. 🔍
The report highlights Gate’s commitment to transparency, user asset security, and responsible crypto operations — important factors as trust and proof of reserves become increasingly important in the crypto market.
A strong step toward greater confidence for the Gate community. 🚀
#Gate #Gateio #TransparencyReport #Crypto #Web3
$SPCX$HK50 $NAS100
post-image
SPCX+1.95%
HK50+0.37%
NAS100-1.22%
  • 1
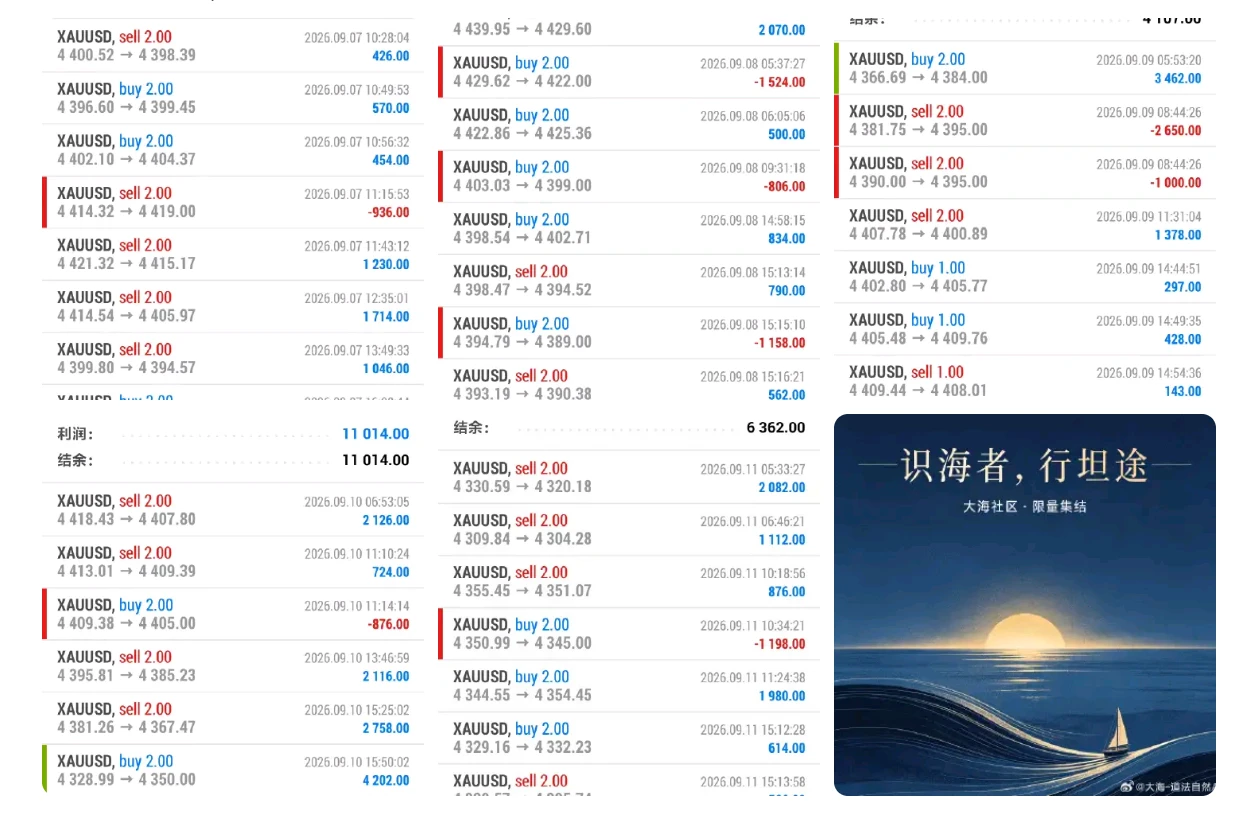
King Wen recognized Jiang Shang, and thus grasped the grand trend of the world;
If you understand the ocean, investing naturally has a smooth path.
The market is like the sea, full of unpredictable twists and turns.
Some drift with the current, while others row against it,
But what we must do is harness the waves and head straight for the vast sea.
The Da Hai Community has officially opened limited enrollment.
We know that true hands-on practice leaves no room for even the slightest perfunctory effort.
To ensure the quality of guidance, participation slots will be strictly limited this time.
W
post-image
XAU-0.54%
This week’s two major crypto “mystery boxes” are about to be opened🎁
At 14:15 Eastern Time on Tuesday, the Senate will open the CLARITY Act mystery box first; at 2:00 a.m. Wednesday, the Federal Reserve will unveil the “bonus surprise” at its rate meeting—the prediction market is pricing in an 80% chance of a 25-basis-point hike. Is this meant to cool the market down or give it a hand warmer?🤔
Let’s wait for the two “major events” to unfold and see whether they bring surprises or shocks!
Layout for Bitcoin, Ethereum, and Dogecoin
live-cover
LIVE1,843
I wasn't watching the charts or thinking about it—it was jumping on its own, as if working overtime for me.
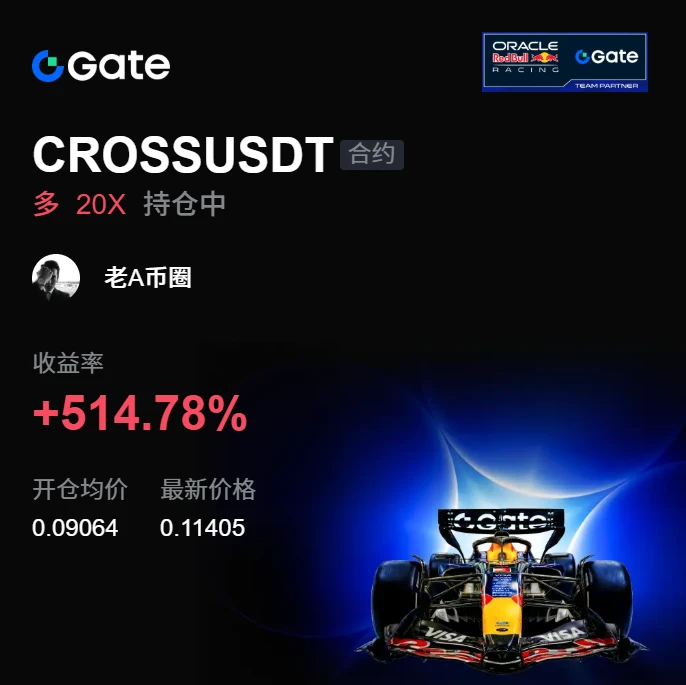
The last thing I saw before bed was $CROSS , with funds quietly entering and the bids below unusually thick. I only said: no need to panic at this level. When I opened the charts first thing in the morning, it had completed the move I wanted to see.
0.09064 to 0.11432, +514.78% sitting right there. I took 80% off the table first, and placed the remaining 20% at the entry price for protection.
You wait for the market to move, and hold for profits. Take another look when a new structure for
post-image
CROSS+0.48%
SNDK-3.73%
XRP+0.72%
🌕 Moonlit Mid-Autumn, gather on Gate Live!
The moon is full and the market is hot. Watch Gate Live streams to earn points, go live to climb the leaderboard, and win USDT rewards plus Mid-Autumn limited-edition gifts!
👀 Watch live streams
Watch live streams and participate in interactions to earn points. The first 100 qualifying users can randomly receive 1–5 USDT, with a chance to win a Gate Mid-Autumn limited-edition gift box!
🎙️ Go live as a streamer
Go live with the [Mid-Autumn] theme. The TOP 20 will split 5,000 USDT in position experience vouchers, while the TOP 3 will additionally rec
post-image
#weeklyshare #LSK #ShareWeekly
🚀 LSK JUST DELIVERED A MASSIVE PUMP — BUT WHAT COMES NEXT?
Lisk (LSK) has suddenly become one of the most explosive movers on the market. The price action over the last day has been extraordinary, with LSK showing just how quickly momentum can build when buyers aggressively enter the market.
Yesterday, LSK dropped as low as $0.5059 before completely reversing direction. From that low, the token launched into an aggressive rally and eventually reached a remarkable high of around $2.3523. That move represented an increase of roughly 450% from the low, turning LSK
LSK-49.91%
  • 3
  • 1
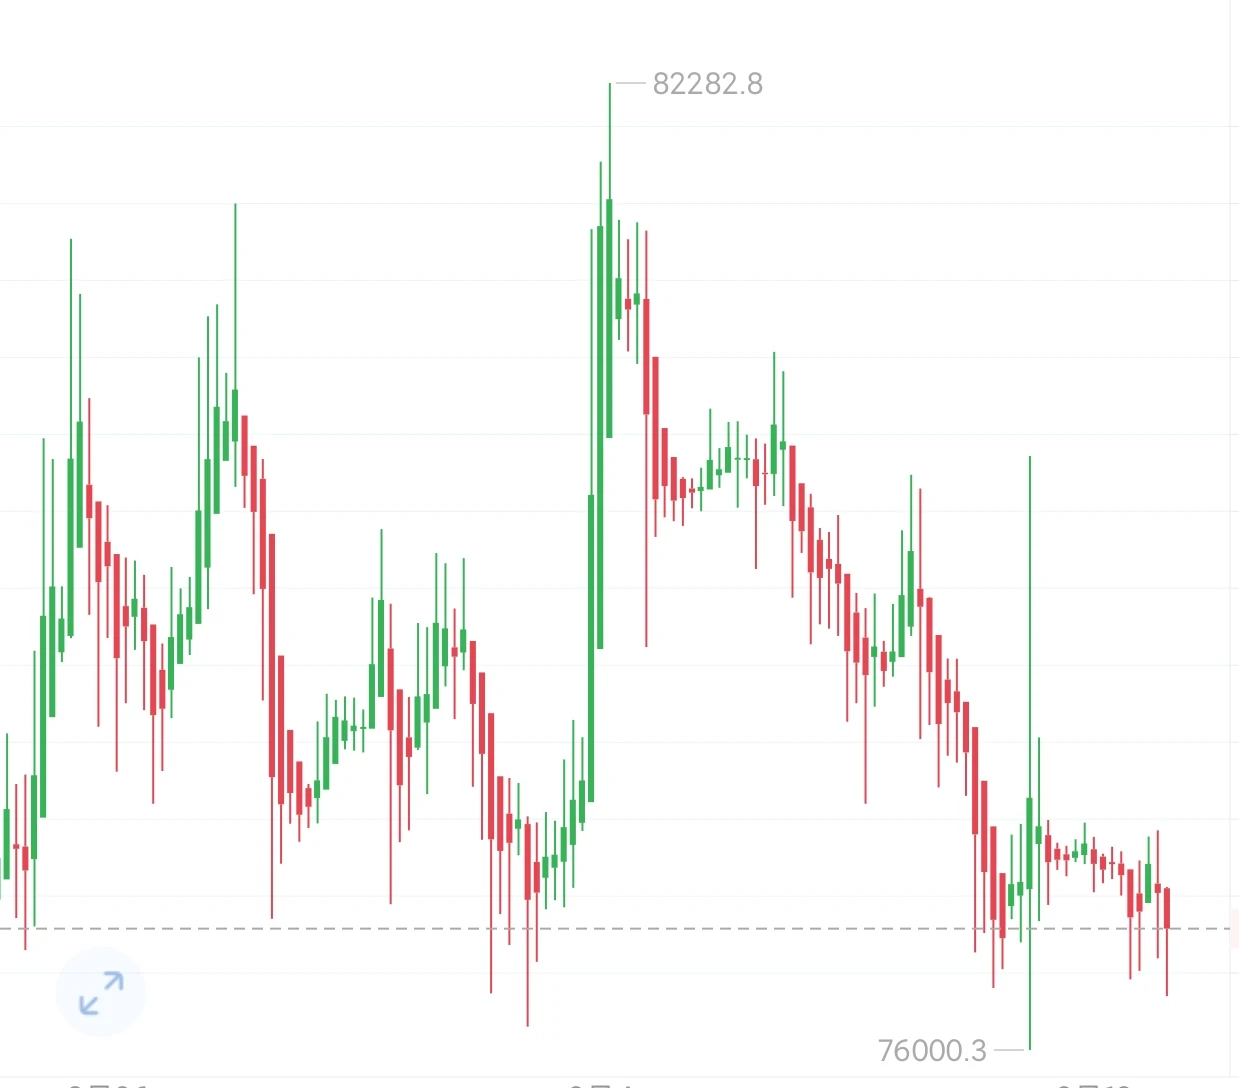
Under the dual pressure of expectations for interest rate hikes and geopolitical factors, the market shifted into a consolidation pattern after retreating from its highs. The current rebound is merely a technical correction and does not represent a trend reversal.

On the four-hour chart, the price came under pressure and moved lower at the 82282 double-top level, then formed a V-shaped rebound around 76000. However, upward momentum was insufficient, and rebound highs continued to decline. The MACD red bars are steadily shrinking, with bullish strength continuing to weaken, while the short-te
post-image
BTC+0.44%
Right now, whether it’s BSC or RH, BSC and Base are all waiting to see what happens after the 17th.

If BTC stabilizes and breaks above $82,000 after the 17th, many people will chase the rally. The early bull market has already been confirmed.

But I feel that even if there is a rate hike, BTC will pull back to $74K in the short term, then quickly recover the next day. By the end of the month, it will exceed $82,000. After the early bull market is confirmed, exchanges will start moving, and all chains will see another, even stronger bull run coming at us.
For now, those with positions should
post-image
BTC+0.44%
牛来-17.58%
MARSCOIN-19.15%
PONS-8.58%
JPMorgan: Expects the Federal Reserve to raise interest rates by 25 basis points each in September and December 2026, compared with its previous forecast of one hike in December.
A busy morning: 215.21 (down 13.28 on SOL) 😄
SOL-0.94%
SNDK pulled back from the highs after a sharp rise on the daily chart, with the price holding above the Bollinger middle band. The higher-timeframe bullish structure remains intact, but upward momentum is weakening, entering high-level range-bound consolidation.
The 4-hour chart surged before retreating, falling below the Bollinger middle band and moving lower, with the highs gradually declining, indicating a short-term pullback bias. The hourly chart is near the Bollinger lower band, presenting an opportunity for a short-term rebound and recovery. This rebound is a recovery during the pullbac
post-image
SNDK-3.73%
$FIL /USDT is range-bound by day but the 1h setup is begging for a short

$FIL /USDT - SHORT

Trade Plan:
Entry: 1.002 – 1.016
SL: 1.099
TP1: 0.942
TP2: 0.897
TP3: 0.829

Why this setup?
Why now? The 1h price is sitting at 1.009 inside a tight entry zone between 1.002 and 1.016, and the 1h ATR of 0.028824 shows enough volatility to fuel a move toward the first target at 0.942. The daily trend is range, which means the market is coiled and looking for a directional release, and the 15m RSI at 65.76 suggests momentum is still tilting bearish enough for shorts to work. If price pushes to the s
FIL+20.19%
  • 2
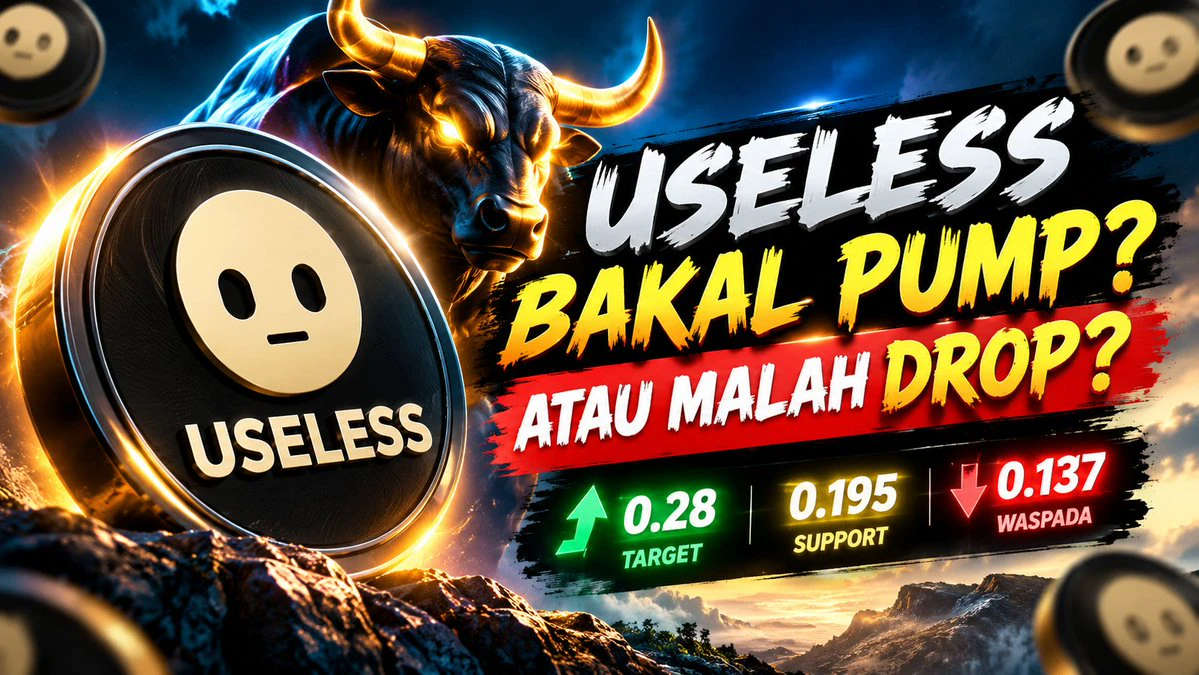
⚠️ USELESS After a Crazy Pump, Will It Explode Again? via @YouTube
#USELESS #DIDICHANEL
post-image
USELESS-13.39%
Geniuses usually use both hands. You can’t hold it with just one hand.
Load More

Join 40 M users in our growing community

⚡️ Join 40 M users in the crypto craze discussion

💬 Engage with your favorite top creators

👍 See what interests you

Trending Topics

AnthropicPicksNasdaqForIPO

71.68k Views2.58k Discussing

The related rumor has heated up valuation discussions around unlisted AI companies and also linked SpaceX's secondary-market performance with primary-market sentiment. However, it remains an unconfirmed market rumor for now.

Gate 24H Futures Open Interest Tops $11.479B

4.03k Views113 Discussing

Korea Stocks Plunge 3.14% at Open

43.94k Views4.77k Discussing

View More