Square
Following
Hot
News
Notifications
Profile
Share your thoughts
placeholder
Article
Why does the exchange show a profit, while the amount you actually make after deducting all costs is much lower?

When reviewing their trades, many traders focus only on the difference between the buying and selling prices, while overlooking an important issue:

A profit on paper does not necessarily equal actual net profit.

In particular, in the cryptocurrency market, trading frequency, order types, holding time, and market liquidity can all affect the final result.

To find out whether a strategy can actually make money, you need to account for at least the following five types of costs.

I
post-image
Why can your account’s overall risk far exceed expectations even when you’ve only made a few trades?

Many traders review their positions one by one but overlook a more important question: Do these trades share a common source of risk?

Suppose you hold long positions in BTC, ETH, and SOL at the same time. On the surface, you hold three different assets; but if they are all affected by a broad market decline, a contraction in liquidity, or a drop in risk appetite, all three trades may lose money together.

These are three issues in portfolio risk that are often overlooked.

I. Correlation risk
post-image
BTC-0.67%
ETH-1.26%
SOL-0.77%
Trenches
mihao
m
bade
b
mihao
4Cxj...pump
Market Cap
$.
Change
.
24h Vol
$.
Holders
.
PIEVERSE
P
bade
b
PIEVERSE
0x0e...25a9
Market Cap
$.
Change
.
24h Vol
$.
Holders
.
HOLD
H
bade
b
HOLD
4iJ7...pump
Market Cap
$.
Change
.
24h Vol
$.
Holders
.
X
X
bade
b
X
9VZe...pump
Market Cap
$.
Change
.
24h Vol
$.
Holders
.
DacityCoin
D
bade
b
DacityCoin
DKYc...pump
Market Cap
$.
Change
.
24h Vol
$.
Holders
.
Why can some people follow the same trading signals consistently over the long term, while others keep changing their plans at critical moments?

Many traders are not lacking indicators or trading strategies.

They know where to enter, where to place a stop-loss, and how to manage position size.

But once they actually enter the market, everything changes.

When they are in profit, they worry about giving it back and close their positions early.

When they are losing, they refuse to admit their judgment was wrong and widen their stop-loss without authorization.

When the market rises, they fea
post-image
In the cryptocurrency market, many traders see BTC trading volume suddenly surge and assume the market is about to rise. But sometimes, volume increases significantly while the price fails to rise and instead falls. Why is that?

First, it’s important to understand that trading volume represents market activity, not simply buying pressure. Every trade involves both a buyer and a seller, so a surge in volume does not mean the price will necessarily rise.

First, rising prices on increasing volume. If the price continues to rise while volume increases, it suggests market participation is growing
post-image
BTC-0.67%
Trade CFDs for the Gold Airdrop: Rewards Worth 880,000 USDx, Up to 3,712 USDT Worth of XAUT https://www.gate.com/campaigns/6969?ch=9625&ref=VLARBF1YAG&ref_type=132
post-image
XAUUSD+0.41%
AIRDROP+0.00%
XAUT+0.30%
  • 1
usdc market updates
live-cover
LIVE1,923
Hey guys, are we playing basketball this afternoon?
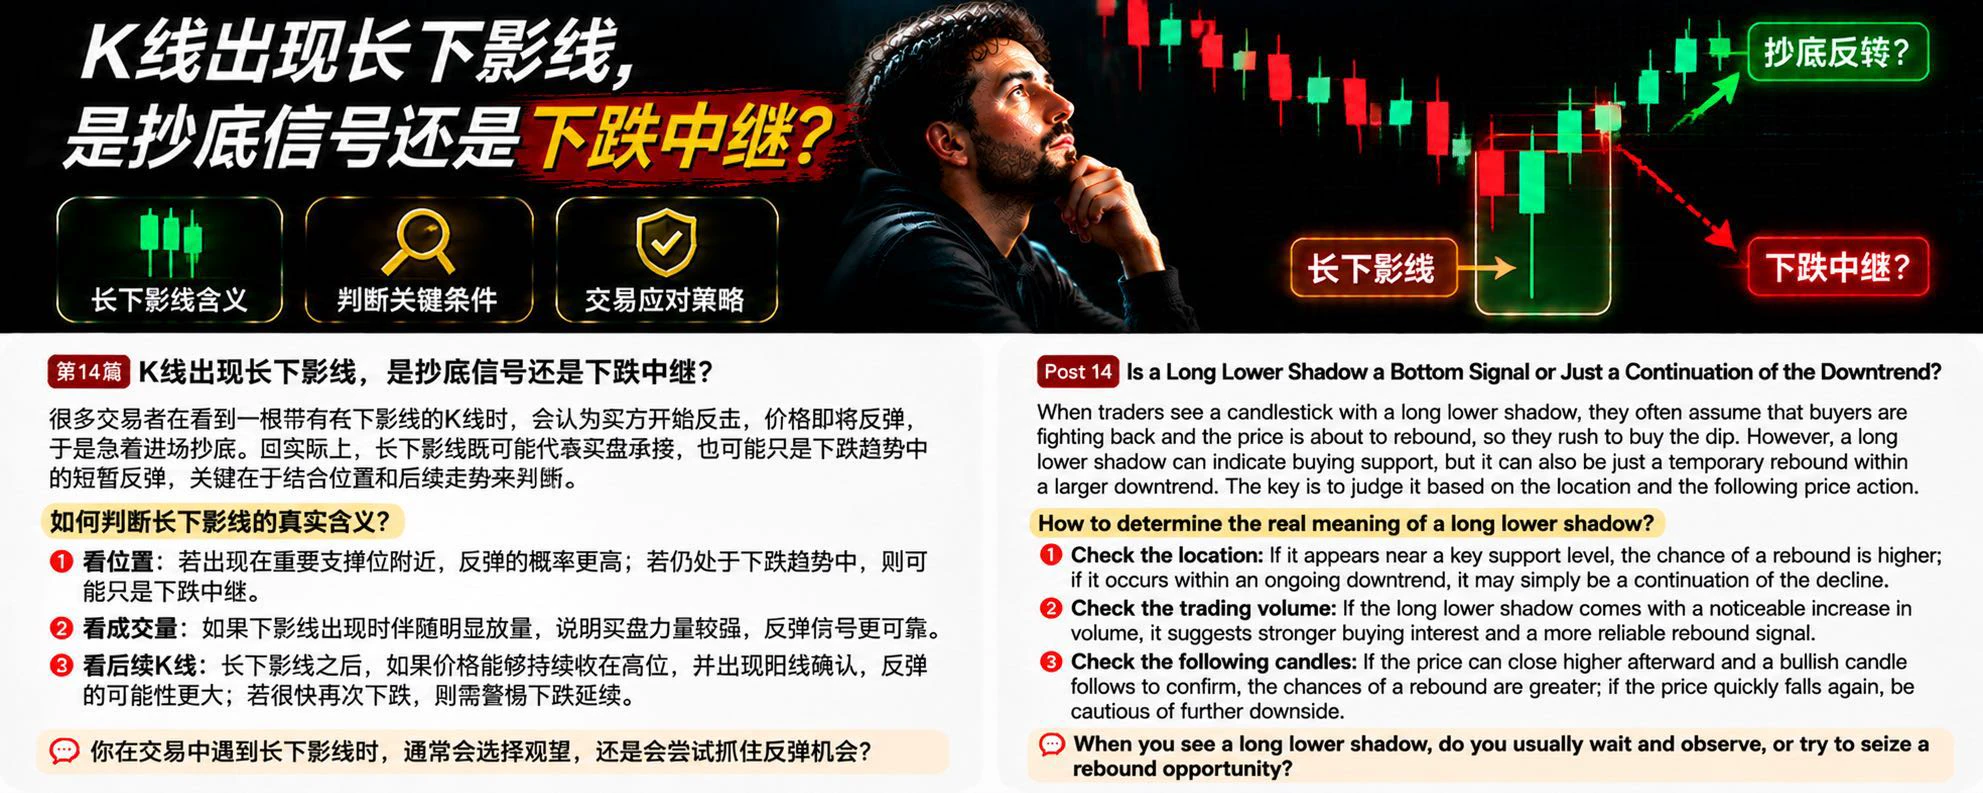
In BTC trading, many people see a candlestick with a long lower wick and assume buyers are starting to fight back and the price is about to rebound, so they rush in to buy the dip. But in reality, a long lower wick does not necessarily mean a trend reversal; it may just be a brief rebound during a downtrend.

So, how should you assess it?

First, look at where it appears. If a long lower wick forms near an important support level from earlier, it suggests that strong buying may have emerged after the price fell to this area, making the rebound signal relatively more meaningful. But if it appea
post-image
BTC-0.67%
From a writing standpoint, one has actually seen it, while the other has killed 😂.
post-image
I'm trading on Gate, a top-tier exchange with a 13-year track record. Come join me and dive into the hottest events right now! https://www.gate.com/campaigns/6750?ch=9557&ref=VLARBF1YAG&ref_type=132
post-image
  • 1
$BTC is testing the 200 SMA the ultimate last line of defense…
If this crucial support breaks, a drop toward the $65K–$67K zone becomes highly likely.
Eyes on the chart!
BTC-0.67%
UsDC market update
live-cover
LIVE2,042
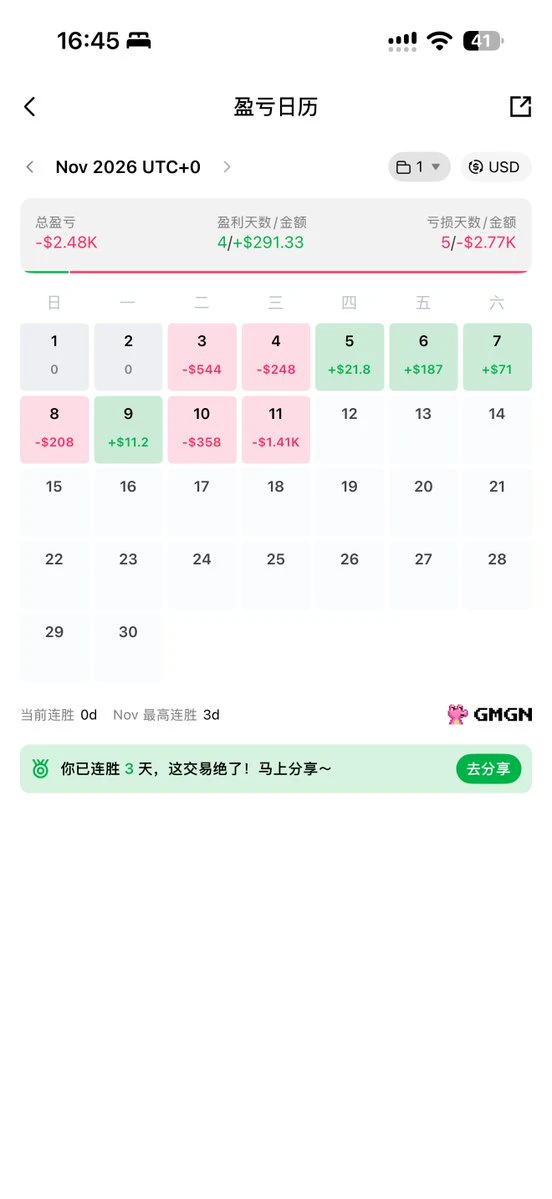
I’m done, I’m done. Lost it all again
post-image
$ES | Asset Synchronization
• 85% WR model | Middle Asset SMT Break.
ES+0.17%
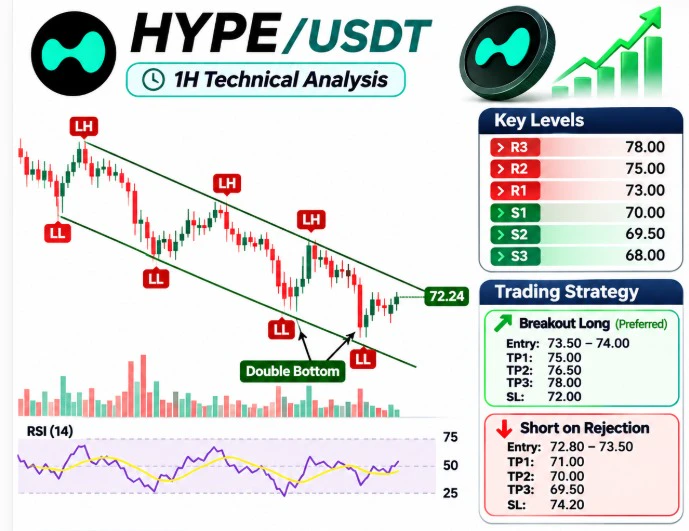
🚀 $HYPE /USDT – A Breakout Setup I’m Watching Closely!

I’ve been analyzing the 1H chart of HYPE, and price is showing some interesting signs of a possible bullish reversal. 👀

The price has been moving inside a descending channel, forming lower highs and lower lows. However, the recent double-bottom formation near the lower channel boundary suggests buyers are starting to step in.

My main focus is the $73 resistance level. I want to see a confirmed 1H candle close above $73 before considering a LONG entry. I don't want to enter before confirmation and get caught in a fake breakout.

📈 My
post-image
HYPE+0.33%
CC+0.13%
CT-11.85%
CAP+8.34%
C-0.01%
Gate Square New Creator Program: Post to Earn Rewards and Enjoy Double Exposure for 14 Days https://www.gate.com/campaigns/6880?ref=VLARBF1YAG&ref_type=132
post-image
In the cryptocurrency market, many traders know some technical analysis methods yet continue to lose money repeatedly in choppy markets. The reason may not be that their technical skills are inadequate, but that they have failed to identify the current market condition.

The biggest difference between trending and choppy markets is how prices move.

First, in a choppy market, prices usually fluctuate repeatedly within a certain range, with resistance above and support below. If you follow a trend-trading approach—going long when you see prices rise and going short when you see them fall—you ca
post-image
When a trading strategy starts to fail, should you adjust its parameters or stop trading?

What’s truly dangerous isn’t that a strategy starts losing money, but that you don’t know why it’s losing and keep changing its parameters in an attempt to repair the returns curve.

A strategy may have worked in the past, but the market won’t keep behaving the same way forever.

Trends may turn into range-bound markets, liquidity may decline, trading costs may rise, and entry signals that once worked may gradually lose their edge.

So how should you make the call?

Step 1: Determine whether you’re seein
post-image
11.11
BTC currently has two 4-hour MACD segments, combined with an RSI oversold bullish divergence, but trading volume is still low and the rebound is very weak. Bearish momentum is weakening, so watch for a rebound here to test 75000, as I also mentioned on yesterday’s livestream.

A reversal is only possible if the 75000 resistance is broken and holds.
Spot is currently an opportunity to build a position; everyone built positions in 10 ETH yesterday. Futures traders can establish a starter position to capture a short-term long trade. We’re still watching how U.S. stocks drive BTC tonight$BTC
post-image
BTC-0.65%
ETH-1.23%
  • 1
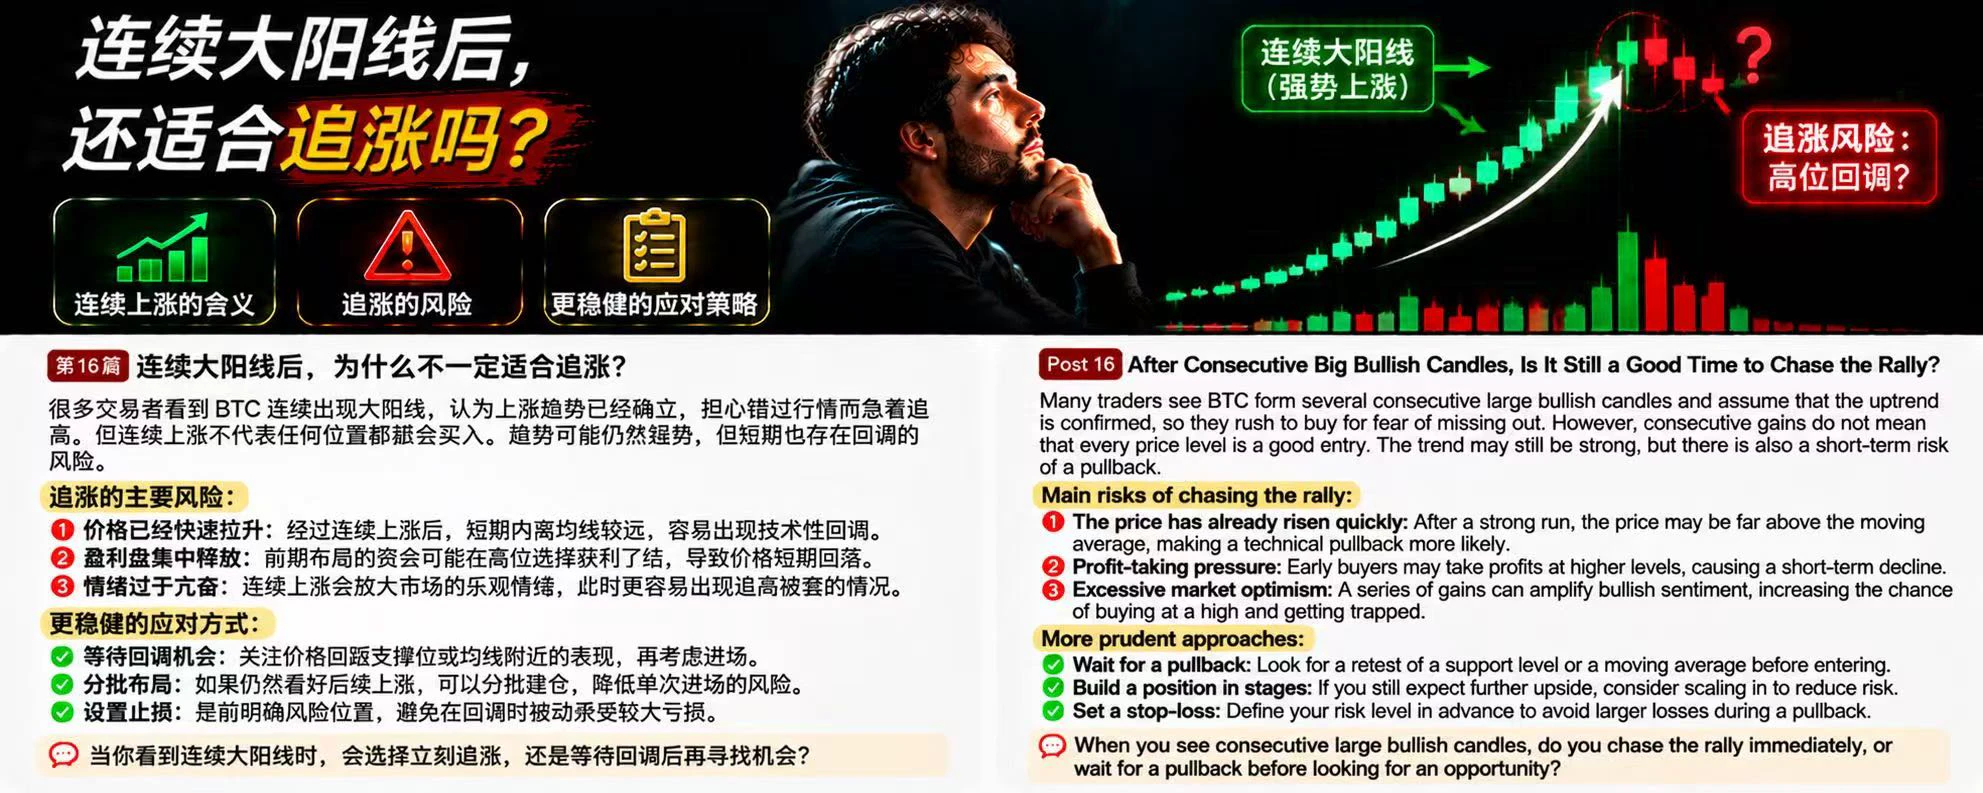
In BTC trading, many people see several large bullish candles appear consecutively and assume the uptrend is fully established. Worried about missing out, they rush to chase the rally. But consecutive gains do not mean every price level is suitable for buying. Sometimes, the faster the rally, the more wary you should be of short-term pullback risks.

Why isn't it necessarily a good idea to chase a rally after several large bullish candles?

First, the price may have moved too far from a reasonable level. After consecutive gains, the short-term price may be far from the moving averages. The mar
post-image
BTC-0.67%
Load More

Join 40 M users in our growing community

⚡️ Join 40 M users in the crypto craze discussion

💬 Engage with your favorite top creators

👍 See what interests you

Trending Topics

GateGlobalComplianceExpansion

15.89k Views352 Discussing

Gate continues to expand its global compliance footprint, now covering 81 regulated jurisdictions across Europe, North America, Asia, and Oceania. From MiCA and U.S. state-level MTLs to Japan’s FSA, Dubai, and Australia-related regulatory approvals, global exchanges are entering a new stage of compliance competition. Do you think regulatory strength will become as important as products and liquidity for exchanges in the future?

USOctoberCPIBeatsExpectations

87.04k Views2.65k Discussing

AnthropicIPOValuationCouldReach1.4T

12.22k Views1.61k Discussing

View More