
Share your thoughts
placeholder
Article
Everyone’s staring at the wrong side of NEAR while the 4H quietly flips the script.

$NEAR /USDT - LONG

Trade Plan:
Entry: 2.1670 – 2.1918
SL: 2.0599
TP1: 2.2690
TP2: 2.3287
TP3: 2.4183

Why this setup?
- My setup says LONG with 95% confidence, yet the 15m RSI is bloodied at 38.57—that’s the classic “bullish shakeout” fingerprint.
- Price is parked at 2.1794, hugging the 1H ATR (0.0497) like a coiled spring. The 1D trend is still bullish, so this dip is the invitation, not the obituary.
- Why now? The “Waiting” status is the tell—the market is loading the cannon before TP1 at 2.2690 an
NEAR+1.93%
Layout for Bitcoin, Ethereum, and Dogecoin
live-cover
LIVE2,582
  • 1
Crypto Signals and Trding Insights
live-cover
LIVE1,257
Gemini on Android can shrink into a floating spark bubble so you keep the chat while you use other apps.
Open the Gemini overlay, ask something, then tap Minimize (or tap outside after a reply). It collapses to a spark bubble. Tap to expand. Drag to move or dismiss.
Would you leave Gemini parked on your home screen?
I originally planned to cut my losses as a sacrifice to the heavens, but the ritual never happened—the meat roasted itself.
With green filling the screen, $XAU kept oscillating around 4474.29, while the sell walls grew thinner each time. There was clearly no big money looking to take the other side. The rebound lacked volume and support, so I followed the trend and entered a short.
I switched over casually and saw it had already dropped to 4438.98, giving me a full +72.11% on paper. That was real meat on the table. It dragged its feet earlier, but the result tastes just as good.
Take profits
post-image
XAU+0.09%
XRP+1.27%
BNB+7.26%
$AKE Hold forever; 1,000x is the goal.
AKE+42.64%
$AKE Signal】Long + Negative Funding Rate Short Squeeze
$AKE Funding rate -0.0437%: shorts are paying to hold positions, order book depth imbalance 8.13%, Bid/Ask 1.18. The 1H candlestick pulled back to EMA20 before bouncing with a lower wick; current price 0.01908 is near the Bollinger middle band. The 4H MACD histogram remains positive, RSI 63, with no signs of overbought conditions.
🎯Direction: Long
⚡Entry/Limit order: 0.0190228 - 0.0190800, current price can be entered directly
🛑Stop-loss: 0.0181260
🚀Target 1: 0.0205110
🚀Target 2: 0.0212265
🛡️Trade management:
- Upon reaching Target 1
post-image
AKE+42.64%
BTC+0.17%
ETH+1.23%
SOL+1.68%
FORCED LIQUIDATION
$NIKE
post-image
NKE-0.70%
Everyone’s staring at BTC—but ZEC just printed a 95% confidence LONG signal that nobody sees yet.

$ZEC /USDT - LONG

Trade Plan:
Entry: 1011.11 – 1018.97
SL: 977.33
TP1: 1043.32
TP2: 1062.18
TP3: 1090.46

Why this setup?
Why now? The 4h timeframe is screaming bullish while the 1D trend confirms it. RSI on the 15m sits at 47.77—not overheated, just coiled. ATR (1h) is 15.71, giving us room to run toward TP1 at 1043 without breaking a sweat. Entry zone: 1011–1019. This isn’t a gamble; it’s a high-probability setup with invalidation at 874.71. The market is waiting—but the clock is ticking.
ZEC-0.66%
Everyone’s long XLM, but the 4H clock just ticked against the crowd.

$XLM /USDT - SHORT

Trade Plan:
Entry: 0.18373 – 0.18449
SL: 0.18771
TP1: 0.18141
TP2: 0.17960
TP3: 0.17690

Why this setup?
Why now? The range-bound 1D trend is your tell—no momentum to break higher.
- RSI (15m) at 48.2: neutral, giving sellers room to push without overbought friction.
- ATR (1h) at 0.0015: tight volatility—perfect for a clean slide to TP1 (0.18141) and TP2 (0.17960).
- Entry at 0.18411 is armed; invalidation sits at 0.18203, so the risk is defined and tight.

Debate:
Is XLM faking the dip below 0
XLM+3.05%
Most traders will ignore this 95% confidence SHORT until it's too late.

$LAB /USDT - SHORT

Trade Plan:
Entry: 0.07452 – 0.07498
SL: 0.07695
TP1: 0.07310
TP2: 0.07200
TP3: 0.07036

Why this setup?
Why now? The 1D trend is bearish, and $LAB /USDT is stalling at 0.07475—just above the invalidation line at 0.07428. RSI on the 15m sits at 50.03, showing zero bullish momentum. The 4h setup targets 0.07310 first, then 0.07200. If we lose 0.07428, the thesis dies—but that's a 0.6% risk for a 3.7% move down to TP3.

Debate:
Is the dip to 0.07200 the real play, or do you think 0.07475 holds as fak
LAB+2.03%
A few days ago, my hand trembled slightly as I set a stop-loss before bed. Looking at it this morning, I had simply scared myself. When $ETH plunged intraday, I saw that the pullback held and knew someone was catching it below.
Once the pullback held and buying gradually strengthened, it would have been hard to justify staying out of this setup. I opened a long at 2451.64, set the stop-loss, and stopped watching the chart.
Now the market has given us the answer: it surged straight to 2478.11, with +187.77% unrealized profit sitting there. Feels good, brothers. That was a satisfying bite of me
post-image
ETH+1.23%
BTC+0.17%
XRP+1.27%
The hand that set the stop-loss a few days ago trembled slightly; this morning, I realized that was unnecessary filial piety. Before bed, I placed the short order for $TUT , and when I woke up, the candlestick had already completed most of the move for me 😏
Watching the market at the time, the rebound had no volume, and every push upward felt weak. The selling pressure above was obvious—someone was rushing to exit every time the price tested a high. This structure was not a breakout, but a bull trap. I set the entry at 0.042201 in advance; when it was time to short, I shorted without hesitati
post-image
TUT+25.17%
SNDK+1.73%
BNB+7.26%
Everyone’s watching 54.17 on $LTC /USDT—but the real trap is what happens below 52.79.

$LTC /USDT - SHORT

Trade Plan:
Entry: 54.02 – 54.32
SL: 56.01
TP1: 52.79
TP2: 51.87
TP3: 50.49

Why this setup?
- 1D trend is *range*, yet 4h momentum is screaming SHORT with 77% confidence.
- RSI on 15m sits at 50.5—no bounce fuel left; price is stalling right under resistance.
- ATR (0.59) shows low volatility—perfect setup for a slow bleed to TP1 (52.79) before a quick flush to TP2 (51.87).
- Why now? Entry zone 54.02–54.32 is a magnet for late longs, but invalidation at 51.03 is far—room to ru
LTC+7.69%
Nonfarm payrolls beat expectations—should BTC be cautious? The real pressure comes from here
U.S. nonfarm payrolls increased by 162,000 in August, far exceeding market expectations, while the unemployment rate held at 4.1%. After this data was released, the market's first reaction was very direct: expectations for Fed rate cuts cooled, and interest rates once again became the “sword of Damocles” hanging over risk assets.
For BTC, this logic is particularly important.
Over the past period, one of the core narratives driving the crypto market higher has been improving liquidity. If the U.S. econ
NVDA+0.87%
  • 45
$ZEC #ZCASH #ZECUSD
ZEC Pullback Setup 📉
After hitting a new All-Time High (ATH),
ZEC is
showing signs of a potential pullback.
🔴 Resistance: $1,040–$1,050
🎯 Target: $830 or Down
🟢 Support: $770–$820
Expecting a retracement from
the $1,050 area toward $830 or lower.
The $1,040–$1,050 zone is
now a fresh resistance
area to watch closely.
Not Financial Advice.
$BTCUSD $ETHUSD $XRP
post-image
ZEC-0.54%
XRP+1.34%
  • 1
15 years ago today, Bitcoin was $8
Me 15 years ago :
post-image
BTC+0.17%
  • 1
I don’t chase after a volume-backed surge; that’s a rule I set for myself. When $ETH surged to 2485.57, volume did indeed pick up, but such a sudden expansion often means short-term divergence is intensifying, and chasing in makes it easy to get stuck at the top.

I entered my long position earlier, when the price repeatedly tested the key level around 2394.32. The key level held each time, and the rebounds after each pullback kept getting faster. I got the feeling that someone was accumulating at lower levels, so I followed and went long.

After the move played out, I still took profit on
post-image
ETH+1.23%
ZEC-0.66%
ADA+3.98%
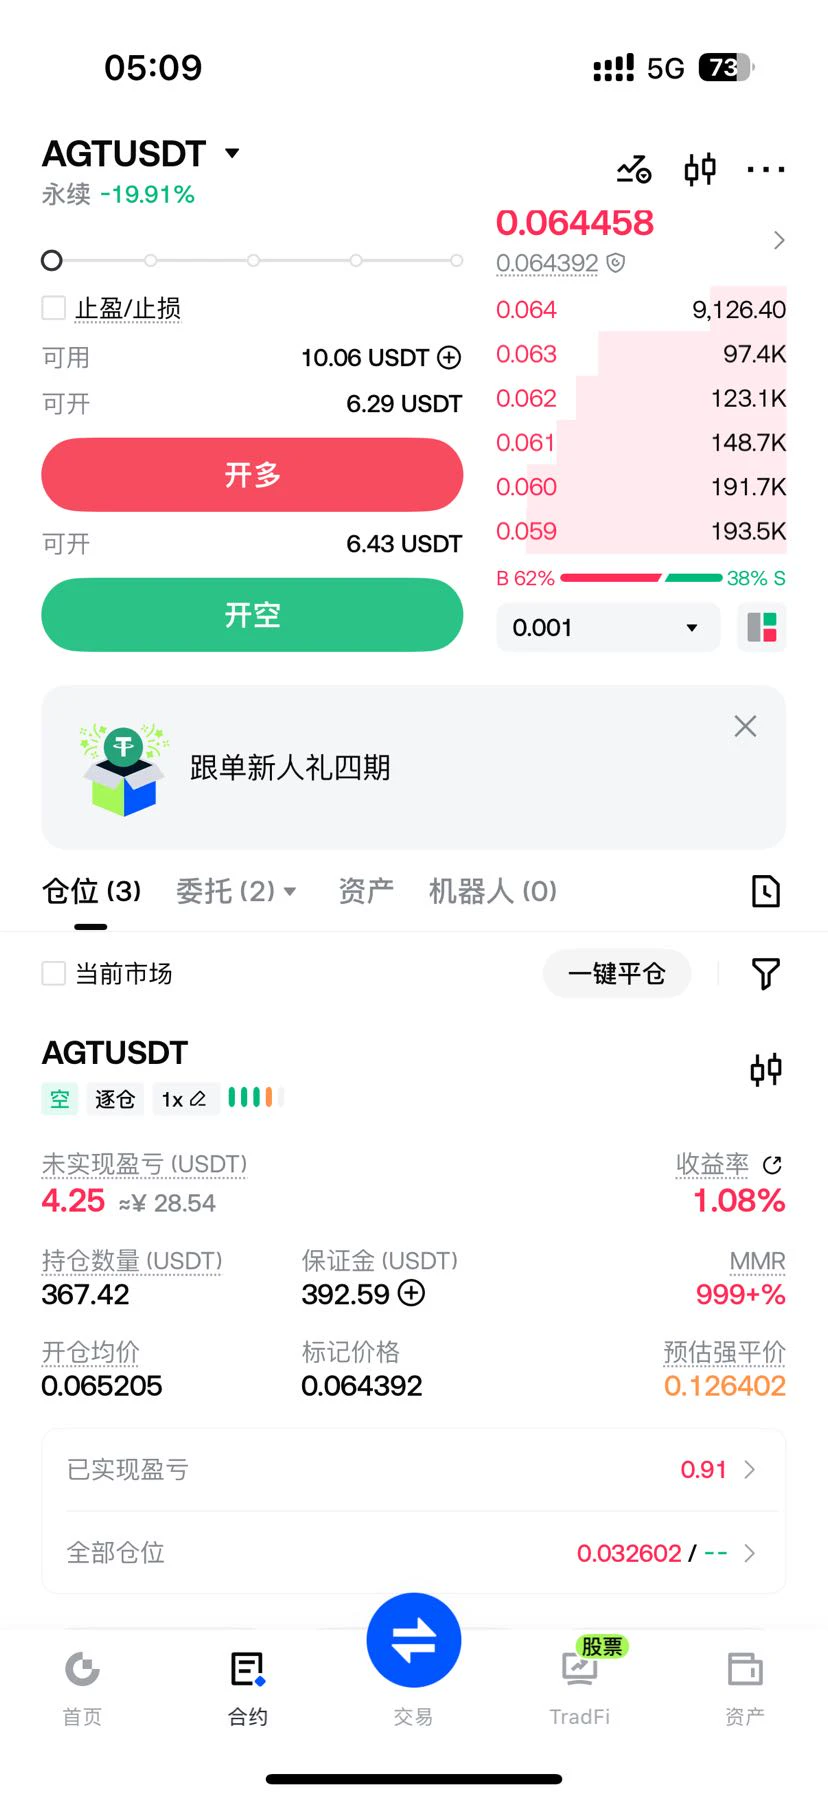
$BULLA seems to be out of fuell.
L/S ratio is extreme - around 0.3 and only going lower while price going sideways.
I'm holding short from 0.0848, without stop-loss for now, just watching the price online to close it manually if trend turns bullish.
#BULLA
post-image
BULLA+212.88%
Everyone’s staring at $HOME /USDT’s 0.0061—but the 95% short signal says they’re looking at the wrong exit.

$HOME /USDT - SHORT

Trade Plan:
Entry: 0.0061 – 0.0061
SL: 0.0062
TP1: 0.0060
TP2: 0.0060
TP3: 0.0059

Why this setup?
Why now? The 1D trend is bearish, and 4h momentum is cracking. RSI (15m) at 53.37 is a weak bounce, not a reversal—it’s the last gasp before the drop. Entry 0.0061, TP1/TP2 at 0.0060 (tight but real), TP3 at 0.0059. Invalidation is clear: 0.0062. That’s a 1:2 risk-reward with a 95% confidence stamp—don’t overthink the micro-noise.

Debate:
Are you fading this 15m R
HOME+2.00%
Load More

Join 40 M users in our growing community

⚡️ Join 40 M users in the crypto craze discussion

💬 Engage with your favorite top creators

👍 See what interests you

View More