
Square
Following
Hot
News
Profile
Share your thoughts
placeholder
Article
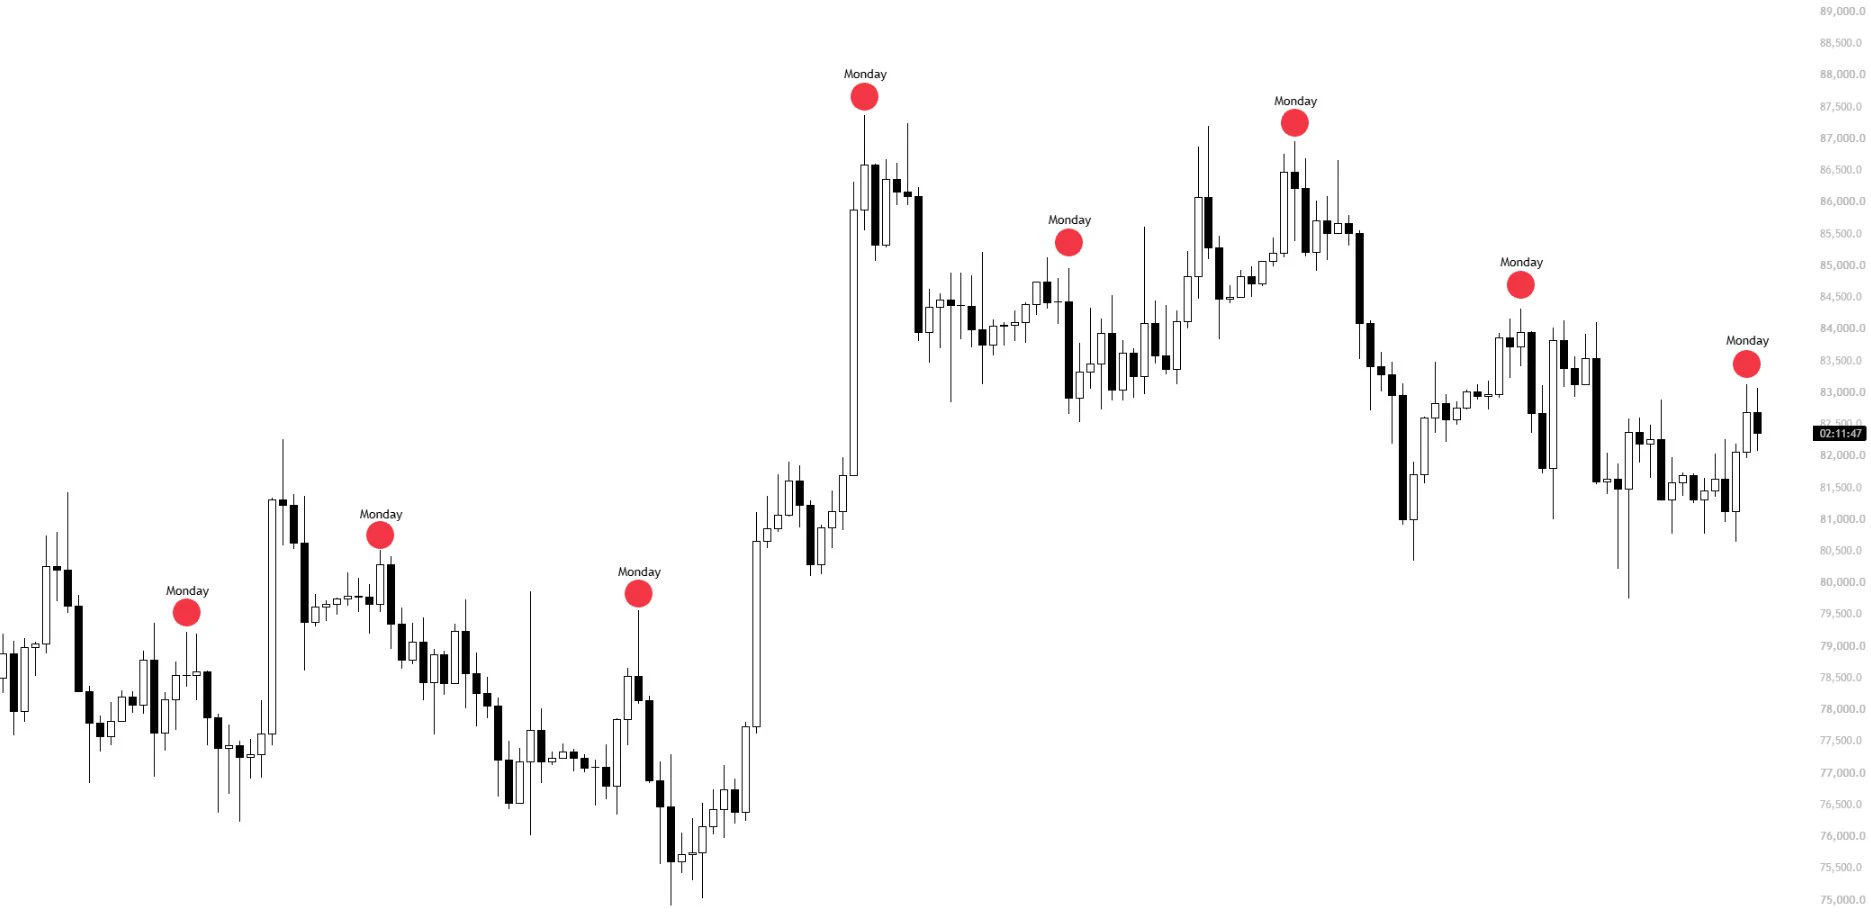
Most people are waiting for a breakout, but I think it will drop first.$BTC August’s PPI was the worst in four years, yet it still closed in the green, dipping to 79,694 before climbing back to 82,360. The real signal of a drop is never bad data—it’s when bad data can’t push the price down. What are you seeing on-chain? Follow me for continued monitoring. #Bitcoin
post-image
BTC+0.85%
10/16 Intraday Strategy: Negative News Priced In, Oversold Rebound, Middle East Risks, Grid Shorting at Highs
The market digests all information. Both positive and negative news will be priced in, and often over-prices it, producing extremely euphoric or extremely panic-driven moves. A “safe zone” emerges after this “over-pricing,” creating both risks and opportunities.
After the PPI data was released last night, it came in above expectations. The market fell briefly before rebounding sharply, with ETH rising from 2,322 to 2,467, a gain of 145 points. The reason was that “the negative news had
ETH+1.08%
anyway all ragebait posts & misogynistic retweets aside;
- I remain bullish on HTF, Q4, 2027-2028
- I don't think we trade under 65-70k ever again, bear lows were in and I will ride my bottom buys into the end of decade
- Macro is a bit scary here, things could get choppy, nothing goes up in a straight line
- On macro point however, many headwinds right now that, for most of the time throughout history, usually resolve themselves and become tailwinds for risk/liquidity driven assets
- Spot and chill is key, have liquidity for high conviction trades, slam them hard when they come
- There will b
post-image
Analysis of Gold XAU, BTC, ETH, etc.
Beijing Time October 16, 2026
Key News Today
• U.S. initial jobless claims came in at 199K (expected 200K, previous 198K), slightly below expectations, with the labor market remaining relatively tight.
• After hotter-than-expected September CPI, U.S. Treasury yields and the dollar briefly strengthened, but yields fell and the dollar weakened today, while gold rebounded from lows of 4073–4085 to around 4170.
• Shipping attacks in the Strait of Hormuz continue, alongside Iran's new tactics and Houthi attacks on Saudi targets. Combined with a sharp decline
XAUUSD-0.22%
If you can't hold, go work in a factory; if you can't hold, go to prison!
FiL production cut by 50%, unlocking completed, cumulative supply reduced by 77%
A hard-fork upgrade will take place on October 19.
Absolutely bullish news. I boldly predict that those who sell below $3 will most likely be selling halfway up!
FIL+6.35%
Name the #ticker $________
post-image
Layout: Bitcoin, Ethereum, Dogecoin
live-cover
LIVE880
  • 4
might take profits soon
post-image
How to Manage Your Positions After a Crash? Let Me Share My Hands-On Experience Using Gate
We’ve talked about a lot of analysis and judgments before, so in this final article, let’s discuss something practical—how to manage your positions on Gate after a crash?
Step one: First, assess your position exposure. If you hold spot or futures positions related to SK hynix, SanDisk, Samsung, and others, the first thing you need to do is understand the size of your risk exposure. On Gate, the open interest in SK hynix and SanDisk futures accounts for 15.8% and 18.15% of the entire market, respectively,
SK Hynix-11.06%
SKHY+2.39%
SKHYNIX-0.84%
SNDK+1.55%
SNDKG+1.66%
$BNB BNBUSDT: +3.4% bounce off $709 — $735 resistance decides next
BNB outperformed in today's ~$1B liquidation cascade. While ETH fell 5%+ and BTC broke $81K, BNB finished green (+0.5%), bouncing 3.4% from $709 to $733, just below its $735.3 24h high. The question is whether this is genuine relative strength or a slower bleed while markets digest hot US inflation data.
Daily: Price fell from $745–747 (Oct 14) to a $709 wick (Oct 15 02:00 UTC), then recovered to $733.2, still ~1.6% below the selloff origin. Recovery remains corrective until $740+ flips to support.
4H: A $745 → $709 down-leg wa
post-image
BNB-0.22%
$TRX TRXUSD H4 | Sweep Low Reclaimed, Long Toward 0.3449
TRON sold off through the weekly range and swept to about 0.3270, then bounced hard to the 0.334 area. It has now pulled back into the 0.3302 support line, which is the level I’m watching for a long. The weekly pivot (PP 0.332378, Pivot Hybrid, from last week’s H 0.337120 / L 0.330590 / C 0.330900) sits just above, so reclaiming it is the first step.
Why I’m leaning long
Sweep and reclaim. The dip to 0.327 took out the weekly low and was bought fast. That’s a liquidity grab, and the bounce held above it.
Higher low on the pullback. The r
post-image
TRX-0.02%
$BTW Long plan: 4-hour chart support at 1.908–1.925
Buyers must hold this area to maintain dominance. I will watch whether they can defend it here and avoid chasing the price. Why focus on this level: - The 4-hour price is 1.92, above the EMA50 at 1.81, favoring buyers - The stop-loss risk is 6.4%, while the potential TP3 gain is 10.3%, giving a favorable risk-reward ratio - BTC's short-term trend is bullish, providing support🟢 Long · Entry 1.908–1.925 · Take profit 1.990 / 2.039 / 2.113 · Stop loss 1.794
Not investment advice · Do your own research
post-image
BTW-22.97%
BTC+0.85%
First, a word for the bullish side $AAVE , then one for the bearish side.
The bullish side needs to prove that someone is buying above 158.98; the bearish side needs to prove that nobody is catching it after 147.05 gives way. $AAVE is currently at 158.72, up 3.44% over 24 hours. The 1-hour support is 147.05, resistance is 158.98, and current volume is 0.23 times the average volume of nearly 20 candles.
Before either side has fully presented its evidence, I’m more focused on the fact that $AAVE’s price has already moved, while trading activity and volume have not kept up. We can temporarily bel
post-image
AAVE+2.27%
BTC UPDATE
live-cover
LIVE87
No talent? Then repeat!
Good morning, my world❤️
post-image
Spam 🤷🏻‍♂️😁
post-image
$INJ Short setup… price is testing a strong resistance zone INJ has surged strongly from around 7.05 to the 8.50–8.56 resistance zone. The rebound momentum is strong, but this is exactly where I would stop chasing longs. Short entry: 8.30–8.60 (filled) Next target price: 8.20 Take profit 1: 8.00 Take profit 2: 7.80 Final target: 7.65 Stop-loss: 9.00 After the rapid rebound, the move is beginning to look somewhat overextended, while the price is currently just below resistance. If buyers fail to break through 8.56 effectively, I expect the price to first pull back to test around 8.20, followed
post-image
INJ+11.39%
The top gainers look overheated... a pullback may be next. The strongest performers are already noticeably stretched after their sharp rallies. $AG is up about 99%, $SIREN is up about 44%, $ICNT is up about 27%, while $BAT and CYPH are also rallying strongly.
After such rallies, I don’t like chasing green candles. I first watch for a pullback and consolidation phase. If momentum starts to weaken, these top gainers can easily give back part of their gains before choosing their next direction. For now: AGT — the biggest gainer and most extended, with the highest pullback risk SIREN — still m
post-image
ICNT+28.10%
I checked @CoinMarketCap 's market movements, and $NEAR is among the tokens showing positive momentum.
What makes this project interesting to me is that it goes beyond token price. NEAR is building blockchain infrastructure focused on scalability, user-friendly applications, cross-chain transactions, and AI-powered systems.
The ecosystem is positioning itself at the intersection of Web3 and AI, two areas worth watching as blockchain adoption evolves.
But here is my take: a green candle alone is not enough to make me bullish on a token. I want to see sustained momentum, healthy trading volume,
post-image
This woman is very wealthy, but she’s genuinely low-key.
Load More

Join 40 M users in our growing community

⚡️ Join 40 M users in the crypto craze discussion

💬 Engage with your favorite top creators

👍 See what interests you

Trending Topics

USSeptemberPPIBeatsExpectations

91.35k Views1.88k Discussing

US September PPI came in at 6.3% YoY, well above the 5.3% market expectation, pointing to renewed producer-side inflation pressure. Weekly jobless claims were 199K, broadly in line with forecasts. Could hotter inflation further reduce room for rate cuts, and what does it mean for $BTC, US stocks, and gold?

DrLinHanSpeaksAtOxfordUnion

135.63k Views1.86k Discussing

JapanAndKoreaStocksPlunge

47.27k Views1.76k Discussing

View More